

Synthesis of MoS2-based nanostructures and their applications in rechargeable ion batteries, catalysts and gas sensors: a review
- PMID: 35865576
- PMCID: PMC9257778
- DOI: 10.1039/d2ra01532c
Synthesis of MoS2-based nanostructures and their applications in rechargeable ion batteries, catalysts and gas sensors: a review
Abstract
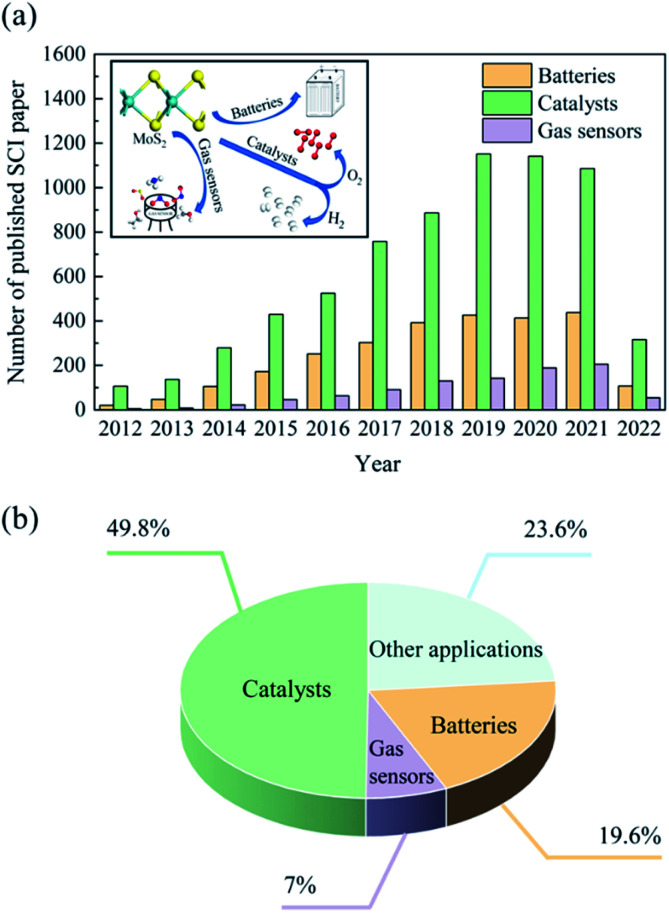
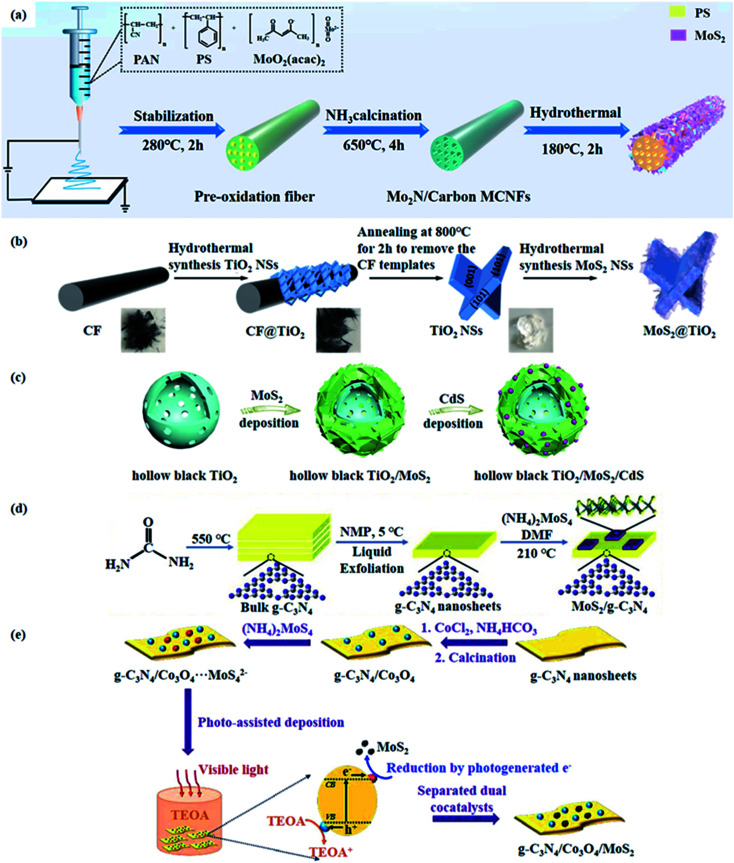
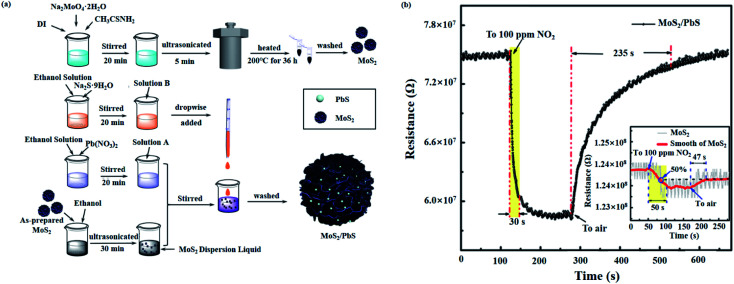
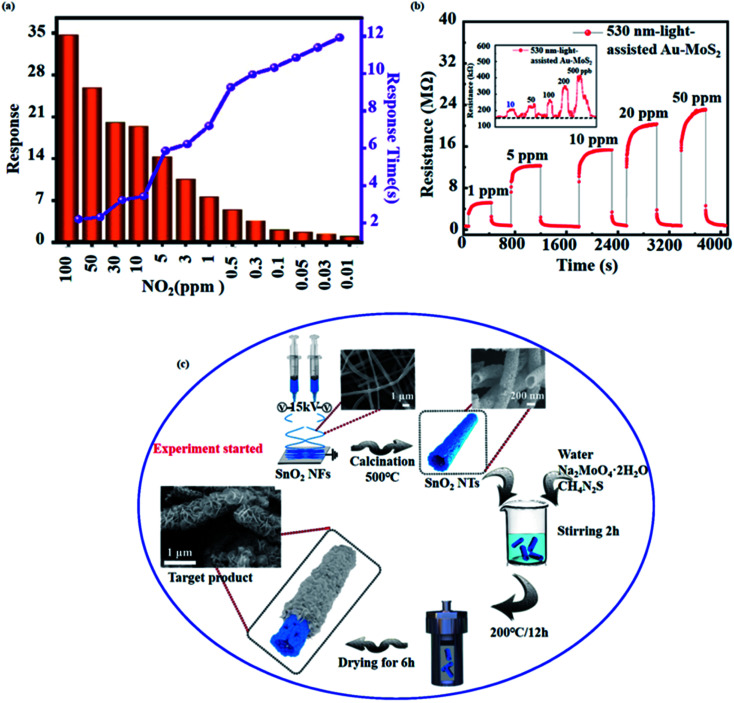
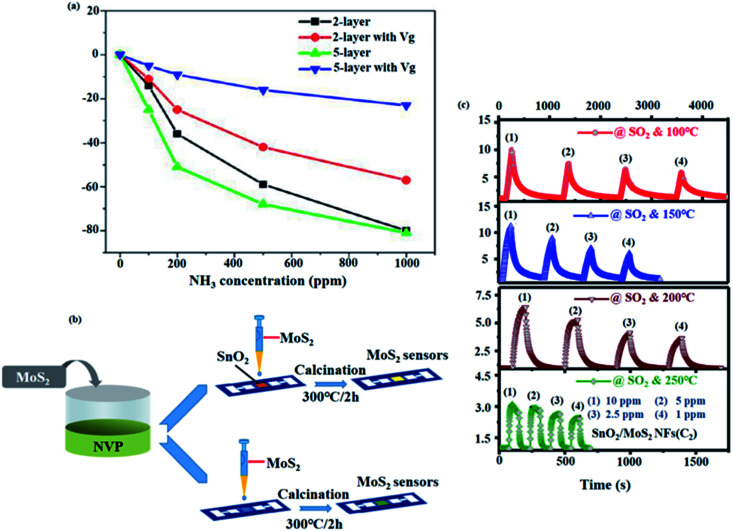
Molybdenum disulfide (MoS2) is a two-dimensional (2D) layered material with a graphene-like structure that has attracted attention because of its large specific surface area and abundant active sites. In addition, the compounding of MoS2 with other materials can enhance the performance in applications such as batteries, catalysts, and optoelectronic devices, etc. MoS2 is prepared by various methods, among which chemical deposition and hydrothermal methods are widely used. In this review, we focus on summarizing the applications of MoS2 and MoS2 composite nanomaterials in rechargeable ion batteries, catalysts for water splitting and gas sensors, and briefly outline the preparation methods.
This journal is © The Royal Society of Chemistry.
Conflict of interest statement
There are no conflicts to declare.
Figures
Similar articles
-
Molybdenum Disulfide Based Nanomaterials for Rechargeable Batteries.Chemistry. 2020 May 20;26(29):6296-6319. doi: 10.1002/chem.201905524. Epub 2020 Feb 26. Chemistry. 2020. PMID: 31967372 Review.
-
Heteroatom-Doped Molybdenum Disulfide Nanomaterials for Gas Sensors, Alkali Metal-Ion Batteries and Supercapacitors.Nanomaterials (Basel). 2023 Jul 26;13(15):2182. doi: 10.3390/nano13152182. Nanomaterials (Basel). 2023. PMID: 37570500 Free PMC article. Review.
-
Environmental Applications of 2D Molybdenum Disulfide (MoS2) Nanosheets.Environ Sci Technol. 2017 Aug 1;51(15):8229-8244. doi: 10.1021/acs.est.7b01466. Epub 2017 Jul 17. Environ Sci Technol. 2017. PMID: 28661657
-
Functionalization of 2D MoS2 Nanosheets with Various Metal and Metal Oxide Nanostructures: Their Properties and Application in Electrochemical Sensors.Biosensors (Basel). 2022 Jun 2;12(6):386. doi: 10.3390/bios12060386. Biosensors (Basel). 2022. PMID: 35735534 Free PMC article. Review.
-
Two dimensional atomically thin MoS2 nanosheets and their sensing applications.Nanoscale. 2015 Dec 14;7(46):19358-76. doi: 10.1039/c5nr06144j. Nanoscale. 2015. PMID: 26554465 Review.
References
-
- Butler S. Z. Hollen S. M. Cao L. Cui Y. Gupta J. A. Gutiérrez H. R. Heinz T. F. Hong S. S. Huang J. Ismach A. F. ACS Nano. 2013;7:2898–2926. - PubMed
-
- Bhimanapati G. R. Lin Z. Meunier V. Jung Y. Cha J. Das S. Xiao D. Son Y. Strano M. S. Cooper V. R. ACS Nano. 2015;9:11509–11539. - PubMed
-
- Wang Z. Mi B. Environ. Sci. Technol. 2017;51:8229–8244. - PubMed
-
- Wang H. Li C. Fang P. Zhang Z. Zhang J. Z. Chem. Soc. Rev. 2018;47:6101–6127. - PubMed
Publication types
LinkOut - more resources
Full Text Sources