. 2022 Jul 6;12(30):19667-19677.
doi: 10.1039/d2ra02091b. eCollection 2022 Jun 29.

Improvement of Cs detection performance and formation of CsCl and Cs nanoparticles by tuning graphene oxide quantum dot-based nanocomposite

Affiliations

Improvement of Cs detection performance and formation of CsCl and Cs nanoparticles by tuning graphene oxide quantum dot-based nanocomposite

Bangun Satrio Nugroho et al. RSC Adv. .

Abstract

A new nanocomposite was developed using functionalized graphene oxide quantum dots (GOQDs) with cesium green molecules for the first time. Although the cesium green molecule works effectively only in the solid-state, without water, and in basic conditions, the functionalized GOQDs with cesium green made the nanocomposite work well as a cesium (Cs) detector in mixed solution (distilled water/THF). The nanocomposite can be employed as a Cs detector in both acidic and basic conditions. The present study revealed that the nanocomposite of GOQDs with cesium green showed an enhanced photoluminescence in basic conditions, while the intensity of the photoluminescence in acidic conditions is the superposition of the photoluminescence of the corresponding components. The photoluminescence of the nanocomposite was quenched (turned OFF) after Cs treatment in basic conditions. On the other hand, in the acidic conditions it was found that the photoluminescence intensity of this nanocomposite was enhanced (turned ON) by the Cs addition in two different Cs concentrations, 0.06 mmol L-1 and 0.12 mmol L-1. In addition, the movement of the nanocomposite (after Cs addition) under the electron beams through TEM measurement was observed. The formation of CsCl and Cs nanoparticles was identified. Specifically, the Cs cluster occurrence is discussed by taking into account the mobility effect of the adatoms on the composite layer under electron beam irradiation.


Conflict of interest statement

There are no conflicts to declare.

Figures
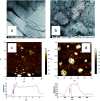
Fig. 1
Fig. 1. TEM imaging of (a) GO, scale bars: 200 nm, (b) GOQDs, scale bars: 50 nm. (c) AFM image of GO, and (d) GOQDs deposited on freshly cleaved silicon substrate.
Fig. 2
Fig. 2. UV-Vis absorbance of (a) GO, GOQDs. Photoluminescence emission spectra of (b) GOQDs before and after centrifugation process, (c) GOQDs in acidic and basic condition, cesium green in THF. (d) GO solution after reflux process (before centrifugation). (e) GOQDs solution after centrifugation.
Fig. 3
Fig. 3. Photoluminescence emission spectra of (a)composite-51, composite-81 in basic condition, (b) composite-51, composite-81 in acidic condition. (c) TEM image of GOQDs-based nanocomposite (composite-81). Scale bars: 50 nm. (d) High-resolution TEM image of individual nanodot (composite-81) labelled by red circle with inset of the Fast Fourier Transform (FFT) from the selected region. Scale bars: 5 nm.
Fig. 4
Fig. 4. Photoluminescence emission spectra of (a) composite-51 before and after Cs treatment for 0.12 mmol L−1 (in acidic condition), (b and c) composite-81 before and after Cs treatment for 0.12 mmol L−1 and 0.06 mmol L−1 (in acidic condition), (d) GOQDs after and before Cs treatment for 0.12 mmol L−1 (in acidic condition). A colour line (graphic) in each figure indicates the PL response signal by the additional amount of CsCl solution, with volume range 200 μL (orange), 400 μL (gray), 600 μL (yellow), and 800 μL (blue).
Fig. 5
Fig. 5. (a) TEM image of composite-81 after Cs treatment (in acidic condition), small black spots are identified with inset of HRTEM from the selected area. Scale bars: 20 nm. (b) Elemental analysis of figure (a). (c) HRTEM image of composite-51 after Cs treatment (in acid condition) with inset of the Fast Fourier Transform (FFT) from the selected region. Scale bars: 5 nm. (d) Elemental analysis of figure (c).
Fig. 6
Fig. 6. PL emission spectra of (a) GOQDs before and after Cs treatment for 0.12 mmol L−1 (in basic condition), (b) PL emission spectra of composite-51 before and after Cs treatment for 0.12 mmol L−1 (in basic condition), (c and d) PL emission spectra of composite-81 before and after Cs treatment for 0.12 mmol L−1 and 0.06 mmol L−1, respectively (in basic condition). A colour line (graphic) in each figure indicates the PL response signal by the additional amount of CsCl solution, with volume range 200 μL (orange), 400 μL (gray), 600 μL (yellow), and 800 μL (blue).
Fig. 7
Fig. 7. PL emission spectra of (a) composite-51 before and after K+ treatment for 0.12 mmol L−1 (in acidic condition), (b) composite-81 before and after K+ treatment for 0.12 mmol L−1 (in acid condition), (c) composite-51 before and after K+ treatment for 0.12 mmol L−1 (in basic condition), (d) composite-81 before and after K+ treatment for 0.12 mmol L−1 (in basic condition). A colour line (graphic) in each figure indicates the PL response signal by the additional amount of KCl solution, with volume range 200 μL (orange), 400 μL (gray), 600 μL (yellow), and 800 μL (blue).
Fig. 8
Fig. 8. PL emission spectra of (a) composite-51 before and after Sr2+ treatment for 0.12 mmol L−1 (in acidic condition), (b) composite-81 before and after Sr2+ treatment for 0.12 mmol L−1 (in acidic condition), (c) composite-51 before and after Sr2+ treatment for 0.12 mmol L−1 (in basic condition), (d) composite-81 before and after Sr2+ treatment for 0.12 mmol L−1 (in basic condition). A colour line (graphic) in each figure indicates the PL response signal by the additional amount of SrCl2 solution, with volume range 200 μL (orange), 400 μL (gray), 600 μL (yellow), and 800 μL (blue).
Fig. 9
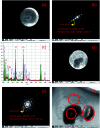
Fig. 9. TEM image of GOQDs after Cs treatment in basic condition (a) soon after TEM measurement was conducted. Scale bars: 200 nm. (b) Fast Fourier Transform (FFT) to figure (a). (c) Elemental analysis of figure (a). (d) After electron beam irradiation was applied for the second time. Scale bars: 200 nm. (e) Fast Fourier Transform (FFT) to figure (d). (f) Specific spot area of the observed sample of figure (d). Scale bars: 200 nm.

Similar articles

Cited by

References

    1. Yasunari T. J. Stohl A. Hayano R. S. Burkhart J. F. Eckhardt S. Yasunari T. “Cesium-137 deposition and contamination of Japanese soils due to the Fukushima nuclear accident”. Proc. Natl. Acad. Sci. U. S. A. 2011;108(49):19530–19534. doi: 10.1073/pnas.1112058108. - DOI - PMC - PubMed
    1. Basuki T. Miyashita S. Tsujimoto M. Nakashima S. “Deposition density of 134Cs and 137Cs and particle size distribution of soil and sediment profile in Hibara Lake area, Fukushima: an investigation of 134Cs and 137Cs indirect deposition into lake from surrounding area”. J. Radioanal. Nucl. Chem. 2018;316(3):1039–1046. doi: 10.1007/s10967-018-5809-1. - DOI
    1. TSUJIMOTO M. MIYASHITA S. NGUYEN H. T. NAKASHIMA S. “Monthly Change in Radioactivity Concentration of 137Cs, 134Cs, and 40K of Paddy Soil and Rice Plants in Fukushima Prefecture”. Radiat. Saf. Manag. 2020;19:10–22. doi: 10.12950/rsm.181219. - DOI
    1. Shizuma K. Fujikawa Y. Kurihara M. Sakurai Y. “Identification and temporal decrease of 137Cs and 134Cs in groundwater in Minami-Soma City following the accident at the Fukushima Dai-ichi nuclear power plant”. Environ. Pollut. 2018;234:1–8. doi: 10.1016/j.envpol.2017.11.018. - DOI - PubMed
    1. Radaram B. Mako T. Levine M. “Sensitive and selective detection of cesium via fluorescence quenching”. Dalton Trans. 2013;42(46):16276–16278. doi: 10.1039/c3dt52215f. - DOI - PubMed