. 2022 Mar;14(3):e2021MS002730.
doi: 10.1029/2021MS002730. Epub 2022 Feb 28.

Characterizing the Response of Vegetation Cover to Water Limitation in Africa Using Geostationary Satellites

Affiliations

Characterizing the Response of Vegetation Cover to Water Limitation in Africa Using Geostationary Satellites

Çağlar Küçük et al. J Adv Model Earth Syst. 2022 Mar.

Abstract

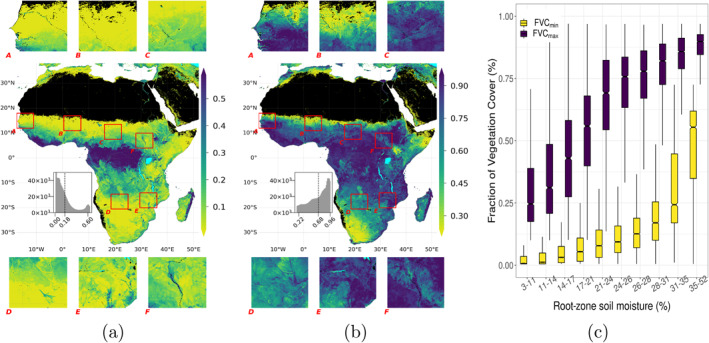
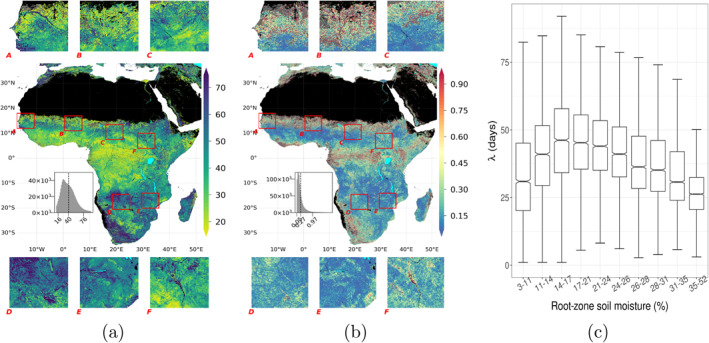
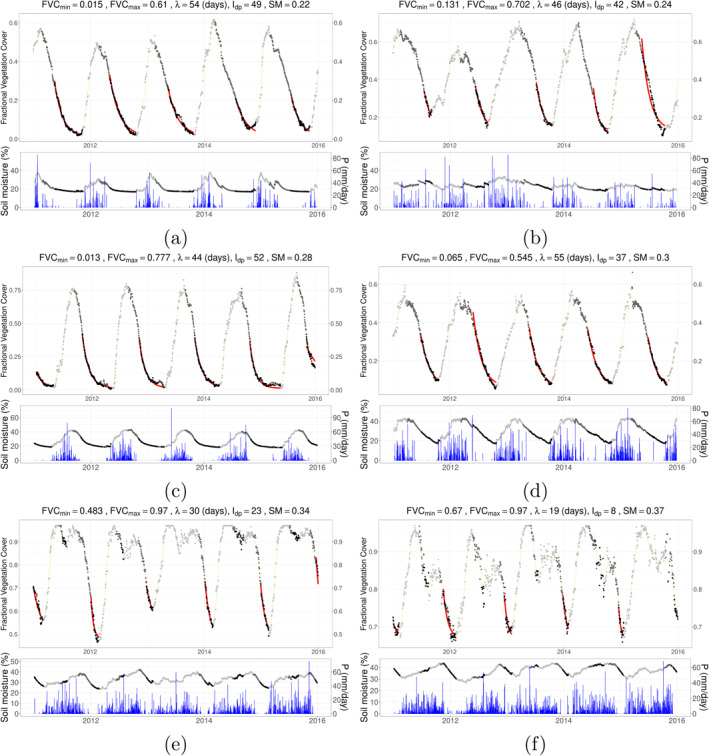
Hydrological interactions between vegetation, soil, and topography are complex, and heterogeneous in semi-arid landscapes. This along with data scarcity poses challenges for large-scale modeling of vegetation-water interactions. Here, we exploit metrics derived from daily Meteosat data over Africa at ca. 5 km spatial resolution for ecohydrological analysis. Their spatial patterns are based on Fractional Vegetation Cover (FVC) time series and emphasize limiting conditions of the seasonal wet to dry transition: the minimum and maximum FVC of temporal record, the FVC decay rate and the FVC integral over the decay period. We investigate the relevance of these metrics for large scale ecohydrological studies by assessing their co-variation with soil moisture, and with topographic, soil, and vegetation factors. Consistent with our initial hypothesis, FVC minimum and maximum increase with soil moisture, while the FVC integral and decay rate peak at intermediate soil moisture. We find evidence for the relevance of topographic moisture variations in arid regions, which, counter-intuitively, is detectable in the maximum but not in the minimum FVC. We find no clear evidence for wide-spread occurrence of the "inverse texture effect" on FVC. The FVC integral over the decay period correlates with independent data sets of plant water storage capacity or rooting depth while correlations increase with aridity. In arid regions, the FVC decay rate decreases with canopy height and tree cover fraction as expected for ecosystems with a more conservative water-use strategy. Thus, our observation-based products have large potential for better understanding complex vegetation-water interactions from regional to continental scales.

Keywords: Africa; ecohydrology; fractional vegetation cover; geostationary; water limitation.


Figures

Figure 1
Figure 1
Conceptual plot of the ecohydrological metrics derived from time series using synthetic data. Points represent observations for growing period, early decay period and decay period with dry‐down in light gray, gray and black, respectively. Decay and growth periods are defined by presence of decay, that is, first derivative of the time series, while dry‐down period is defined by the convexity of the decay, that is, using both first and second derivatives (see Section 3.4 for details). The shaded area shows the integral of FVC during decay period. The red curve shows the fitted line on the FVC time series during dry‐down using the asymptotic exponential decay function. All metrics presented in this study are shown in bold characters.
Figure 2
Figure 2
(a) Minimum asymptotic values of FVC, FVCmin, (b) maximum asymptotic values of FVC, FVCmax, and (c) box plot showing the variation of FVCmin and FVCmax with mean annual soil moisture. In the maps, histogram of the metrics mapped can be seen inside the main panel, with a dashed line indicating the mean values of the domain, as well as six insets to show local variability (See Appendix E for details of the insets). In all of the following box plots, binning of soil moisture is done automatically to equalize frequency of observations among the bins while median values per each bin are shown in the intermediate line of the boxes, with their 95% confidence intervals notched. Upper and lower edges of the boxes show the interquartile range (75th and 25th percentiles, respectively) while the error bars show 1.5 times the interquartile range.
Figure 3
Figure 3
Deviation of asymptote‐related metrics from their mean per root‐zone soil moisture bins with changing sand percentage, HAND, and TWI. Note that binning of the continuous variables in x‐ and y‐axes are done automatically to equalize frequency of observations among the bins of a given variable.
Figure 4
Figure 4
(a) Integral of FVC time series in the decay period, I dp , (b) variation of I dp , and (c) distribution of I dp within mean annual soil moisture. See Figure 2 for plotting details.
Figure 5
Figure 5
(a) e‐folding time of FVC time series during dry‐down (in days), λ, (b) variation of λ, and (c) distribution of λ within soil moisture. See Figure 2 for plotting details.
Figure 6
Figure 6
(a) Spearman's correlation coefficients between pairs of products related to plant accessible water content, namely Effective Rooting Depth from Yang et al. (2016), Rooting Depth from Fan et al. (2017), Accessible Water Storage Capacity (AWSC) from S. Tian et al. (2019), Root Zone Storage Capacity (RZS CRU2) from Wang‐Erlandsson et al. (2016), and integral of FVC during decay period (I dp ) presented in this study. Black dots indicate significant correlation with ρ > 0.05. (b) Covariation of λ and root‐zone soil moisture with canopy height, and tree cover. Note that binning of soil moisture, canopy height and tree cover are done automatically to equalize frequency of observations among the bins of the given variable.
Figure A1
Figure A1
The original FVC data product for a single day, taken from https://landsaf.ipma.pt/en/products/vegetation/fvc/.
Figure B1
Figure B1
FVC, soil moisture, and precipitation time series of sampled grid cells. Sampling is done to have one grid cell per each bin of soil moisture values given in the plots of the main manuscript. Points for both FVC and soil moisture are colored according to the state of vegetation activity as growing period is shown in light gray, decay period with dark gray while dry‐down during the decay period is shown in black. Fitted curve to estimate λ is shown with red lines while 31‐day smoothed FVC values are shown in orange lines at the upper panel, while daily precipitation values are shown with blue bars at the lower panel. Note that daily aggregated precipitation data is obtained from Tropical Rainfall Measuring Mission (TRMM) (2011).
Figure B2
Figure B2
Continuation of Figure B1 with samples having larger mean annual soil moisture.
Figure C1
Figure C1
Density plots of the ecohydrological metrics presented in this study.
Figure D1
Figure D1
Pixelwise Spearman's correlation of FVC and GLEAM root‐zone soil moisture in time for (a) entire time series and (b) time series marked as decay period using FVC.
Figure E1
Figure E1
Map of mean annual root‐zone soil moisture (%) in the center and satellite view of the insets. Map and image data of the insets: Google Earth ©2020 TerraMetrics.
Figure F1
Figure F1
Covariation of asymptote‐related metrics and root‐zone soil moisture with sand percentage, HAND, and TWI. Note that binning of the continuous variables in x‐ and y‐axes are done automatically to equalize frequency of observations among the bins of a given variable.
Figure G1
Figure G1
Variations in FVCrange (as FVCmax − FVCmin) (a) in space (b) with climatological aridity (c) similar to Figure 3a but for FVCrange (d) similar to Figure F1a but for FVCrange.
Figure H1
Figure H1
Integral of FVC time series in the decay period normalized by event duration (a) Spatial variation, (b) variation against within mean annual soil moisture (see Figure 2c for plotting details). (c) Density plot against I dp .
Figure I1
Figure I1
Number of decay periods in which the Algorithm 2 successfully converged.
Figure J1
Figure J1
Maps of accessible water storage capacity and Rooting Depth (RD) data sets used in this study. (a) Integral of FVC during decay period, I dp , (b) Root Zone Storage Capacity (RZS CRU2) using CRU as precipitation forcing data with 2 years of drought return period from Wang‐Erlandsson et al. (2016), (c) Accessible Water Storage Capacity from S. Tian et al. (2019) (d) Effective Rooting Depth from Yang et al. (2016), (e) RD from Fan et al. (2017). All products are aggregated to 0.5° and cropped for the study domain.

Similar articles

Cited by

References

    1. Adole, T. , Dash, J. , & Atkinson, P. M. (2016). A systematic review of vegetation phenology in Africa. Ecological Informatics, 34, 117–128. 10.1016/j.ecoinf.2016.05.004 - DOI
    1. Adole, T. , Dash, J. , Rodriguez‐Galiano, V. , & Atkinson, P. M. (2019). Photoperiod controls vegetation phenology across Africa. Communications Biology, 2(1). 10.1038/s42003-019-0636-7 - DOI - PMC - PubMed
    1. Akasheh, O. Z. , Neale, C. M. , & Jayanthi, H. (2008). Detailed mapping of riparian vegetation in the middle Rio Grande River using high resolution multi‐spectral airborne remote sensing. Journal of Arid Environments, 72(9), 1734–1744. 10.1016/j.jaridenv.2008.03.014 - DOI
    1. Amatulli, G. , McInerney, D. , Sethi, T. , Strobl, P. , & Domisch, S. (2020). Geomorpho90m, empirical evaluation and accuracy assessment of global high‐resolution geomorphometric layers. Scientific Data, 7(1), 1–18. 10.1038/s41597-020-0479-6 - DOI - PMC - PubMed
    1. Anderegg, W. R. , Konings, A. G. , Trugman, A. T. , Yu, K. , Bowling, D. R. , Gabbitas, R. , et al. (2018). Hydraulic diversity of forests regulates ecosystem resilience during drought. Nature, 561(7724), 538–541. 10.1038/s41586-018-0539-7 - DOI - PubMed

LinkOut - more resources