. 2022 Jun;127(6):e2022JE007189.
doi: 10.1029/2022JE007189. Epub 2022 Jun 4.

Hazy Blue Worlds: A Holistic Aerosol Model for Uranus and Neptune, Including Dark Spots

Affiliations

Hazy Blue Worlds: A Holistic Aerosol Model for Uranus and Neptune, Including Dark Spots

P G J Irwin et al. J Geophys Res Planets. 2022 Jun.

Abstract

We present a reanalysis (using the Minnaert limb-darkening approximation) of visible/near-infrared (0.3-2.5 μm) observations of Uranus and Neptune made by several instruments. We find a common model of the vertical aerosol distribution i.e., consistent with the observed reflectivity spectra of both planets, consisting of: (a) a deep aerosol layer with a base pressure >5-7 bar, assumed to be composed of a mixture of H2S ice and photochemical haze; (b) a layer of photochemical haze/ice, coincident with a layer of high static stability at the methane condensation level at 1-2 bar; and (c) an extended layer of photochemical haze, likely mostly of the same composition as the 1-2-bar layer, extending from this level up through to the stratosphere, where the photochemical haze particles are thought to be produced. For Neptune, we find that we also need to add a thin layer of micron-sized methane ice particles at ∼0.2 bar to explain the enhanced reflection at longer methane-absorbing wavelengths. We suggest that methane condensing onto the haze particles at the base of the 1-2-bar aerosol layer forms ice/haze particles that grow very quickly to large size and immediately "snow out" (as predicted by Carlson et al. (1988), https://doi.org/10.1175/1520-0469(1988)045<2066:CMOTGP>2.0.CO;2), re-evaporating at deeper levels to release their core haze particles to act as condensation nuclei for H2S ice formation. In addition, we find that the spectral characteristics of "dark spots", such as the Voyager-2/ISS Great Dark Spot and the HST/WFC3 NDS-2018, are well modelled by a darkening or possibly clearing of the deep aerosol layer only.

Keywords: Neptune; Uranus; aerosol structure.


Figures

Figure 1
Figure 1
Composite HST/STIS and IRTF/SpeX central‐meridian‐averaged I/F spectra of Uranus and Neptune compared with each other over the HST/STIS (0.3–1.0 μm) and IRTF/SpeX (0.8–2.5 μm) spectral ranges. Note that the HST/STIS data have been smoothed to the IRTF/SpeX resolution of 0.002 μm. Also overplotted, for reference, in the top panel are the red, green, blue sensitivities of the human eye (Stockman, ; Stockman & Sharpe, 2000).
Figure 2
Figure 2
Combined HST/STIS and IRTF/SpeX central‐meridian‐averaged I/F spectra of Uranus and Neptune compared with calculations from an aerosol‐free atmosphere including only Rayleigh/Raman scattering and gaseous absorption from methane and hydrogen‐helium collision‐induced absorption. The observations are plotted in black, while calculations using different sources of methane absorption from band data (Karkoschka & Tomasko, 2010) and line data sets HITRAN2016 (Gordon et al., 2017) and TheoRETS (Rey et al., 2018) are over‐plotted in red, purple and cyan, respectively. Also plotted in green in both panels are simple 1/λ 4 curves, showing the general trend of the combined spectra. N.B., the HITRAN2016 and TheoRETS do not cover the entire range and so at shorter wavelengths the calculations revert to Rayleigh/Raman scattering only.
Figure 3
Figure 3
Two‐way transmission from space, for a vertical path, to different levels in our standard Uranus and Neptune atmospheres for aerosol‐free conditions. These calculations include Rayleigh scattering, Raman scattering and absorption from gaseous methane and hydrogen‐helium collision‐induced absorption.
Figure 4
Figure 4
Example “bracketed” retrieval fit to reconstructed HST/STIS spectra of Uranus from 0.5 to 1.0 μm at 0° and 61.45°, using two continuous a priori distributions of aerosols of radius 0.1 μm and variable n imag spectra. The left‐hand panel compares the modelled spectra (red for 0° and green for 61.45°) to the observations (grey) (N.B. The modelled fits for the two a priori cases are indistinguishable at this scale). The middle panel shows the retrieved aerosol profiles (in terms of opacity/bar at the reference wavelength of 0.8 μm) for the two widely separated a priori profiles, indicating two aerosol layers at depth. Here, the solid lines (red or cyan) show the retrieved profiles, while the dotted lines show the a priori profiles; the a priori and retrieved errors are indicated by the shaded regions and dashed lines. It can be seen that the retrievals tend back to a priori above and below the region of maximum sensitivity between 1 and ∼5 bar, and thus that although we can detect a second aerosol layer at p > ∼4 bar, we cannot detect whether if it has a base in the 5–10‐bar range. The right‐hand panel shows the two fitted n imag spectra, with the dotted line indicating the a priori value for both cases.
Figure 5
Figure 5
Contour plot of vertical aerosol structure (opacity/bar) inferred from “snippet” Uranus retrievals, where for each wavelength the aerosol structure is retrieved from the wavelengths in a bin of width 0.1 μm centred on that wavelength. The contour levels are indicated in the bar on the right. From 0.3 to 0.8 μm the aerosol structure is infered from the HST/STIS nadir spectrum, while from 0.85 to 2.5 μm the IRTF/SpeX line‐averaged spectrum is used. Overplotted are white lines showing the two‐way nadir transmission to space of 0.2 and 0.8 for an aerosol‐free atmosphere, either excluding (solid lines) or including (dashed lines) Rayleigh‐Raman scattering. The retrieved aerosol opacity/bar shown is that derived with the full Rayleigh‐Raman scattering taken into account. The red line in the opacity/bar key is the assumed a priori value.
Figure 6
Figure 6
Example of one of the best fitted spectra for Uranus, with χ 2/n = 3.76 for our assumed errors. Here, the measured spectra and assumed error range are shown in grey and the fits at 0° and 61.45° are shown in red and blue, respectively, for the HST/STIS and Gemini/NIFS observations. For the IRTF/SpeX observation, the simulated central‐meridian line average is shown in red. It can be seen that we achieve a very good fit to the data for all three data sets.
Figure 7
Figure 7
Fitted vertical aerosol structure for Uranus's atmosphere from our example best‐fit retrieval, presented in terms of opacity/bar (left) and opacity/km (right) at 0.8 μm. The deep aerosol layer (Aerosol‐1) is shown as a solid line, the middle aerosol layer (Aerosol‐2) as a dotted line, and the extended tropospheric/stratospheric haze (Aerosol‐3) as a dashed line. The red line marks the 5‐bar level, which is roughly the level where our sensitivity runs out.
Figure 8
Figure 8
“Corner” plot of 30 retrievals of the combined HST/STIS, IRTF/SpeX and Gemini/NIFS Uranus data set with χ 2/n < 10. Note that for the opacity of the Aerosol‐1 layer, τ 1, the opacity plotted is that integrated from space down to the 5‐bar pressure level. The data points are colour‐coded by the χ 2/n of the fit, with red fitting best and purple worst. Along the leading diagonal, instead of plotting the marginalised errors as would be usual for such plots, we plot χ 2/n as a function of fitted parameter, again colour‐coded with red points having the lowest χ 2/n and purple points the highest. Although some parameters are better constrained than others, it can be seen that there is little cross‐correlation between any of the fitted parameters.
Figure 9
Figure 9
Fitted n imag spectra for Uranus (top row) and Neptune (bottom row) for the lower cloud/haze at 10 bar (Aerosol‐1), the middle cloud/haze at 1–2 bar (Aerosol‐2) and the vertically extended upper tropospheric/lower stratospheric haze (Aerosol‐3). The filled contour plots show the linear addition of the best‐fitting imaginary index distributions. Over‐plotted on these distributions are the extracted mean n imag spectra, where red are the weighted averages of all best‐fitting retrieved spectra, green are the contour‐map‐weighted averages, and cyan are the retrieved spectra from the representative retrieval case shown for each planet. These spectra are listed in Tables 3 and 4. N.B., the a priori value of n imag was set to 0.001 and this is the value the retrievals tend back to when the data are no longer constraining. The IRTF/SpeX data for Uranus were truncated at 1.9 μm as it can be seen from Figure 1 that the observations are too noisy to use at longer wavelengths.
Figure 10
Figure 10
Example “bracketed” fits to the longwave part of the IRTF/SpeX spectrum of Neptune using two different continuous a priori distributions of aerosol particles of radius 0.1 μm and and fixed n imag  = 0.1. The left panel compares the modelled spectra (red and cyan‐dashed for two different priors) to that observed (grey), while the right panel shows the retrieved aerosol profiles for the two different a priori, indicated in red and cyan respectively, showing that the spectrum is best fit in both cases with a layer that has peak opacity just below the tropopause near 0.2 bar. Note that in the right‐hand panel the a priori and retrieved error ranges are shaded in grey and edged by dashed coloured lines.
Figure 11
Figure 11
As Figure 5, but for Neptune, showing a contour plot of vertical aerosol structure (opacity/bar) inferred from our “snippet” Neptune retrievals, where for each wavelength the aerosol structure is retrieved from the wavelengths in a bin of width 0.1 μm centred on that wavelength. The red line in the opacity/bar key is again the assumed a priori value.
Figure 12
Figure 12
Example of one of the best fitted spectra for Neptune, with χ 2/n = 2.79 for our assumed errors. Here, the measured spectra and assumed error range are shown in grey and the fits at 0° and 61.45° are shown in red and blue, respectively, for both the HST/STIS and Gemini/NIFS observations. For the IRTF/SpeX observation, the simulated central‐meridian line average is shown in red. It can be seen that we achieve a very good fit to the data for all three data sets.
Figure 13
Figure 13
Fitted vertical aerosol structure for Neptune's atmosphere from our example best‐fit retrieval, presented in terms of opacity/bar (left) and opacity/km (right) at 0.8 μm. The deep Aerosol‐1 layer is shown as a solid line, the middle Aerosol‐2 layer as a dotted line, the tropospheric/stratospheric extended haze (Aerosol‐3) as a dashed line, and the detached methane ice haze near the tropopause as the dashed‐dotted line. The red line marks the 5‐bar level, which is roughly the level where our sensitivity runs out.
Figure 14
Figure 14
“Corner” plot of 30 retrievals of the combined HST/STIS, IRTF/SpeX and Gemini/NIFS Neptune data set with χ 2/n < 10. The data points are colour‐coded by the χ 2/n of the fit. Along the leading diagonal, instead of plotting the marginalised errors as would be usual for such plots, we plot χ 2/n as a function of fitted parameter. Although some parameters are better constrained than others, it can be seen that there is little cross‐correlation between any of the fitted parameters.
Figure 15
Figure 15
HST/STIS central‐meridian‐averaged I/F spectra of Uranus (top panel) and Neptune (bottom panel). Overplotted in the top panel for Uranus are the red, green, blue sensitivities of the human eye (Stockman, ; Stockman & Sharpe, 2000), together with the HST/WFC3 filters: F467M, F547M, FQ619N, F658N, FQ727N, F845M, and FQ924N (Dressel, 2021). Overplotted in the bottom panel for Neptune are the HST/WFC3 filters: F467M, F547M, FQ619N, F657N, FQ727N, F763N and F845M, together with the “clear”, “UV”, “violet”, “blue”, “green” and “orange” Voyager‐2/ISS NAC sensitivities (Smith et al., 1977), and the “CH4‐U” (i.e., 547 nm), “CH4‐JS” (i.e., 619 nm) and “orange” Voyager‐2/ISS WAC sensitivities (dashed lines).
Figure 16
Figure 16
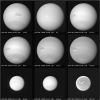
Observed and reconstructed HST/WFC3 images of Uranus. Top row shows HST/WFC3 observations made in 2014 during the OPAL program, centred at the wavelengths: 467, 547, 619, 658, 727, 845, and 924 nm. Middle row shows images reconstructed from our fits to the HST/STIS data, which also includes a hole in the deep Aerosol‐1 layer (p > 5–7 bar) near the disc centre. Bottom row shows images reconstructed from our fits to the HST/STIS data, where the deep Aerosol‐1 layer is darkened near the disc centre by setting n imag  = 0.001 at all wavelengths. It can be seen that for the darkening case the modelled dark spot is visible at 467 and 547 nm, but not at longer wavelengths, whereas for the clearing simulation the modelled spot is visible at 467 and 547 nm, but also faintly at 658, 845 and 924 nm. In addition, the modelled spot is darker at 467 nm when the Aerosol‐1 layer is darkened rather than removed.
Figure 17
Figure 17
Observed and reconstructed HST/WFC3 images of Neptune. Top row shows HST/WFC3 observations made in 2018 during the OPAL program, centred at the wavelengths: 467, 547, 619, 657, 727, 763, and 845 nm. Middle row shows images reconstructed from our fits to the HST/STIS data, which also includes a hole in the deep Aerosol‐1 layer (p > 5–7 bar) near the central meridian at 15°N, and a clearing at 60°S. Bottom row shows images reconstructed from our fits to the HST/STIS data, where the Aerosol‐1 layer is darkened near the central meridian at 15°N and at all longitudes at 60°S by setting n imag  = 0.001 at all wavelengths. As for the Uranus case shown in Figure 16, we can see that a dark spot is visible at 467 and 547 nm and that again, while for the Aerosol‐1‐darkening case the spot is invisible at longer wavelengths, for the clearing case it is still just visible at 657, 763 and 845 nm. Also, as for Uranus, the darkening simulation results in a spot that is darker at 467 nm than in the clearing simulation, which is more consistent with observations.
Figure 18
Figure 18
Modelled colours of Uranus and Neptune. The right‐hand column shows the simulated “observed” appearance of Uranus and Neptune, reconstructed using the fitted Minnaert limb‐darkening coefficients extracted from the HST/STIS data and assuming the observing geometry of the 2014 Uranus HST/WFC3 observations (Figure 16) for both planets. The spectra across the discs were convolved with the Commission Internationale de l’Éclairage (CIE)‐standard red, green, and blue human cone spectral sensitivities (Stockman, ; Stockman & Sharpe, 2000) to yield these apparent colours: it can be seen that Uranus is predicted to have a paler, more greenish colour than Neptune. The preceding columns show how our modelled appearance of these planets changes as we add different components to our radiative transfer model. Column 1 shows the modelled appearance of both planets if we remove all the haze and neglect methane absorption: in this case both planets would appear pearly white since even though Rayleigh‐scattering is more effective at blue wavelengths, we will eventually reach depths at even red wavelengths where Rayleigh scattering becomes effective. The effect of adding in absorption from the best‐case retrieved methane profile for both planets is shown in Column 2, and underlines the fact that it is the presence of atmospheric methane that leads to the underlying blue colour of these planets. However, the difference in observed colour between Uranus and Neptune cannot be explained by just by the fact that we retrieve more methane in Neptune's atmosphere than Uranus's. Column 3 shows the effect of adding in the retrieved profiles for Aerosol‐1, while Column 4 shows the effect of further adding Aerosol‐3, which can be seen to have little effect. In Column 5 we also add in Aerosol‐4. This is set to zero opacity for the Uranus retrievals and so there is no change, while the retrieved opacity for Neptune is very small, which when combined with the forward‐scattering nature of the large (2–3 μm‐sized) particles leads to negligible difference for Neptune also. Finally, in Column 6 we add in the opacity of Aerosol‐2 to all the other components, which can be seen to lead to the greatest difference between the predicted colours of Uranus and Neptune, and also leads to final colours that are indistinguishable from those reconstructed from the initial HST/STIS limb‐darkening coefficients in Column 7 (“Reconstructed HST/STIS Appearance”). (N.B., the overall brightness in each column as been separately scaled to make each column uniformly bright.)
Figure 19
Figure 19
Representative Voyager‐2 ISS images of Neptune, observed in August 1989 in the Clear, UV, Violet, Blue, Green and Orange filters, respectively of the Narrow Angle Camera (NAC) and also CH4‐U (541 nm), Orange and CH4‐JS (619 nm) from the Wide Angle Camera (WAC). For the NAC images, the Great Dark Spot (GDS) and Dark Spot 2 (DS2) are clearly visible, except in the UV channel. Also visible (except again in the UV) is the generally darker belt at 45–55°S. The WAC images are of poorer quality, but cover complementary wavelengths and the GDS and dark belt are still visible in the CH4‐U and orange filters. For the CH4‐JS filter, centred at 619 nm, the dark belt is less clear, and the white clouds around the GDS are relatively much brighter indicating that these are at a higher altitude than the main 1–2‐bar Aerosol‐2 layer.
Figure 20
Figure 20
Results of Minnaert analysis of the Voyager‐2 ISS NAC observations of Neptune. In each panel (filter), we have first plotted on a log‐log plot the observed reflectances multiplied by μ (the cosine of zenith angle) against μμ 0 for the 15–25°S and 45–55°S bands, together with the fitted Minnaert lines and derived (I/F)0 and k values, showing the clear linear dependence expected from the Minnaert model, and less pronounced limb‐darkening at 45–55°S (smaller values of k) compared with 15–25°S. Note the 45–55°S reflectivities have been scaled by a factor of 0.8 for clarity. Also plotted are the observed limb‐darkening dependencies of pixels within the GDS (and associated Minnaert fits), which have a smaller limb‐darkening coefficient than the background at 20°S, but less so than at 45–55°S. Finally, on each plot is shown the simulated limb‐darkening behaviour of our best‐fitting Neptune NEMESIS model (coloured lines, multiplied by 1.2 for clarity) including the deep >5–7‐bar Aerosol‐1 layer (“Nem”), removing the Aerosol‐1 layer (“Mod1”), or darkening it (“Mod2”), which show similar differences indicating that dark regions are well fitted by our model with lower >5–7‐bar aerosol layer reflectivity. The parallel grey lines on this plot are for reference and mark simulated k = 0.5 lines, for which the disc has no limb‐darkening or limb‐brightening.
Figure 21
Figure 21
Ice Giant stability plots, with Uranus on top row and Neptune on bottom. We have assumed He/H2 = 1.06 ×  solar and CH4/H2 = 64 ×  solar for both planets (assuming protosolar composition of (Asplund et al., 2009)), leading to a “deep” (i.e., at 10 bar) CH4 mole fraction of 4%. For Uranus we have assumed H2S/H2 = 37 ×  solar and NH3/H2 = 1.4 ×  solar (Molter et al., 2021), and for Neptune we have assumed H2S/H2 = 54 ×  solar and NH3/H2 = 3.9 ×  solar (Tollefson et al., 2021), leading to mole fractions for H2S at 20–40 bar of 6.4 × 10−4 and 7.2 × 10−4, respectively. For each planet/row there are five plots: (a) temperature profiles ‐ red line assumes a dry adiabatic lapse rate (DALR) at depth, while the black line assumes a saturated adiabatic lapse rate (SALR) and so includes latent heat released by condensation; (b) composition profiles showing the assumed methane and H2S mole fraction profiles; (c) profiles of the mean molecular weight (black) and the molar heat capacity at constant pressure (red), C p ; (d) stability of atmosphere, represented in terms of the Brünt‐Väisälä frequency, calculated from the temperature profile alone (red) and then also including the molecular weight gradient (black); and (e) Eddy‐diffusion coefficient estimates calculated, including (black) or excluding (red) molecular weight changes, from the model of Ackerman and Marley (2001), and compared with upper tropospheric determinations of K zz by Fouchet et al. (2003) (green). In the Brünt‐Väisälä frequency panels, the green line indicates the neutral static stability line.
Figure 22
Figure 22
Possible explanations for vertical structure of dark spots in Uranus and Neptune's atmospheres, compared with vortex model for Jupiter's atmosphere. Cloud structure may be affected differently, depending on whether cloud layers intersect with the high‐density (cool) or low‐density (warm) anomalies associated with anticyclonic vortices. Left hand panel shows a model of vortices in Jupiter's atmosphere, where the upper cooler part of the vortex intersects with the NH3 condensation layer, leading to enhanced ice formation there, and enhanced haze formation above it (extending close to the tropopause). In contrast, the right hand panel shows a similar model for Neptune's atmosphere, where the lower warm region overlaps with the H2S condensation level, causing a darkening, or clearing, of the Aerosol‐1 layer. To explain the lack of any changes in the Aerosol‐2 layer at the location of dark spots, the high‐density (cool) anomaly may need to reside deeper than the Aerosol‐2 layer. However, a deep vortex top is challenging to reconcile with observations of orographic companion clouds near dark spots. Alternatively, the mid‐plane may need to coincide with the Aerosol‐2 layer.
Figure 23
Figure 23
Summary of retrieved aerosol distributions for Uranus (left) and Neptune (right), compared with the assumed temperature/pressure profiles. On each plot is also shown the condensation lines for CH4 (green) and H2S (pink), assuming mole fractions at 10 bar of 4% for CH4 and 1 × 10−3 for H2S, to move the condensation levels to the approximate levels of the Aerosol‐1 and Aerosol‐2 layers. The default solution is composed of: (a) an extended layer of haze, photochemically produced in the stratosphere and mixed by eddy diffusion to lower levels (Aerosol‐3); (b) a thicker haze layer of larger particles (r ∼ 1 μm) near the CH4 condensation level (Aerosol‐2); (c) rapid formation of large methane ice/snow particles at the base of this layer, which rapidly fall and redeposit the haze cores at lower altitudes; and (d) an H2S cloud based at p > 5–7 bar, which forms on the haze particles (Aerosol‐1). For Neptune, we find we also need a component of moderate‐sized (∼2 μm) methane ice particles near the tropopause. Note that the Aerosol‐2 layer on Neptune has noticeably less opacity than that on Uranus, by a factor of ∼2.

References

    1. Ackerman, A. S. , & Marley, M. S. (2001). Precipitating condensation clouds in substellar atmospheres. Acta Pathologica Japonica, 556(2), 872–884. 10.1086/321540 - DOI
    1. Asplund, M. , Grevesse, N. , Sauval, A. J. , & Scott, P. (2009). The chemical composition of the Sun. Annual review of astronomy and astrophysics, 47(1), 481–522. 10.1146/annurev.astro.46.060407.145222 - DOI
    1. Banfield, D. , Gierasch, P. J. , Bell, M. , Ustinov, E. , Ingersoll, A. P. , Vasavada, A. R. , et al. (1998). Jupiter’s cloud structure from Galileo imaging data. Icarus, 135(1), 230–250. 10.1006/icar.1998.5985 - DOI
    1. Barceló‐Llull, B. , Sangrà, P. , Pallàs‐Sanz, E. , Barton, E. D. , Estrada‐Allis, S. N. , Martínez‐Marrero, A. , et al. (2017). Anatomy of a subtropical intrathermocline eddy. Deep‐Sea Research Part I: Oceanographic Research, 124, 126–139. 10.1016/j.dsr.2017.03.012 - DOI
    1. Bolton, S. , Levin, S. , Guillot, T. , Li, C. , Kaspi, Y. , Orton, G. , et al. (2021). Microwave observations reveal the deep extent and structure of Jupiter’s atmospheric vortices. Science, 374(6570), 968–972. 10.1126/science.abf1015 - DOI - PubMed

LinkOut - more resources