. 2021 Jun;126(6):e2020JB021390.
doi: 10.1029/2020JB021390. Epub 2021 Jun 22.

Evolution of the Crustal and Upper Mantle Seismic Structure From 0-27 Ma in the Equatorial Atlantic Ocean at 2° 43'S

Affiliations

Evolution of the Crustal and Upper Mantle Seismic Structure From 0-27 Ma in the Equatorial Atlantic Ocean at 2° 43'S

Venkata A Vaddineni et al. J Geophys Res Solid Earth. 2021 Jun.

Abstract

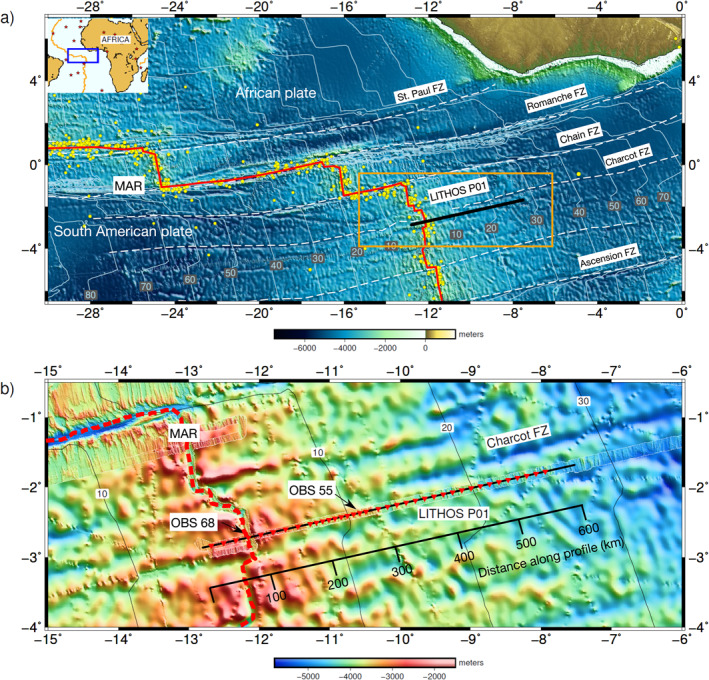
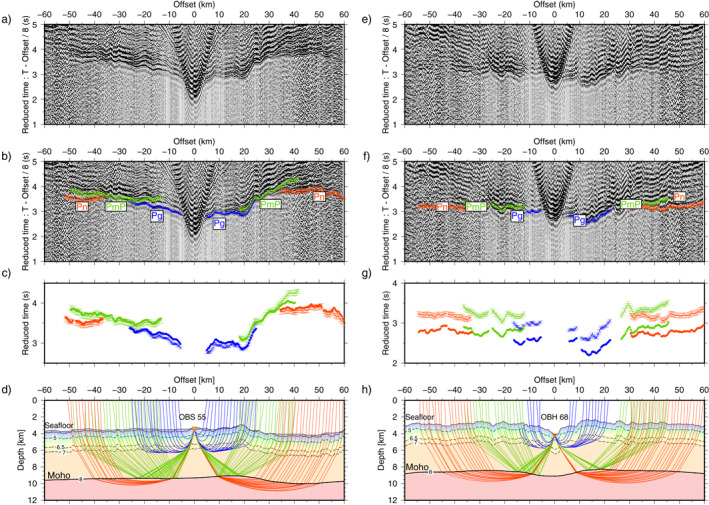
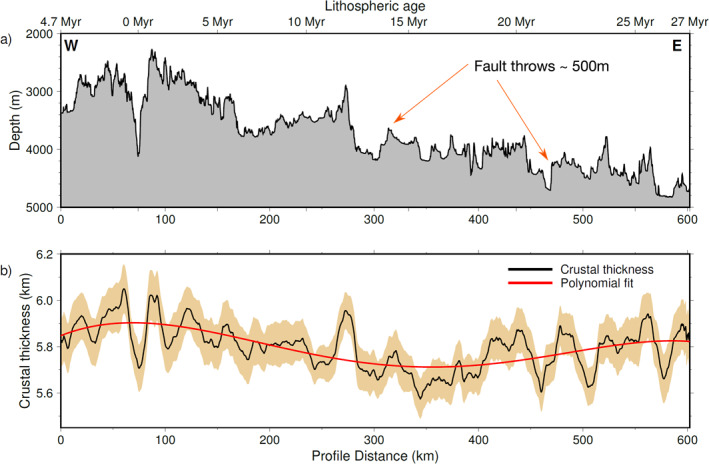
We present seismic tomographic results from a unique seismic refraction and wide-angle survey along a 600 km long flow-line corridor of oceanic lithosphere ranging in age from 0 to 27 Ma in the equatorial Atlantic Ocean at 2° 43'S. The velocities in the crust near the ridge axis rapidly increase in the first 6 Myr and then change gradually with age. The upper crust (Layer 2) thickness varies between 2 and 2.4 km with an average thickness of 2.2 km and the crustal thickness varies from 5.6 to 6 km along the profile with an average crustal thickness of 5.8 km. At some locations, we observe negative velocity anomalies (∼-0.3 km/s) in the lower crust which could be either due to chemical heterogeneity in gabbroic rocks and/or the effects of fault related deformation zones leading to an increase in porosities up to 1.6% depending on the pore/crack geometry. The existence of a low velocity anomaly beneath the ridge axis suggests the presence of partial melt (∼1.3%) in the lower crust. Upper mantle velocities also remain low (∼7.8 km/s) from ridge axis up to 5 Ma, indicating a high temperature regime associated with mantle melting zone underneath. These results suggest that the evolution of the crust and uppermost mantle at this location occur in the first 10 Ma of its formation and then remains unchanged. Most of the structures in the older crust and upper mantle are fossilized structures and could provide information about past processes at ocean spreading centers.

Keywords: evolution of lithosphere; mid‐ocean ridges; tomography.


Figures

Figure 1
Figure 1
(a) Global bathymetry of the study area (Tozer et al., 2019) and the location of the seismic experiment. The seismic profile LITHOS‐P01 is shown as thick black line. The Mid‐Atlantic Ridge (MAR) is shown as thick red line and fracture zones (FZ) as white dashed lines. The yellow dots represent earthquakes in the region mostly focused around the ridge axis and transform faults (U.S. Geological Survey, 2020). Red stars in the inset figure represent active hotspots in the region. Lithospheric age is contoured every 10 Myr. (b) Regional bathymetry of the area bounded by the orange rectangle in (a). Red triangles indicate the ocean bottom seismometers (OBSs) and hydrophones. Shooting line is marked in black. The MAR is marked by red dashed line. Data for OBSs 55 and 68 are shown in Figure 2. The distance along the profile is also given in black.
Figure 2
Figure 2
Seismic data and ray paths in the starting model. Un‐picked (a) and picked (b) seismic record for OBS 55 showing traveltimes for Pg (crustal turning rays) in blue, PmP (Moho reflections) in green and Pn (mantle turning rays) in red. The error bars represent the picking uncertainty. The data is reduced with a velocity of 8 km/s. A zero phase band pass filter between 3 and 20 Hz is applied to suppress noise. An offset dependent gain, data multiplied by distance, was applied to enhance the signals at far offsets. (c) Plot showing the picked versus synthetic traveltimes in the starting model shown in (d) with the corresponding ray paths in the starting P‐velocity model used in the tomography. The data is decimated by a factor of 3 for clarity. Figures (e), (f), (g) & (h) show data, traveltime picks and starting velocity model corresponding to ocean‐bottom‐hydrophones 68 located in the axial valley (see Figure 1 for the location of ocean bottom seismometers).
Figure 3
Figure 3
The final mean model after inversion of 50 random starting models. (a) The velocity model obtained after simultaneously inverting for Pg, PmP and Pn traveltimes. Inverted orange triangles mark the positions of the ocean bottom seismometers (OBSs). The axial valley and sub‐divisions of the profile for interpretation are marked. Thick contour lines represent velocities in the inverted model constrained by the ray paths and the dashed contour lines are for velocities out of the ray coverage region, shown here for reference. The numbers along the contours indicate velocities. The thick dashed line is the Layer 2/3 boundary inferred from the change in the velocity gradient with depth. Dashed vertical lines divide the profile in to three parts for interpretation based on the anomaly plot in (d). The Moho is highlighted by the thick black line. (b) Derivative weight sum in the final model. The numbers indicate OBS/OBH numbers. (c) Standard deviation of the velocity parameters from Monte‐Carlo analysis. (d) Velocity anomaly obtained after subtracting 1D average profile from the final velocity model.
Figure 4
Figure 4
(a) Contour map of average traveltime residual for PmP arrivals in the 20–45 km offset range as a function of the Moho depth and vertical velocity gradient in the lower crust. Two hundred models were computed in a Moho depth range of 5–7 km and the vertical velocity gradient from 0.00 to 0.24 s−1. The red star indicates the true model (Moho depth at 6 km, lower crustal velocity gradient of 0.112 s−1). The 0.02 s residual contour is an ellipse with major axis along the crustal thickness, implying that the residual is more sensitive to the gradient than the crustal thickness. (b) Depth kernel weighting tests: Crustal thickness along the profile obtained by varying the depth kernel parameters (velocity damping or depth damping) during the inversion starting from the same starting model (blue). The standard crustal thickness model is derived from Figure 3. See the text for discussion.
Figure 5
Figure 5
(a) Vertical gravity gradient (VGG): The axial valley and major tectonic features are clearly visible in the VGG plot (Sandwell et al., 2014). Mid‐ocean ridges segments are shown as red dashed lines. The white marker lines divide the profile in to LITHOS—1a, 1b, and 1c sub profiles. (b) High‐resolution bathymetry plot near the ridge‐axis showing the axial valley marked with yellow dashed line. The rectangular box shows the region where our profile intersects the axial valley. NTO: Non‐transform offset. (c) Cross sections of bathymetry along axis (top) and across axis (bottom). Dashed black lines indicate ridge‐ward dipping normal faults. The black vertical line marks the crossing of LITHOS‐P01 profile.
Figure 6
Figure 6
(a) 1‐D velocity profiles extracted from the final model (gray lines). The thick lines show the ensemble averages of 0–7 Ma (red), 7–18 Ma (green) and 18–27 Ma (blue) corresponding to LITHOS—1a, 1b, and 1c respectively. (b) First order (thick) and second order (dashed) velocity gradient for the ensemble averages. The depth at which gradient becomes less than 0.5 s−1 is considered the Layer 2/3 boundary at various ages. Yellow shaded region is the uncertainty range for Layer 2/3 boundary. (c) 1D velocity profiles at 60, 340, and 425 km along the profile.
Figure 7
Figure 7
(a) Velocity gradient plot for the standard model. The high gradient contour of 0.5 s−1 is marked by black thick dashed curve, defining the Layer 2/3 boundary, which approximately corresponds to the base of the crustal turning rays Pg. (b) Crustal thickness (green) and Layer 2 (red), Layer 3(blue) thicknesses. The Layer 2/3 thickness values at the ridge‐axis (∼75 km) are anomalous due to the low velocities and are not considered in the discussion. The dashed lines are polynomial fits. The edges of the model with less ray coverage are not shown. See the text for discussion.
Figure 8
Figure 8
(a) The velocity structure at the ridge‐axis showing a low velocity anomaly from the top of the crust to Moho extending up to 10 km on either side of the rift valley bounded by normal faults (Figure 5c). The upper mantle velocity below the ridge axis is ∼7.8 km/s. (b) Velocity anomaly in the crust obtained by subtracting a 1D model (average profile around 10 Ma) from the velocity model at the ridge axis. The vertical axis is the depth above the Moho. (c) The thermal structure obtained from the velocity anomaly using a reference temperature profile at 10 Ma obtained from Richards et al. (2018) and temperature‐velocity relationship from Christensen (1979).
Figure 9
Figure 9
(a) Upper crustal velocity variation along profile by taking an average within ±250 m depth window at 1 and 2 km below basement. The colored shaded regions depict the upper and lower bounds of the velocities in the chosen depth range. The dashed lines are polynomial fits. (b) Average lower crustal velocity structure at 1 km depth above the Moho. The four gray shaded regions highlight velocities associated with low velocity anomalies (LVAs). (c) Upper mantle velocity variation over 1 km depth range below the Moho. (d) Swath bathymetry showing the location of the LVAs along the profile, where we observe a decrease in velocity in the lower crust. Note that the low bathymetry seems to be associated with faulted regions.
Figure 10
Figure 10
(a) Bathymetry variation along profile. Fault throws of ∼500 m are evident along the profile. (b) Crustal thickness variation along profile shown in black and the polynomial fit (degree 4) is shown in red with the uncertainty bounds shown in the brown shaded region.
Figure 11
Figure 11
Comparison of velocity‐depth profiles from this study with those of other global studies (White et al., ; Grevemeyer et al.,  (<10 Ma) and Christeson et al., 2019). For ages (a) <7.5 Ma (b) >7.5 Ma.

References

    1. Alt, J. C. , Laverne, C. , Coggon, R. M. , Teagle, D. A. H. , Banerjee, N. R. , Morgan, S. , et al. (2010). Subsurface structure of a submarine hydrothermal system in ocean crust formed at the East Pacific Rise, ODP/IODP Site 1256. Geochemistry, Geophysics, Geosystems, 11(10), Q10010. 10.1029/2010GC003144 - DOI
    1. Anonymous (1972). Penrose field conference on ophiolites. Geotimes, 17(12), 24–25.
    1. Audhkhasi, P. , & Singh, S. C. (2019). Seismic structure of the upper crust from 0–75 Ma in the Equatorial Atlantic Ocean on the African Plate using ultralong offset seismic data. Geochemistry, Geophysics, Geosystems, 20(12), 6140–6162. 10.1029/2019GC008577 - DOI
    1. Bazin, S. , Harding, A. J. , Kent, G. M. , Orcutt, J. A. , Tong, C. H. , Pye, J. W. , et al. (2001). Three‐dimensional shallow crustal emplacement at the 9°03′N overlapping spreading center on the East Pacific Rise: Correlations between magnetization and tomographic images. Journal of Geophysical Research, 106(B8), 16101–16117. 10.1029/2001jb000371 - DOI
    1. Bell, R. E. , & Buck, W. R. (1992). Crustal control of ridge segmentation inferred from observations of the Reykjanes Ridge. Nature, 357(6379), 583–586. 10.1038/357583a0 - DOI

LinkOut - more resources