. 2022 Jul 5:14:893444.
doi: 10.3389/fnagi.2022.893444. eCollection 2022.

Reduced Insulin Signaling Targeted to Serotonergic Neurons but Not Other Neuronal Subtypes Extends Lifespan in Drosophila melanogaster

Affiliations

Reduced Insulin Signaling Targeted to Serotonergic Neurons but Not Other Neuronal Subtypes Extends Lifespan in Drosophila melanogaster

Nikolett Dravecz et al. Front Aging Neurosci. .

Erratum in

Abstract

Reduced Insulin/IGF-like signaling (IIS) plays an evolutionarily conserved role in improving longevity and some measures of health-span in model organisms. Recent studies, however, have found a disconnection between lifespan extension and behavioral health-span. We have previously shown that reduction of IIS in Drosophila neurons extends female lifespan but does not improve negative geotaxis senescence and has a detrimental effect on exploratory walking senescence in both sexes. We hypothesize that individual neuronal subtypes respond differently to IIS changes, thus the behavioral outcomes of pan-neuronal IIS reduction are the balance of positive, negative and neutral functional effects. In order to further understand how reduced IIS in neurons independently modulates lifespan and locomotor behavioral senescence we expressed a dominant negative Insulin receptor transgene selectively in individual neuronal subtypes and measured the effects on lifespan and two measures of locomotor senescence, negative geotaxis and exploratory walking. IIS reduction in cholinergic, GABAergic, dopaminergic, glutamatergic, and octopaminergic neurons was found to have either no affect or a detrimental effect on lifespan and locomotor senescence. However, reduction of IIS selectively in serotonergic neurons resulted in extension of lifespan in females with no effect on locomotor senescence. These data indicate that individual neuronal subtypes respond differently to IIS changes in the modulation of lifespan and locomotor senescence, and identify a specific role for the insulin receptor in serotonergic neurons in the modulation of lifespan.

Keywords: Drosophila; ageing; behavioral senescence; insulin/IGF-like signaling; serotonergic neurons.


Conflict of interest statement

The authors declare that the research was conducted in the absence of any commercial or financial relationships that could be construed as a potential conflict of interest. Since 17th January 2022, the co-author GV has been employed by Frontiers Media SA. GV declared his/her affiliation with Frontiers, and the handling Editor states that the process nevertheless met the standards of a fair and objective review.

Figures

FIGURE 1
FIGURE 1
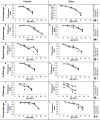
Survival of male and female flies with neuron specific (GAL4/UAS-InRDN) reductions in IIS. (A) Survival of TrhGAL/UAS-InRDN once mated female flies compared to TrhGAL/+ and UAS-InRDN/ + controls. Median lifespans and sample sizes were: TrhGAL/UAS-InRDN = 64 days, N = 125; TrhGAL/ + = 57 days, N = 112; and UAS-InRDN/+ = 61 days, N = 113. TrhGAL/UAS-InRDN females showed an increased survival compared to both controls by log rank tests (P < 0.0001). (B) Survival of TrhGAL/UAS-InRDN male flies compared to TrhGAL/ + and UAS-InRDN/ + controls. Median lifespans and sample sizes were: TrhGAL/UAS-InRDN = 51 days, N = 91; TrhGAL/ + = 54 days, N = 87; d UAS-InRDN/ + = 54 days, N = 87. (C) Survival of ThGAL/UAS-InRDN once mated female flies compared to ThGAL/ + and UAS-InRDN/ + controls. Median lifespans and sample sizes were: ThGAL/UAS-InRDN = 49 days, N = 150; ThGAL/ + = 73.5 days, N = 148; and UAS-InRDN/ + = 73.5 days, N = 144. ThGAL/UAS-InRDN females showed a decreased survival compared to both controls by log rank tests (P < 0.001). (D) Survival of ThGAL/UAS-InRDN male flies compared to ThGAL/ + and UAS-InRDN/ + controls. Median lifespans and sample sizes were: ThGAL/UAS-InRDN = 34 days, N = 149; ThGAL/ + = 73.1 days, N = 153; and UAS-InRDN/ + = 74.5 days, N = 153. ThGAL/UAS-InRDN males showed a decreased survival compared to both controls by log rank tests (P = ??). (E) Survival of VglutGAL/UAS-InRDN once mated female flies compared to VglutGAL/ + and UAS-InRDN/ + controls. Median lifespans and sample sizes were: VglutGAL/UAS-InRDN = 54 days, N = 100; VglutGAL/ + = 56.5 days, N = 100; and UAS-InRDN/ + = 61 days, N = 100. VglutGAL/UAS-InRDN females showed a decreased survival compared to both controls by log rank tests (P = 0.0008 to VglutGAL4/ + and P < 0.0001 to UAS-InRDN/ +). (F) Survival of VglutGAL/UAS-InRDN male flies compared to VglutGAL/ + and UAS-InRDN/ + controls. Median lifespans and sample sizes were: VglutGAL/UAS-InRDN = 45 days, N = 100; VglutGAL/ + = 61 days, N = 100; and UAS-InRDN/ + = 59 days, N = 100. VglutGAL/UAS-InRDN males showed a decreased survival compared to both controls by log rank tests (P < 0.0001). (G) Survival of Gad1GAL/UAS-InRDN once mated female flies compared to Gad1GAL/ + and UAS-InRDN/ + controls. Median lifespans and sample sizes were: Gad1GAL/UAS-InRDN = 56 days, N = 148; Gad1GAL/ + = 59 days, N = 149; and UAS-InRDN/ + = 54 days, N = 154. (H) Survival of Gad1GAL/UAS-InRDN male flies compared to Gad1GAL/ + and UAS-InRDN/ + controls. Median lifespans and sample sizes were: Gad1GAL/UAS-InRDN = 54 days, N = 148; Gad1GAL/ + = 54 days, N = 148; and UAS-InRDN/ + = 54 days, N = 161. (I) Survival of ChATGAL/UAS-InRDN once mated female flies compared to ChATGAL/ + and UAS-InRDN/ + controls. Median lifespans and sample sizes were: ChATGAL/UAS-InRDN = 41.5 days, N = 100; ChATGAL/ + = 41.5 days, N = 102; and UAS-InRDN/ + = 61 days, N = 99. ChATGAL/UAS-InRDN and ChATGAL/ + females showed a decreased survival compared to the UAS-InRDN/ + control females by log rank tests (P < 0.0001). (J) Survival of ChATGAL/UAS-InRDN male flies compared to ChATGAL/ + and UAS-InRDN/ + controls. Median lifespans and sample sizes were: ChATGAL/UAS-InRDN = 33.5 days, N = 100; ChATGAL/ + = 46 days, N = 100; and UAS-InRDN/ + = 55 days, N = 100. ChATGAL/UAS-InRDN males showed a decreased survival compared to both controls by log rank tests (P < 0.0001). (K) Survival of TdcGAL/UAS-InRDN once mated female flies compared to TdcGAL/ + and UAS-InRDN/ + controls. Median lifespans and sample sizes were: TdcGAL/UAS-InRDN = 60 days, N = 153; TdcGAL/ + = 60 days, N = 153; and UAS-InRDN/ + = 60 days, N = 125. (L) Survival of TdcGAL/UAS-InRDN male flies compared to TdcGAL/ + and UAS-InRDN/ + controls. Median lifespans and sample sizes were: TdcGAL/UAS-InRDN = 54 days, N = 71; TdcGAL/ + = 51 days, N = 84; and UAS-InRDN/ + = 51 days, N = 40.
FIGURE 2
FIGURE 2
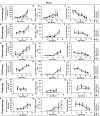
Effect of constitutive IIS reduction in specific neuronal subtypes on negative geotaxis senescence. (A) Negative geotaxis performance index over the lifespan of TrhGAL4/UAS-InRDN once mated female flies compared to TrhGAL4/ + and UAS-InRDN/ + controls, N = 3 (groups of 10 flies) for each genotype. (B) Negative geotaxis performance index over the lifespan of TrhGAL4/UAS-InRDN male flies compared to TrhGAL4/ + and UAS-InRDN/ + controls, N = 3 (groups of 10 flies) for each genotype. (C) Negative geotaxis performance index over the lifespan of ThGAL4/UAS-InRDN once mated female flies compared to ThGAL4/ + and UAS-InRDN/ + controls, N = 3 (groups of 10 flies) for each genotype. (D) Negative geotaxis performance index over the lifespan of ThGAL4/UAS-InRDN male flies compared to ThGAL4/ + and UAS-InRDN/ + controls, N = 3 (groups of 10 flies) for each genotype. (E) Negative geotaxis performance index over the lifespan of VglutGAL4/UAS-InRDN once mated female flies compared to VglutGAL4/ + and UAS-InRDN/ + controls, N = 3 (groups of 10 flies) for each genotype. (F) Negative geotaxis performance index over the lifespan of VglutGAL4/UAS-InRDN male flies compared to VglutGAL4/ + and UAS-InRDN/ + controls, N = 3 (groups of 10 flies) for each genotype. (G) Negative geotaxis performance index over the lifespan of GAD1GAL4/UAS-InRDN once mated female flies compared to GAD1GAL4/ + and UAS-InRDN/ + controls, N = 3 (groups of 10 flies) for each genotype. (H) Negative geotaxis performance index over the lifespan of GAD1GAL4/UAS-InRDN male flies compared to GAD1GAL4/ + and UAS-InRDN/ + controls, N = 3 (groups of 10 flies) for each genotype. (I) Negative geotaxis performance index over the lifespan of ChATGAL4/UAS-InRDN once mated female flies compared to ChATGAL4/ + and UAS-InRDN/ + controls, N = 3 (groups of 10 flies) for each genotype. At the age of 22 days ChATGAL4/UAS-InRDN showed decreased negative geotaxis response compared to the controls (P = 0.0001 to ChATGAL4/ + and P = 0.0003 to UAS-InRDN/ +) (J) Negative geotaxis performance index over the lifespan of ChATGAL4/UAS-InRDN male flies compared to ChATGAL4/ + and UAS-InRDN/ + controls, N = 3 (groups of 10 flies) for each genotype. At the age of 12, 32, and 39 days ChATGAL4/UAS-InRDN showed decreased negative geotaxis response compared to the controls (12 days: P = 0.0169 to ChATGAL4/ + and P = 0.0160 to UAS-InRDN/ +; 32 days: P = 0.0133 to ChATGAL4/ + and P = 0.0164 to UAS-InRDN/ +; 39 days: P = 0.0281 to ChATGAL4/ + and P = 0.0134 to UAS-InRDN/ +) (K) Negative geotaxis performance index over the lifespan of TdcGAL4/UAS-InRDN once mated female flies compared to TdcGAL4/ + and UAS-InRDN/ + controls, N = 3 (groups of 10 flies) for each genotype. (L) Negative geotaxis performance index over the lifespan of TdcGAL4/UAS-InRDN male flies compared to TdcGAL4/ + and UAS-InRDN/ + controls, N = 3 (groups of 10 flies) for each genotype.
FIGURE 3
FIGURE 3
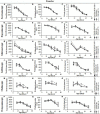
The effect of neuronal subtype specific IIS reduction on locomotion during exploratory walking senescence in female flies. Exploratory walking senescence parameters for a cohort of once-mated female flies of the indicated genotypes run in parallel with the survival experiments shown in Figure 1. Data are shown as mean value for each parameter ± SEM, N = 16 for the indicated genotype. Data were analyzed by two-way ANOVA (age and genotype) and age was found to be a significant effect (p < 0.05) for all genotypes. (A) Mean total distance walked vs. age of TrhGAL4/UAS-InRDN flies compared to TrhGAL4/ + and UAS-InRDN/ + controls. (B) Mean duration of walking vs. age of TrhGAL4/UAS-InRDN flies compared to TrhGAL4/ + and UAS-InRDN/ + controls. (C) Mean speed of walking vs. age of TrhGAL4/UAS-InRDN flies compared to TrhGAL4/ + and UAS-InRDN/ + controls. (D) Mean total distance walked vs. age of ThGAL4/UAS-InRDN flies compared to ThGAL4/ + and UAS-InRDN/ + controls. (E) Mean duration of walking vs. age of ThGAL4/UAS-InRDN flies compared to ThGAL4/ + and UAS-InRDN/ + controls. (F) Mean speed of walking vs. age of ThGAL4/UAS-InRDN flies compared to ThGAL4/ + and UAS-InRDN/ + controls. (G) Mean total distance walked vs. age of VglutGAL4/UAS-InRDN flies compared to VglutGAL4/ + and UAS-InRDN/ + controls. (H) Mean duration of walking vs. age of VglutGAL4/UAS-InRDN flies compared to VglutGAL4/ + and UAS-InRDN/ + controls. (I) Mean speed of walking vs. age of VglutGAL4/UAS-InRDN flies compared to VglutGAL4/ + and UAS-InRDN/ + controls. (J) Mean total distance walked vs. age of Gad1GAL4/UAS-InRDN flies compared to Gad1GAL4/ + and UAS-InRDN/ + controls. (K) Mean duration of walking vs. age of Gad1GAL4/UAS-InRDN flies compared to Gad1GAL4/ + and UAS-InRDN/ + controls. (L) Mean speed of walking vs. age of Gad1GAL4/UAS-InRDN flies compared to Gad1GAL4/ + and UAS-InRDN/ + controls. (M) Mean total distance walked vs. age of ChATGAL4/UAS-InRDN flies compared to ChATGAL4/ + and UAS-InRDN/ + controls. (N) Mean duration of walking vs. age of ChATGAL4/UAS-InRDN flies compared to ChATGAL4/ + and UAS-InRDN/ + controls. (O) Mean speed of walking vs. age of ChATGAL4/UAS-InRDN flies compared to ChATGAL4/ + and UAS-InRDN/ + controls. (P) Mean total distance walked vs. age of TdcGAL4/UAS-InRDN flies compared to TdcGAL4/ + and UAS-InRDN/ + controls. (Q) Mean duration of walking vs. age of TdcGAL4/UAS-InRDN flies compared to TdcGAL4/ + and UAS-InRDN/ + controls. (R) Mean speed of walking vs. age of TdcGAL4/UAS-InRDN flies compared to tdcGAL4/ + and UAS-InRDN/ + controls.
FIGURE 4
FIGURE 4
The effect of neuronal subtype specific IIS reduction on decision making during exploratory walking senescence in female flies. Exploratory walking senescence parameters for a cohort of female flies of the indicated genotypes run in parallel with the survival experiments shown in Figure 1. Data are shown as mean value for each parameter ± SEM, N = 16 for the indicated genotype. Data were analyzed by two-way ANOVA (age and genotype) and age was found to be a significant effect (p < 0.05) for all genotypes. (A) Mean duration flies spent in the central zone vs. age of TrhGAL4/UAS-InRDN flies compared to TrhGAL4/ + and UAS-InRDN/ + controls. (B) Mean latency to first rotation vs. age of TrhGAL4/UAS-InRDN flies compared to TrhGAL4/ + and UAS-InRDN/ + controls. (C) Mean rotation frequency vs. age of TrhGAL4/UAS-InRDN flies compared to TrhGAL4/ + and UAS-InRDN/ + controls. (D) Mean duration flies spent in the central zone vs. age of ThGAL4/UAS-InRDN flies compared to ThGAL4/ + and UAS-InRDN/ + controls. (E) Mean latency to first rotation vs. age of ThGAL4/UAS-InRDN flies compared to ThGAL4/ + and UAS-InRDN/ + controls. (F) Mean rotation frequency vs. age of ThGAL4/UAS-InRDN flies compared to ThGAL4/ + and UAS-InRDN/ + controls. (G) Mean duration flies spent in the central zone vs. age of VglutGAL4/UAS-InRDN flies compared to VglutGAL4/ + and UAS-InRDN/ + controls. (H) Mean latency to first rotation vs. age of VglutGAL4/UAS-InRDN flies compared to VglutGAL4/ + and UAS-InRDN/ + controls. (I) Mean rotation frequency vs. age of VglutGAL4/UAS-InRDN flies compared to VglutGAL4/ + and UAS-InRDN/ + controls. (J) Mean duration flies spent in the central zone vs. age of Gad1GAL4/UAS-InRDN flies compared to Gad1GAL4/ + and UAS-InRDN/ + controls. (K) Mean latency to first rotation vs. age of Gad1GAL4/UAS-InRDN flies compared to Gad1GAL4/ + and UAS-InRDN/ + controls. (L) Mean rotation frequency vs. age of Gad1GAL4/UAS-InRDN flies compared to Gad1GAL4/ + and UAS-InRDN/ + controls. (M) Mean duration flies spent in the central zone vs. age of ChATGAL4/UAS-InRDN flies compared to ChATGAL4/ + and UAS-InRDN/ + controls. (N) Mean latency to first rotation vs. age of ChATGAL4/UAS-InRDN flies compared to ChATGAL4/ + and UAS-InRDN/ + controls. (O) Mean rotation frequency vs. age of ChATGAL4/UAS-InRDN flies compared to ChATGAL4/ + and UAS-InRDN/ + controls. (P) Mean duration flies spent in the central zone vs. age of TdcGAL4/UAS-InRDN flies compared to TdcGAL4/ + and UAS-InRDN/ + controls. (Q) Mean latency to first rotation vs. age of TdcGAL4/UAS-InRDN flies compared to TdcGAL4/ + and UAS-InRDN/ + controls. (R) Mean rotation frequency vs. age of TdcGAL4/UAS-InRDN flies compared to TdcGAL4/ + and UAS-InRDN/ + controls.
FIGURE 5
FIGURE 5
The effect of neuronal subtype specific IIS reduction on locomotion during exploratory walking senescence in male flies. Exploratory walking senescence parameters for a cohort of male flies of the indicated genotypes run in parallel with the survival experiments shown in Figure 1. Data are shown as mean value for each parameter ± SEM, N = 16 for the indicated genotype. Data were analyzed by two-way ANOVA (age and genotype) and age was found to be a significant effect (p < 0.05) for all genotypes. (A) Mean total distance walked vs. age of TrhGAL4/UAS-InRDN flies compared to TrhGAL4/ + and UAS-InRDN/ + controls. (B) Mean duration of walking vs. age of TrhGAL4/UAS-InRDN flies compared to TrhGAL4/ + and UAS-InRDN/ + controls. (C) Mean speed of walking vs. age of TrhGAL4/UAS-InRDN flies compared to TrhGAL4/ + and UAS-InRDN/ + controls. (D) Mean total distance walked vs. age of ThGAL4/UAS-InRDN flies compared to ThGAL4/ + and UAS-InRDN/ + controls. (E) Mean duration of walking vs. age of ThGAL4/UAS-InRDN flies compared to ThGAL4/ + and UAS-InRDN/ + controls. (F) Mean speed of walking vs. age of ThGAL4/UAS-InRDN flies compared to ThGAL4/ + and UAS-InRDN/ + controls. (G) Mean total distance walked vs. age of VglutGAL4/UAS-InRDN flies compared to VglutGAL4/ + and UAS-InRDN/ + controls. (H) Mean duration of walking vs. age of VglutGAL4/UAS-InRDN flies compared to VglutGAL4/ + and UAS-InRDN/ + controls. (I) Mean speed of walking vs. age of VglutGAL4/UAS-InRDN flies compared to VglutGAL4/ + and UAS-InRDN/ + controls. (J) Mean total distance walked vs. age of Gad1GAL4/UAS-InRDN flies compared to Gad1GAL4/ + and UAS-InRDN/ + controls. (K) Mean duration of walking vs. age of Gad1GAL4/UAS-InRDN flies compared to Gad1GAL4/ + and UAS-InRDN/ + controls. (L) Mean speed of walking vs. age of Gad1GAL4/UAS-InRDN flies compared to Gad1GAL4/ + and UAS-InRDN/ + controls. (M) Mean total distance walked vs. age of ChATGAL4/UAS-InRDN flies compared to ChATGAL4/ + and UAS-InRDN/ + controls. At the age of 13 days ChATGAL4/UAS-InRDN showed decreased walking duration compared to the controls (P = 0.0011 to ChATGAL4/ + and P = 0.0001 to UAS-InRDN/ +). (N) Mean duration of walking vs. age of ChATGAL4/UAS-InRDN flies compared to ChATGAL4/ + and UAS-InRDN/ + controls. At the age of 13 days ChATGAL4/UAS-InRDN showed decreased walking duration compared to the controls (P = 0.0011 to ChATGAL4/ + and P = 0.0001 to UAS-InRDN/ +). (O) Mean speed of walking vs. age of ChATGAL4/UAS-InRDN flies compared to ChATGAL4/ + and UAS-InRDN/ + controls. At the age of 13 days ChATGAL4/UAS-InRDN showed decreased speed of walking compared to the controls (P = 0.0045 to ChATGAL4/ + and P < 0.0001 to UAS-InRDN/ +). (P) Mean total distance walked vs. age of TdcGAL4/UAS-InRDN flies compared to TdcGAL4/ + and UAS-InRDN/ + controls. (Q) Mean duration of walking vs. age of TdcGAL4/UAS-InRDN flies compared to TdcGAL4/ + and UAS-InRDN/ + controls. (R) Mean speed of walking vs. age of TdcGAL4/UAS-InRDN flies compared to tdcGAL4/ + and UAS-InRDN/ + controls.
FIGURE 6
FIGURE 6
The effect of neuronal subtype specific IIS reduction on decision making during exploratory walking senescence in male flies. Exploratory walking senescence parameters for a cohort of male flies of the indicated genotypes run in parallel with the survival experiments shown in Figure 1. Data are shown as mean value for each parameter ± SEM, N = 16 for the indicated genotype. Data were analyzed by two-way ANOVA (age and genotype) and age was found to be a significant effect (p < 0.05) for all genotypes. (A) Mean duration flies spent in the central zone vs. age of TrhGAL4/UAS-InRDN flies compared to TrhGAL4/ + and UAS-InRDN/ + controls. (B) Mean latency to first rotation vs. age of TrhGAL4/UAS-InRDN flies compared to TrhGAL4/ + and UAS-InRDN/ + controls. (C) Mean rotation frequency vs. age of TrhGAL4/UAS-InRDN flies compared to TrhGAL4/ + and UAS-InRDN/ + controls. (D) Mean duration flies spent in the central zone vs. age of ThGAL4/UAS-InRDN flies compared to ThGAL4/ + and UAS-InRDN/ + controls. (E) Mean latency to first rotation vs. age of ThGAL4/UAS-InRDN flies compared to ThGAL4/ + and UAS-InRDN/ + controls. (F) Mean rotation frequency vs. age of ThGAL4/UAS-InRDN flies compared to ThGAL4/ + and UAS-InRDN/ + controls. (G) Mean duration flies spent in the central zone vs. age of VglutGAL4/UAS-InRDN flies compared to VglutGAL4/ + and UAS-InRDN/ + controls. (H) Mean latency to first rotation vs. age of VglutGAL4/UAS-InRDN flies compared to VglutGAL4/ + and UAS-InRDN/ + controls. (I) Mean rotation frequency vs. age of VglutGAL4/UAS-InRDN flies compared to VglutGAL4/ + and UAS-InRDN/ + controls. (J) Mean duration flies spent in the central zone vs. age of Gad1GAL4/UAS-InRDN flies compared to Gad1GAL4/ + and UAS-InRDN/ + controls. (K) Mean latency to first rotation vs. age of Gad1GAL4/UAS-InRDN flies compared to Gad1GAL4/ + and UAS-InRDN/ + controls. (L) Mean rotation frequency vs. age of Gad1GAL4/UAS-InRDN flies compared to Gad1GAL4/ + and UAS-InRDN/ + controls. (M) Mean duration flies spent in the central zone vs. age of ChATGAL4/UAS-InRDN flies compared to ChATGAL4/ + and UAS-InRDN/ + controls. (N) Mean latency to first rotation vs. age of ChATGAL4/UAS-InRDN flies compared to ChATGAL4/ + and UAS-InRDN/ + controls. (O) Mean rotation frequency vs. age of ChATGAL4/UAS-InRDN flies compared to ChATGAL4/ + and UAS-InRDN/ + controls. At the age of 13 days ChATGAL4/UAS-InRDN showed decreased rotation frequency compared to the controls (P = 0.0193 to ChATGAL4/ + and P < 0.0001 to UAS-InRDN/ +). (P) Mean duration flies spent in the central zone vs. age of TdcGAL4/UAS-InRDN flies compared to TdcGAL4/ + and UAS-InRDN/ + controls. (Q) Mean latency to first rotation vs. age of TdcGAL4/UAS-InRDN flies compared to TdcGAL4/ + and UAS-InRDN/ + controls. (R) Mean rotation frequency vs. age of TdcGAL4/UAS-InRDN flies compared to TdcGAL4/ + and UAS-InRDN/ + controls.

Similar articles

Cited by

References

    1. Alekseyenko O. V., Chan Y. B., Okaty B. W., Chang Y., Dymecki S. M., Kravitz E. A. (2019). Serotonergic Modulation of Aggression in Drosophila Involves GABAergic and Cholinergic Opposing Pathways. Curr. Biol. 29 2145–2156 e5. 10.1016/j.cub.2019.05.070 - DOI - PMC - PubMed
    1. Andrews J. C., Fernandez M. P., Yu Q., Leary G. P., Leung A. K., Kavanaugh M. P. (2014). Octopamine neuromodulation regulates Gr32a-linked aggression and courtship pathways in Drosophila males. PLoS Genet. 10:e1004356. 10.1371/journal.pgen.1004356 - DOI - PMC - PubMed
    1. Atilano M. L., Gronke S., Niccoli T., Kempthorne L., Hahn O., Moron-Oset J., et al. (2021). Enhanced insulin signalling ameliorates C9orf72 hexanucleotide repeat expansion toxicity in Drosophila. eLife 10:e58565. 10.7554/eLife.58565 - DOI - PMC - PubMed
    1. Bass T. M., Grandison R. C., Wong R., Martinez P., Partridge L., Piper M. D. (2007). Optimization of dietary restriction protocols in Drosophila. J. Gerontol. A Biol. Sci. Med. Sci. 62 1071–1081. 10.1093/gerona/62.10.1071 - DOI - PMC - PubMed
    1. Bhandari P., Jones M. A., Martin I., Grotewiel M. S. (2007). Dietary restriction alters demographic but not behavioral aging in Drosophila. Aging Cell 6 631–637. - PubMed

LinkOut - more resources