

Sex-Specific Modulation of the Host Transcriptome in the Spleen of Schistosoma mansoni-Infected Mice
- PMID: 35865813
- PMCID: PMC9294737
- DOI: 10.3389/fcimb.2022.893632
Sex-Specific Modulation of the Host Transcriptome in the Spleen of Schistosoma mansoni-Infected Mice
Abstract
Background: Schistosomiasis is a severe parasitic disease that is primarily driven by the host's immune response to schistosome eggs trapped in tissue and by the granulomatous inflammatory and fibrotic reaction they cause. Despite significant progress in understanding the complex immunological processes involved in the relationship between schistosomes and their host, neither an effective vaccine against the infection nor anti-fibrotic drugs currently exists, making the search for new targets for schistosome drugs and vaccine candidates even more important. In order to identify new molecular targets for defense against or elimination of the parasite, we investigate herein the interplay between the host and male or female schistosomes, clearly separating this from the action of the parasite eggs.
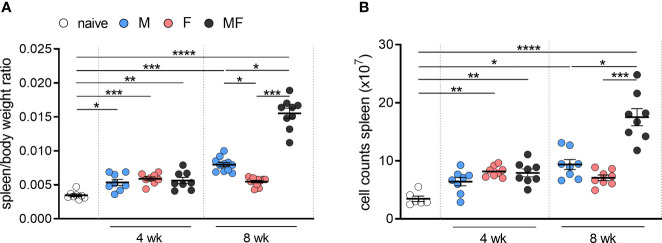
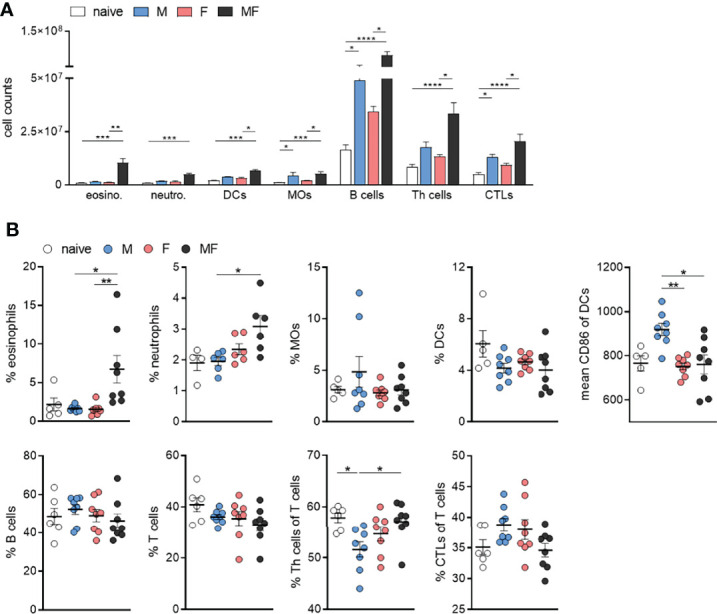
Methods: For this purpose, we infected 6-8-week-old female NMRI mice with 100 male (M), female (F), or both (MF) S. mansoni cercariae and performed a comparative transcriptomic and flow cytometric analysis of their spleens.
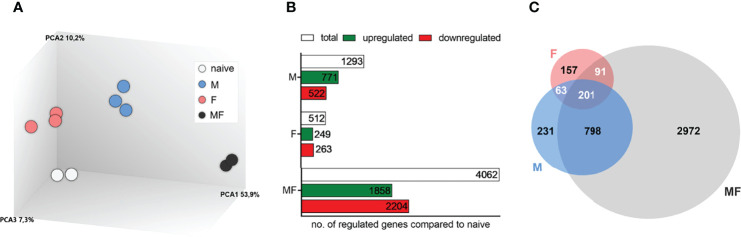
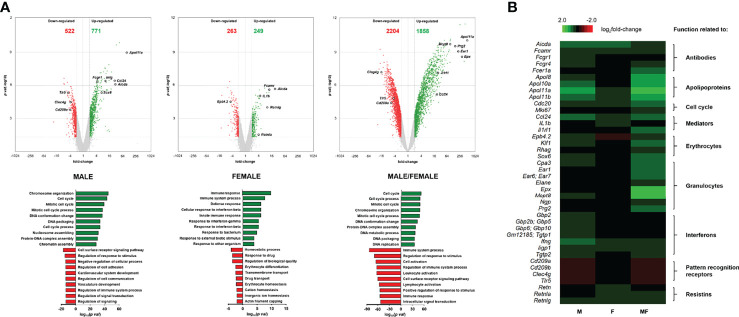
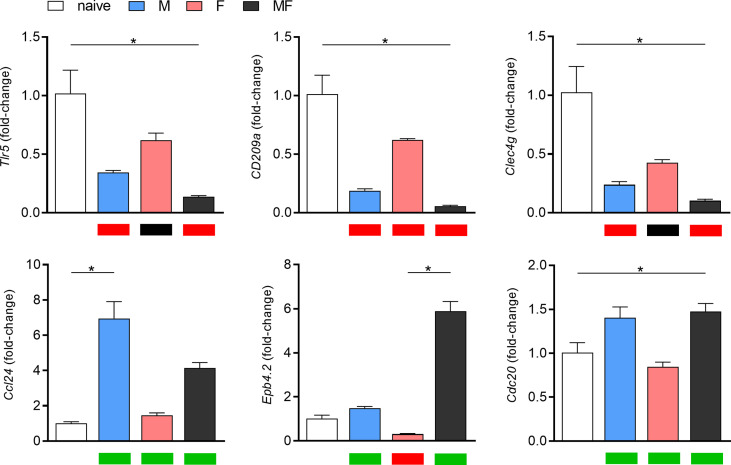
Results: Principal component analysis of a total of 22,207 transcripts showed a clear clustering of the experimental groups. We identified a total of 1,293 genes in group M, 512 genes in group F, and 4,062 genes in group MF that were differentially expressed compared to naive controls. The highest percentage of regulated genes (2,972; 65.9%) was found in group MF alone, but there was a large overlap between groups M and MF (798; 17.7%) and a small overlap between groups F and MF (91; 2.0%). Only 4.5% of genes (201) were revealed to be regulated in all experimental groups (M/F/MF). In addition, we were able to show that both worm sexes trigger immune responses in an egg-independent manner (non-polarized Th1 and Th2 response), with female worms exerting less regulatory influence than males.
Conclusion: Our data show that adult schistosomes trigger sex-specific, egg-independent immune responses. The lists of genes regulated by adult female or male worms presented here may be useful in deciphering host-parasite interactions to identify targets for schistosome elimination.
Keywords: Schistosoma mansoni; host–parasite interaction, immunomodulation; transcriptome analysis in spleens; unisexual infection.
Copyright © 2022 Winkelmann, Rabes, Reinholdt, Koslowski, Koczan, Reisinger and Sombetzki.
Conflict of interest statement
The authors declare that the research was conducted in the absence of any commercial or financial relationships that could be construed as a potential conflict of interest.
Figures

Similar articles
-
Unisexual infection with Schistosoma mansoni in mice has the potential to boost the immune response against eggs after challenge infection.Front Immunol. 2023 Feb 24;14:1125912. doi: 10.3389/fimmu.2023.1125912. eCollection 2023. Front Immunol. 2023. PMID: 36923416 Free PMC article.
-
Host Defense Versus Immunosuppression: Unisexual Infection With Male or Female Schistosoma mansoni Differentially Impacts the Immune Response Against Invading Cercariae.Front Immunol. 2018 Apr 24;9:861. doi: 10.3389/fimmu.2018.00861. eCollection 2018. Front Immunol. 2018. PMID: 29743881 Free PMC article.
-
Schistosoma mansoni Egg, Adult Male and Female Comparative Gene Expression Analysis and Identification of Novel Genes by RNA-Seq.PLoS Negl Trop Dis. 2015 Dec 31;9(12):e0004334. doi: 10.1371/journal.pntd.0004334. eCollection 2015 Dec. PLoS Negl Trop Dis. 2015. PMID: 26719891 Free PMC article.
-
Priming of the immune response by schistosome eggs.Parasite Immunol. 2005 Jul-Aug;27(7-8):265-70. doi: 10.1111/j.1365-3024.2005.00765.x. Parasite Immunol. 2005. PMID: 16138847 Review.
-
Epigenetic modulation, stress and plasticity in susceptibility of the snail host, Biomphalaria glabrata, to Schistosoma mansoni infection.Int J Parasitol. 2016 Jun;46(7):389-94. doi: 10.1016/j.ijpara.2016.03.003. Epub 2016 Apr 4. Int J Parasitol. 2016. PMID: 27056272 Review.
Cited by
-
Single-sex schistosomiasis: a mini review.Front Immunol. 2023 Apr 19;14:1158805. doi: 10.3389/fimmu.2023.1158805. eCollection 2023. Front Immunol. 2023. PMID: 37153566 Free PMC article. Review.
-
Individually or as a Team-The Immunological Milieu in the Lung Caused by Migrating Single-Sex or Mixed-Sex Larvae of Schistosoma mansoni.Pathogens. 2023 Dec 8;12(12):1432. doi: 10.3390/pathogens12121432. Pathogens. 2023. PMID: 38133315 Free PMC article.
-
Reassessing Schistosoma worms: the overlooked role in host pathology and disease elimination.Infect Dis Poverty. 2025 Mar 26;14(1):24. doi: 10.1186/s40249-025-01298-5. Infect Dis Poverty. 2025. PMID: 40140878 Free PMC article. Review.
References
Publication types
MeSH terms
LinkOut - more resources
Full Text Sources
Molecular Biology Databases