. 2022 Jul 5:12:916437.
doi: 10.3389/fcimb.2022.916437. eCollection 2022.

Longitudinal Changes in the Composition of the Penile Microbiome Are Associated With Circumcision Status, HIV and HSV-2 Status, Sexual Practices, and Female Partner Microbiome Composition

Affiliations

Longitudinal Changes in the Composition of the Penile Microbiome Are Associated With Circumcision Status, HIV and HSV-2 Status, Sexual Practices, and Female Partner Microbiome Composition

Supriya D Mehta et al. Front Cell Infect Microbiol. .

Abstract

Background: Penile microbiome composition has been associated with HSV-2 and HIV in men and with bacterial vaginosis (BV) and HSV-2 in female sex partners. This study sought to 1) characterize penile microbiome composition over a 1-year period and 2) identify factors associated with penile microbiome composition over time.

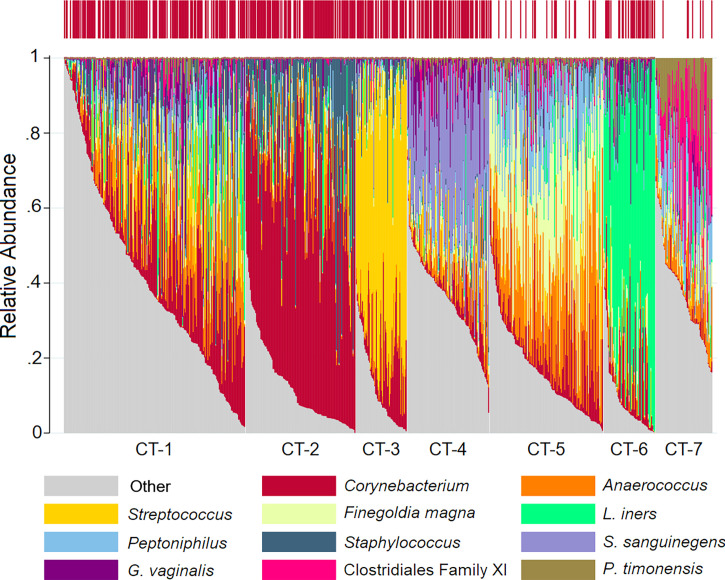
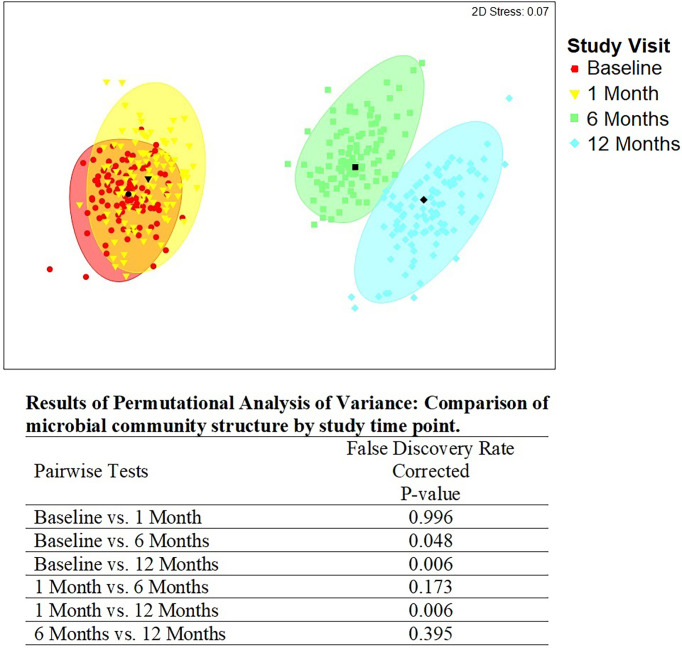
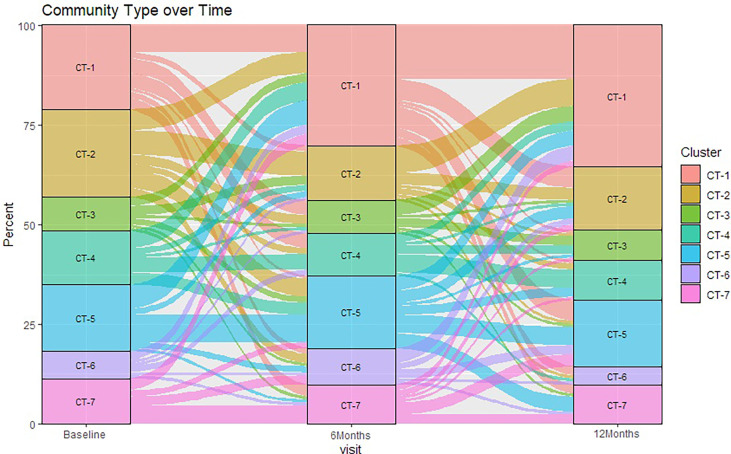
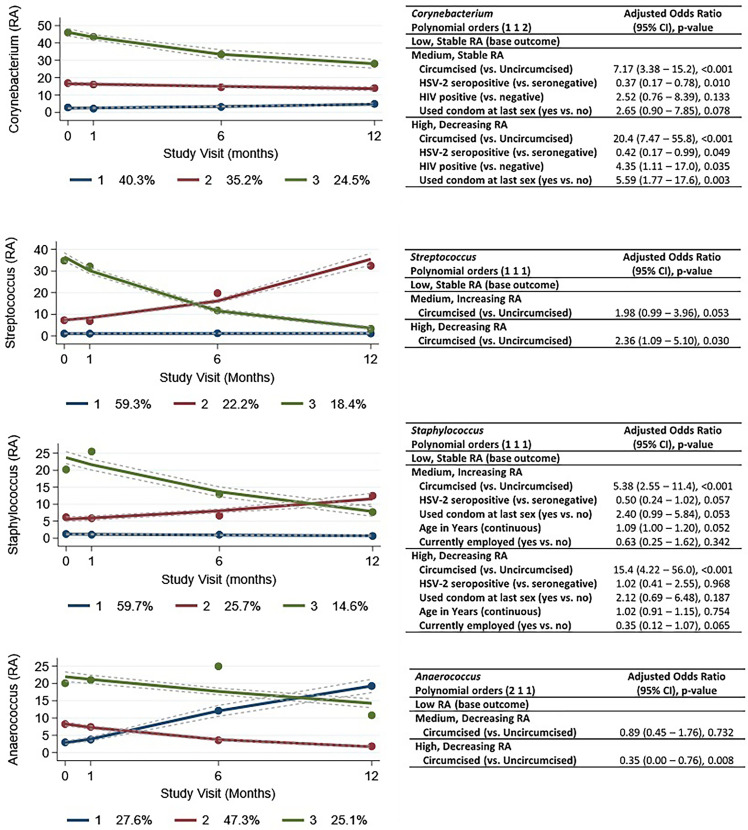
Methods: This prospective study of community-recruited heterosexual couples in Kenya measured penile and vaginal microbiomes via 16S ribosomal RNA gene amplicon sequencing at 4 time points over 1 year (1, 6, and 12 months after baseline). We used longitudinal mixed-effects modeling to assess associated demographic, behavioral, and disease factors and changes in community type, meatal taxa with the highest mean relative abundance, and alpha and beta diversity measures. We estimated group-based trajectories to elucidate compositional trends.

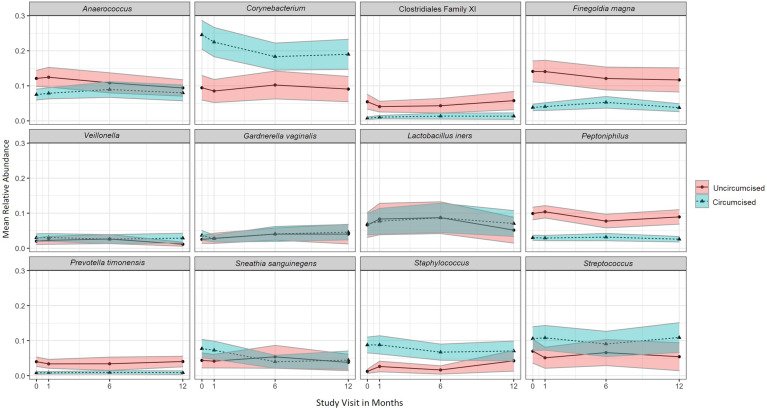
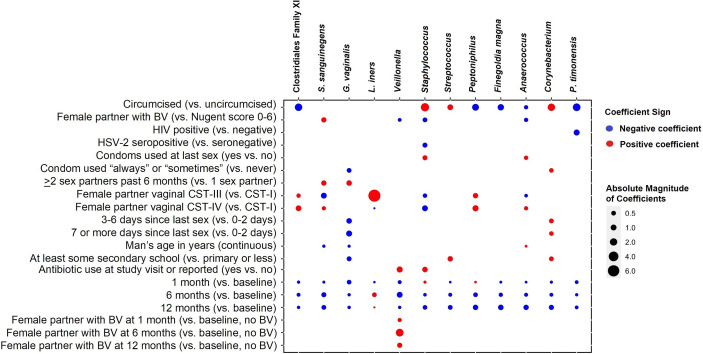
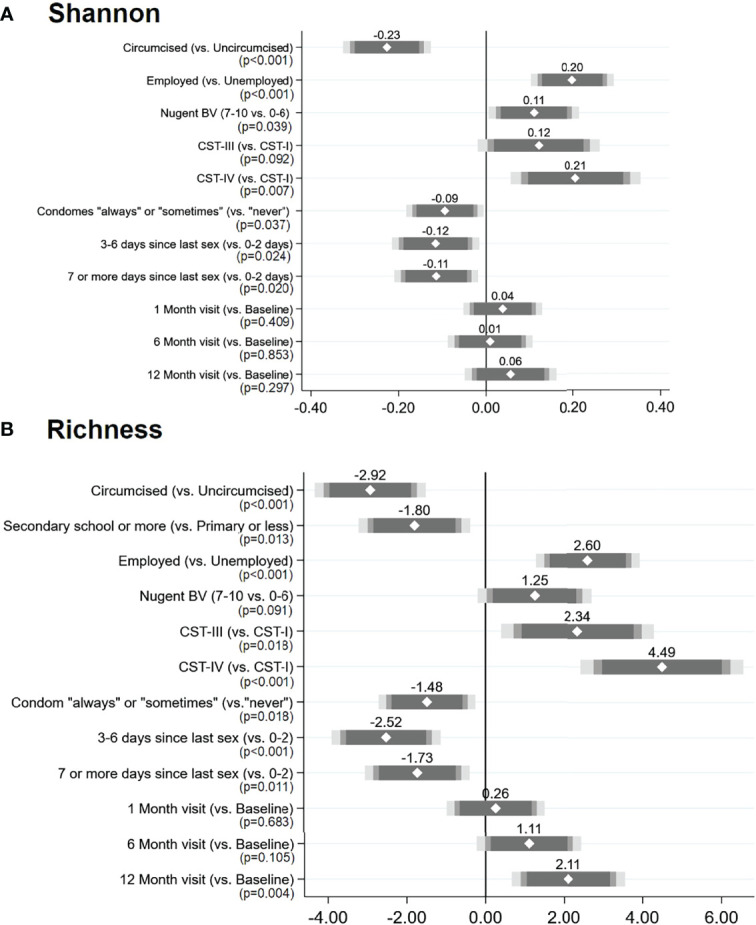
Results: Among 218 men with 740 observations, men had a median age of 26 years, 11.6% were living with HIV, and 46.1% were HSV-2 seropositive. We identified 7 penile community types that varied with circumcision status, female partner vaginal microbiome community state type (CST), condom use, and penile washing. Across varying analytic approaches, 50%-60% of men had stable penile microbiome compositions. Alpha diversity measures were lower for circumcised men and those who reported condom use; they were stable over time but higher if female partners had diverse CSTs or BV. BV was positively associated with the relative abundance of numerous individual penile taxa. The decreased Bray-Curtis similarity was more common for men with HSV-2, and HSV-2 was also associated with a lower relative abundance of Corynebacterium and Staphylococcus.

Conclusions: Over a 1-year period, penile microbiome composition was stable for a substantial proportion of men and was influenced by men's circumcision status, sexual practices, female partner's vaginal CST and BV status, and men's HSV-2 status. In the female genital tract, a diverse CST is often associated with poorer health outcomes. Our results contribute toward understanding whether this framework extends to the penile microbiome and whether diversity and the associated penile microbiome compositions influence susceptibility or resilience to poorer health outcomes in men. Focusing on understanding how these factors influence the penile microbiome may lead to therapeutic avenues for reduced HSV-2 and BV infections in men and their female sex partners.

Keywords: HIV; HSV - 2; bacterial vaginosis; penile microbiome; vaginal microbiome.


Conflict of interest statement

The authors declare that the research was conducted in the absence of any commercial or financial relationships that could be construed as a potential conflict of interest.

Figures

Figure 1
Figure 1
Stacked bar charts of the relative abundance of the penile taxa with greatest mean relative abundance for individuals by community type. Legend: observations from 740 samples are sorted by penile community type. The relative abundance of the taxa with the highest mean relative abundance is shown (0%–100%; y-axis), with individual subjects represented by individual bars, separated by community type (CT; x-axis). The bar at the top represents circumcision status, with circumcised individuals represented by red vertical lines.
Figure 2
Figure 2
Metric multidimensional scaling plot of penile meatal microbial community by study time point. Legend: the four different colors represent the four study time points: red = baseline; yellow = 1 month; green = 6 months; blue = 12 months. Each colored mark indicates one of 100 bootstraps of the dataset. The matching shaded area represents 95% coverage. The black symbol at the center of each colored shape represents the average centroid of the 100 bootstraps. The false discovery rate-corrected p-values of the pairwise comparisons by time point are shown below the figure.
Figure 3
Figure 3
Sankey diagram showing change in penile meatal community type (CT) over time. Legend: the percent of samples (y-axis) classified in seven penile meatal community types (CT) over time (x-axis) are represented by seven colored blocks, with key to the right.
Figure 4
Figure 4
Mean relative abundance over time for the twelve penile meatal taxa with highest mean relative abundance, by circumcision status. Legend: the mean relative abundance of the twelve penile meatal taxa with highest mean relative abundance (RA; y-axis) are shown over time (x-axis) with the 95% CI shown in the shaded areas around the mean line. Mean relative abundances over time are stratified by circumcision status, as represented by legend to the right of the graphs.
Figure 5
Figure 5
Coefficient heatmap showing results of multivariable-adjusted random-effects regression: factors associated with 12 taxa with highest mean relative abundance over time. Legend: the columns represent the 12 taxa with the highest mean relative abundance. The rows represent the covariates associated with taxa in multivariable models that are time-adjusted, with final models selected according to minimized Akaike’s information criterion. A red circle represents a positive association between covariate and taxon, and a blue circle represents a negative (inverse) association. The size of the dot is proportional to the absolute magnitude of the coefficient. White space indicates that the association between covariate and taxon did not improve explanation and is not included in the final model.
Figure 6
Figure 6
Group-based trajectories and results of multivariable multinomial modeling of factors associated with trajectory. Legend: the figures show the estimated group trajectories of relative abundances of the four taxa with highest relative abundance: (A) Corynebacterium, (B) Streptococcus, (C) Staphylococcus, and (D) Anaerococcus. The y-axis represents relative abundance (RA), and the x-axis represents time in months, with study visits indicated. Each trajectory is represented by a different color (blue, red, or green) with group membership shown in the legend below each figure. For example, for Corynebacterium, there is a stable trajectory with low relative abundance (dark blue), and 40.3% of observations are grouped in this trajectory. There is a stable, “medium” relative abundance (dark red), and 35.2% of observations are grouped in this trajectory. There is a (dark green) “high” relative abundance trajectory (with decline over time), and 24.5% of observations are grouped in this trajectory. The tables to the right of each figure (i–iv) show the results of multivariable multinomial modeling of baseline factors associated with group trajectories. For Corynebacterium, compared to men who are grouped in the stable, low RA group trajectory, men who are grouped in the stable, “medium” RA trajectory are more likely to be circumcised (adjusted odds ratio 7.17) and less likely to be HSV-2 seropositive (adjusted odds ratio = 0.37). Men who are grouped in the decreasing, “high” RA trajectory are more likely to be circumcised (adjusted odds ratio 20.4), less likely to be HSV-2 seropositive, more likely to be HIV positive, and more likely to report condom use at the last sexual encounter.
Figure 7
Figure 7
Results of multivariable adjusted mixed-effects linear regression: factors associated with penile meatal microbiome alpha diversity measures over time: (A) Shannon diversity index and (B) richness. Legend: the coefficient plots reflect the coefficient (white diamond) placed over the 95% CI (gray-shaded bars) for each factor (y-axis) in relation to the alpha diversity measures: (A) Shannon diversity index and (B) richness. p-Values are indicated under each variable. N = 654 observations among 221 individuals in both models.

Similar articles

Cited by

References

    1. Bates D., Mächler M., Bolker B., Walker S. (2015). Fitting Linear Mixed-Effects Models Using Lme4 . J. Stat. Software 67, 1–48. doi: 10.18637/jss.v067.i01 - DOI
    1. Brunson J. C., Read Q. D. (2020) “Ggalluvial: Alluvial Plots in 'Ggplot2'.” R Package Version 0.12.3. Available at: http://corybrunson.github.io/ggalluvial/.
    1. Davis N. M., Proctor D. M., Holmes S. P., Relman D. A., Callahan B. J. (2018). Simple Statistical Identification and Removal of Contaminant Sequences in Marker-Gene and Metagenomics Data. Microbiome 6, 226. doi: 10.1186/s40168-018-0605-2 - DOI - PMC - PubMed
    1. Desgraupes B. (2017) Clustering Indices (University Paris Ouest Lab Modal’X; ). Available at: https://cran.r-project.org/web/packages/clusterCrit/vignettes/clusterCri... (Accessed November 3, 2021).
    1. Eren A. M., Zozaya M., Taylor C. M., Dowd S. E., Martin D. H., Ferris M. J. (2011). Exploring the Diversity of Gardnerella Vaginalis in the Genitourinary Tract Microbiota of Monogamous Couples Through Subtle Nucleotide Variation. PloS One 6, e26732. doi: 10.1371/journal.pone.0026732 - DOI - PMC - PubMed

Publication types