. 2022 May 31;6(7):e10635.
doi: 10.1002/jbm4.10635. eCollection 2022 Jul.

Distinct Inflammatory Macrophage Populations Sequentially Infiltrate Bone-to-Tendon Interface Tissue After Anterior Cruciate Ligament (ACL) Reconstruction Surgery in Mice

Affiliations

Distinct Inflammatory Macrophage Populations Sequentially Infiltrate Bone-to-Tendon Interface Tissue After Anterior Cruciate Ligament (ACL) Reconstruction Surgery in Mice

Takayuki Fujii et al. JBMR Plus. .

Abstract

Macrophages are important for repair of injured tissues, but their role in healing after surgical repair of musculoskeletal tissues is not well understood. We used single-cell RNA sequencing (RNA-seq), flow cytometry, and transcriptomics to characterize functional phenotypes of macrophages in a mouse anterior cruciate ligament reconstruction (ACLR) model that involves bone injury followed by a healing phase of bone and fibrovascular interface tissue formation that results in bone-to-tendon attachment. We identified a novel "surgery-induced" highly inflammatory CD9+ IL1+ macrophage population that expresses neutrophil-related genes, peaks 1 day after surgery, and slowly resolves while transitioning to a more homeostatic phenotype. In contrast, CX3CR1+ CCR2+ macrophages accumulated more slowly and unexpectedly expressed an interferon signature, which can suppress bone formation. Deletion of Ccr2 resulted in an increased amount of bone in the surgical bone tunnel at the tendon interface, suggestive of improved healing. The "surgery-induced macrophages" identify a new cell type in the early phase of inflammation related to bone injury, which in other tissues is dominated by blood-derived neutrophils. The complex patterns of macrophage and inflammatory pathway activation after ACLR set the stage for developing therapeutic strategies to target specific cell populations and inflammatory pathways to improve surgical outcomes. © 2022 The Authors. JBMR Plus published by Wiley Periodicals LLC on behalf of American Society for Bone and Mineral Research.

Keywords: ANIMAL MODELS; INJURY/FRACTURE HEALING; ORTHOPAEDICS; OSTEOIMMUNOLOGY; SYSTEMS BIOLOGY ‐ BONE INTERACTORS.


Conflict of interest statement

The authors declare that there are no conflicts of interest regarding the publication of this paper.

Figures

Fig. 1
Fig. 1
Single‐cell transcriptome profiling of the interface tissue after ACLR surgery. Cells were isolated from the interface tissue on day 1, 3, 7, and 14 after ACLR surgery and cells from 10 to 15 mice were pooled for each time point. (A) Schematic showing the area of harvesting of the interface tissue; data reflect integration of all time points. (BF) Analysis of single cell RNAseq data using Seurat using cells isolated from the interface tissue on day 1, 3, 7, and14 after ACLR surgery. (B) UMAP projection of scRNAseq data. (C) Violin plots showing marker genes of different cell types. Markers used: Kit and Flt3, hemopoietic stem cells. Il3ra and Cd244, Progenitors. Lck and Cd3e, T cells. Cd79a and Cd19, B cells. Itgam, myeloid cells. Ly6g, neutrophils. (D) Unbiased cell identity classification by singleCellNet. (E) Expression of macrophage and neutrophil markers in clusters 0, 1, 2, 3 and 7. Macrophage markers: Cd68, Metrnl, Emilin2, and F10. Neutrophil markers: Csf3r, Clec5a, Cxcr2, and Sgms2. f, Single cell histogram of Ccr2, Cx3cr1, and Cd9 expression in clusters 0 and 3.
Fig. 2
Fig. 2
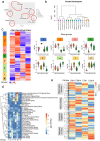
Subpopulations of macrophages that infiltrate interface tissue after ACLR surgery. (A) Heat map showing top genes enriched in each cluster obtained in Fig. 1. (B) GSEA of the marker genes of Cd9+ cells in cluster 0 and Cx3cr1+ Ccr2+ cells in cluster 3 as identified in A. (C) Single cell histogram of Il1b, Ccl3, Ifitm3, and Chil3 in clusters 0 and 3. GSEA = gene set enrichment analysis.
Fig. 3
Fig. 3
Identification of monocyte/macrophage subpopulations in the interface tissue after ACLR surgery. (A) UMAP projection of cluster 0 and 3 myeloid lineage cell populations on day 1, 3, 7, and 14 after ACLR surgery and from control tissue from non‐operated mice. (B) Expression pattern of Cd9, Cx3cr1, Il1b, and Ccr2. (C) UMAP showing clustering of macrophages in naïve bone (control) and in interface tissue at each time point (days 1, 3, 7 and 14 postsurgery). (D) Left panel: Changes in the percentages of m0–m4 clusters in the interface tissue. Right panel: Change in the percentages of cell types (m0 and m2 for CD9, and m1, m3 and m4 for CX3CR1). (E) Heat map of DEGs that serve as markers of clusters m0–m4. Top 200 genes are shown. (F) Pathway analysis of clusters m0–m3 using GSEA. (G) The number of cells in each subcluster of Cx3cr1+ Ccr2+ cells (R0–R4, as defined in Fig. S4) on POD 0, 1, 3, 7, and 14. (H) GSEA pathway analysis of clusters R0, R3, and R4.
Fig. 4
Fig. 4
Flow cytometric and morphological analysis of distinct CD9+ and CX3CR1+ macrophages in interface tissue. Cells were isolated from the interface tissue on day 7 after ACLR surgery. (A) Representative flow cytometric plot on POD 7 showing the gating strategy for cell sorting. Boxes enclose sorted cells. (B) Photomicrographs of cells stained with May‐Grunwald Giemsa staining. Upper left quadrant = neutrophils; upper right quadrant = F4/80− cells; lower left quadrant = F4/80+ CD9− CX3CR1+ cells; lower right quadrant = F4/80+ CD9+ cells. Representative of at least 2000 cells analyzed. Scale bar: 10 μm. (C) A representative flow cytometric plot showing SSC (measures cell granularity) and FSC (measures cell size). FSC = forward scatter; SSC = side scatter.
Fig. 5
Fig. 5
Bulk RNAseq reveals distinct transcriptomic features in subpopulations of myeloid lineage cells from the interface tissue. Cells from the interface tissue on day 1 and 14 after ACLR surgery were sorted (see Materials and Methods; n = 2, five to seven mice pooled for each sample). (A) PCA plot showing segregation of F4/80− cells, CD9+ macrophages, CX3CR1 macrophages on day 1 and 14 after ACLR surgery. (B) Cluster dendrogram. (C) Heat map showing expression of DEGs divided into 8 groups by k‐means‐clustering. Averaged CPM values are z‐score‐transformed. Right panels: violin plots of expression of genes in groups 1–8. (D) Pathway analysis using canonical pathway data sets of IPAs. (E) Heat map of expression of genes in inflammation, wound healing, leukocyte migration, and defense response to virus pathways. IPA = ingenuity pathway analysis.
Fig. 6
Fig. 6
CCR2‐deficiency results in increased bone mass in the bone tunnel. The knee joints (WT = 10, KO = 9) were harvested on day 28 (A) and day 14 (B,C) after ACLR surgery. (A,B) μCT analysis. Left panel shows bone volume per tissue volume of newly formed bone in the bone tunnel. Right panel shows representative 3D images of the bone tunnel in the distal femur and the proximal tibia. Scale bars: 1 mm. (C,D) Histological analysis and scoring. Representative images are shown in C. Histology score is shown in D (WT: n ≥ 11, CCR2KO: n ≥ 15). *p < 0.05 by two‐tailed unpaired t test (A) or one‐way ANOVA with Tukey's post hoc test (D). KO = knockout.

References

    1. Landen NX, Li D, Stahle M. Transition from inflammation to proliferation: a critical step during wound healing. Cell Mol Life Sci. 2016;73(20):3861‐3885. - PMC - PubMed
    1. Minutti CM, Knipper JA, Allen JE, Zaiss DM. Tissue‐specific contribution of macrophages to wound healing. Semin Cell Dev Biol. 2017;61:3‐11. - PubMed
    1. Shook BA, Wasko RR, Rivera‐Gonzalez GC, et al. Myofibroblast proliferation and heterogeneity are supported by macrophages during skin repair. Science. 2018;362(6417):eaar2971. - PMC - PubMed
    1. Wynn TA, Vannella KM. Macrophages in tissue repair, regeneration, and fibrosis. Immunity. 2016;44(3):450‐462. - PMC - PubMed
    1. Gieseck RL 3rd, Wilson MS, Wynn TA. Type 2 immunity in tissue repair and fibrosis. Nat Rev Immunol. 2018;18(1):62‐76. - PubMed