. 2022 Jun 22;6(7):e10654.
doi: 10.1002/jbm4.10654. eCollection 2022 Jul.

The Cortical Bone Metabolome of C57BL/6J Mice Is Sexually Dimorphic

Affiliations

The Cortical Bone Metabolome of C57BL/6J Mice Is Sexually Dimorphic

Hope D Welhaven et al. JBMR Plus. .

Abstract

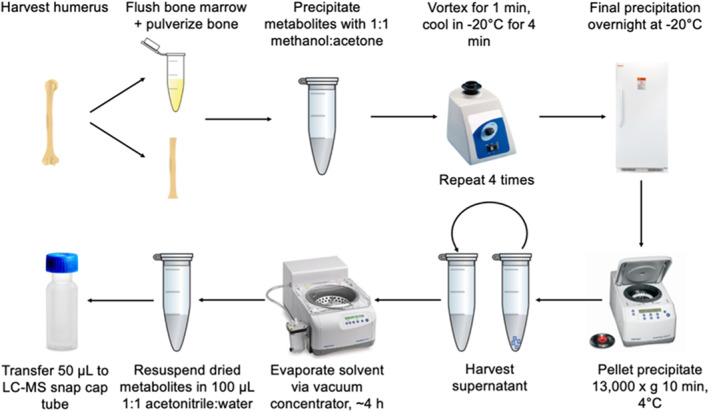
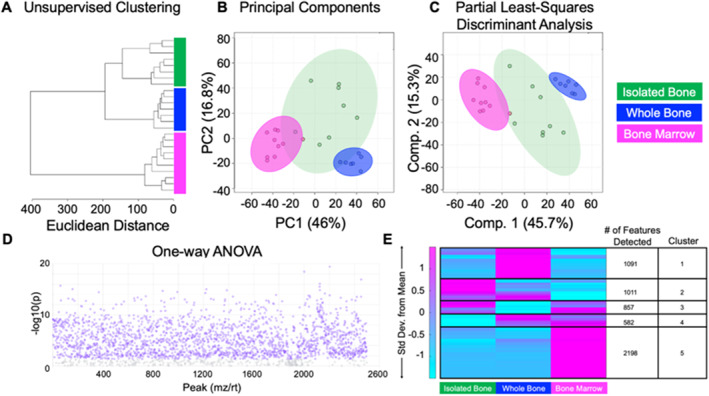
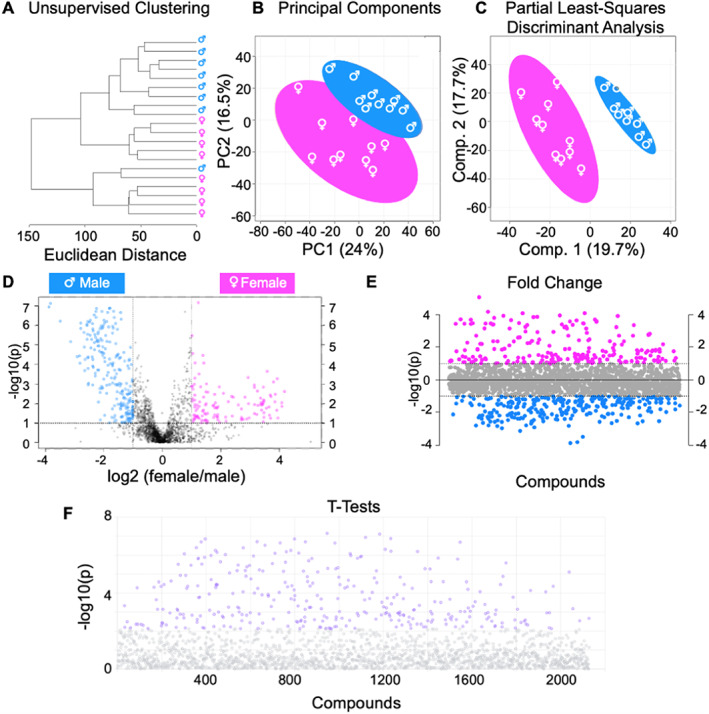
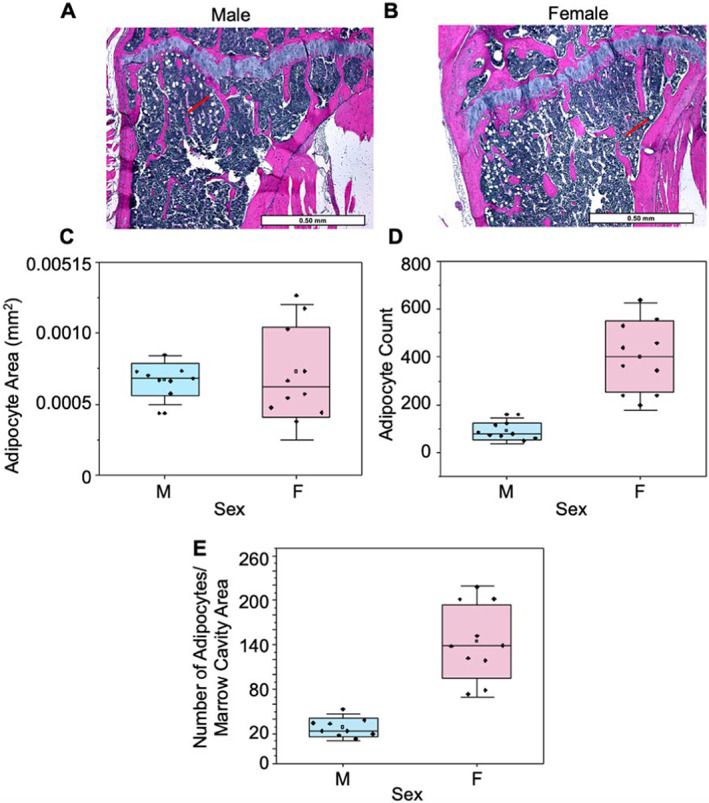
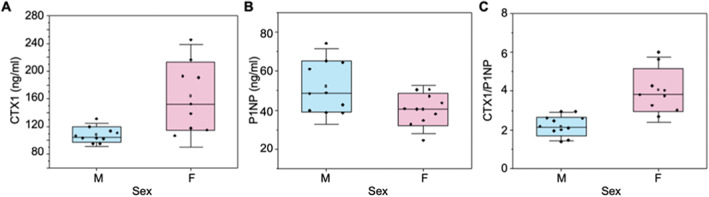
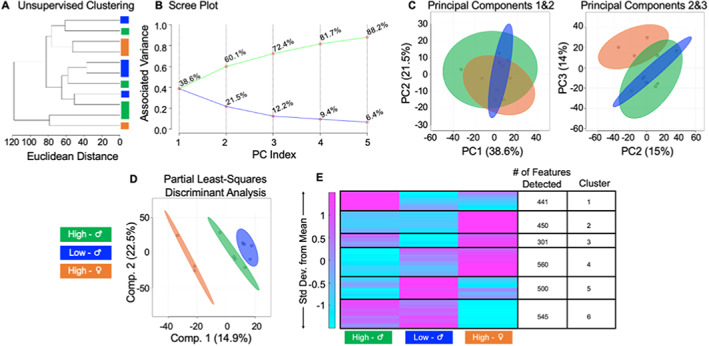
Cortical bone quality, which is sexually dimorphic, depends on bone turnover and therefore on the activities of remodeling bone cells. However, sex differences in cortical bone metabolism are not yet defined. Adding to the uncertainty about cortical bone metabolism, the metabolomes of whole bone, isolated cortical bone without marrow, and bone marrow have not been compared. We hypothesized that the metabolome of isolated cortical bone would be distinct from that of bone marrow and would reveal sex differences. Metabolite profiles from liquid chromatography-mass spectrometry (LC-MS) of whole bone, isolated cortical bone, and bone marrow were generated from humeri from 20-week-old female C57Bl/6J mice. The cortical bone metabolomes were then compared for 20-week-old female and male C57Bl/6J mice. Femurs from male and female mice were evaluated for flexural material properties and were then categorized into bone strength groups. The metabolome of isolated cortical bone was distinct from both whole bone and bone marrow. We also found sex differences in the isolated cortical bone metabolome. Based on metabolite pathway analysis, females had higher lipid metabolism, and males had higher amino acid metabolism. High-strength bones, regardless of sex, had greater tryptophan and purine metabolism. For males, high-strength bones had upregulated nucleotide metabolism, whereas lower-strength bones had greater pentose phosphate pathway metabolism. Because the higher-strength groups (females compared with males, high-strength males compared with lower-strength males) had higher serum type I collagen cross-linked C-telopeptide (CTX1)/procollagen type 1 N propeptide (P1NP), we estimate that the metabolomic signature of bone strength in our study at least partially reflects differences in bone turnover. These data provide novel insight into bone bioenergetics and the sexual dimorphic nature of bone material properties in C57Bl/6 mice. © 2022 The Authors. JBMR Plus published by Wiley Periodicals LLC on behalf of American Society for Bone and Mineral Research.

Keywords: BONE QUALITY; METABOLISM; METABOLOMICS; SEX DIFFERENCES.


Conflict of interest statement

The authors have no conflicts of interest to disclose. Dr. June owns stock in Beartooth Biotech which was not involved in this study.

Figures

Fig. 1
Fig. 1
Experimental protocol for extracting metabolites from bone and bone marrow.
Fig. 2
Fig. 2
The metabolomes of whole bone, isolated cortical bone, and bone marrow are distinct. A total of 2764 metabolite features were detected across all experimental groups including isolated bone, whole bone, and bone marrow. Features were analyzed using unsupervised (HCA and PCA) and supervised (PLS‐DA) statistical methods. (A) Unsupervised HCA visualized by a dendrogram reveals that the metabolome individual tissues cluster together and are distinct from each other. (B) PCA, shown as a scatterplot, displays minimal overlap of clusters. The x axis shows PC1, which accounts for 46% of the variation in the dataset, and the y axis shows PC2, which accounts for 16.8% of variation. (C) Supervised PLS‐DA further displays clear separation of groups and further supports the notion that the metabolome of various tissues including isolated bone, whole bone, and bone marrow are unique. Component 1 and 2 combined accounts for 63% of variation within the dataset. The colors in AC correspond to experimental groups: green = isolated bone, blue = whole bone, pink = bone marrow. (D) ANOVA analysis identifies over 2000 statistically significant metabolite that are differentially regulated across tissues. (E) Heat map analysis reveals that metabolic phenotypes greatly differ between isolated bone, whole bone, and bone marrow. Median intensities were clustered into three respective groups via MATLAB to visualize metabolic differences and phenotypes for tissues of interest. HCA = hierarchical cluster analysis; PCA = principal component analysis; PLS‐DA = partial least squares‐discriminant analysis.
Fig. 3
Fig. 3
Metabolomic profiles of isolated bone show sexual dimorphism. A total of 2129 metabolite features were detected and analyzed by both unsupervised HCA and PCA and supervised PLS‐DA. (A) Unsupervised HCA visualized by a dendrogram displays distinguished clusters between male and female mice, except for one male mouse clustering among females. (B) PCA, like HCA, displays distinguished clusters with minimal overlap of males and females. PCA is shown as a scatterplot with the first two PC on the x and y axes. The x axis shows PC1 which accounts for 24% of the variation in the dataset. PC2 is on the y‐axis and accounts for 16.5% of the variation in the dataset. (C) Supervised PLS‐DA finds clear separation between the metabolomes of male and female mice. PLS‐DA is also shown as a scatterplot of the top two components, with component 1 accounting for 19.7% and component 2 accounting for 17.7% of variation within the dataset. The colors in AC correspond to sample cohorts: blue = control males, pink = control females. (D) Volcano plot analysis displays differentially regulated metabolite features that were distinguished between cohorts using both FC and FDR adjusted p value. When comparing males and females, 126 metabolite features in the upper right quadrant had an FC >3 and a p value <0.05 and these features were significantly higher in control female mice. Similarly, 225 features in the upper left quadrant were associated with control male mice. (E) FC analysis was utilized to further examine the differences in metabolomes of female and male mice. 211 metabolite features (p value < 0.05) with a positive FC correspond to female mice, and 267 metabolite features with a negative FC correspond to male mice. (F) Analysis by t test identified 318 significant metabolites (p value < 0.05). FC = fold change; FDR = false discovery rate; HCA = hierarchical cluster analysis; PCA = principal component analysis; PLS‐DA = partial least squares‐discriminant analysis.
Fig. 4
Fig. 4
Bone marrow adiposity exhibits sexual dimorphic behavior. (A,B) Male (right) and female (left) H&E‐stained proximal tibia imaged at 4×. Red arrows point to adipocytes. Measurements calculated include (C) adipocyte size (mm2), (D) adipocyte count, and (E) number of adipocytes per marrow cavity area in male and female mice.
Fig. 5
Fig. 5
Global serum biomarkers, P1NP and CTX1, differ in concentration between male and female mice. (A) CTX1, a biomarker of bone resorption, concentration was higher in female mice compared to males. (B) P1NP, a biomarker of bone formation, concentration was higher in males compared to females. (C) The ratio of CTX1/P1NP is a measure of net bone resorption compared with formation. This measure was higher for females (p < 0.05).
Fig. 6
Fig. 6
Differences in whole bone strength correspond to metabolic differences in male and female mice. An untargeted metabolomic approach was utilized to generate metabolomic profiles based on whole‐bone strength. (A) HCA, visualized by a dendrogram, displays that the metabolome of bone differing by strength somewhat differs. (B) Scree plot reveals how much variation is being captured in each principal component from the data. (C) PCA analysis, captured by PC1 and PC2, show moderate overlap of groups. Together, PC1 and PC2 account for approximately 60% of the variation in the dataset. PCA analysis captured by PC2 and PC3 show improved separation compared to B. (D) PLS‐DA analysis displays complete separation of groups. Similarly, component 1 and 2 combined account for 30% of the variation in the dataset. (E) Median intensity heat map analysis shows that the metabolome of stronger and weaker bones differs from each other, and when accounting for sex. Median intensities were clustered into three respective groups via MATLAB to visualize and identify metabolic pathways and features that differ between groups. The colors in AE correspond to sample cohorts: green = high‐strength males; blue = low‐strength males, orange = high‐strength females.

Similar articles

Cited by

References

    1. Berman AG, Damrath JG, Hatch J, et al. Effects of Raloxifene and tibial loading on bone mass and mechanics in male and female mice. Connect Tissue Res. 2022;63(1):3‐15. - PMC - PubMed
    1. Glatt V, Canalis E, Stadmeyer L, Bouxsein ML. Age‐related changes in trabecular architecture differ in female and male C57BL/6J mice. J Bone Miner Res. 2007;22(8):1197‐1207. - PubMed
    1. Liu Z, Solesio ME, Schaffler MB, et al. Mitochondrial function is compromised in cortical bone osteocytes of Long‐lived growth hormone receptor null mice. J Bone Miner Res. 2019;34(1):106‐122. - PMC - PubMed
    1. Meakin LB, Galea GL, Sugiyama T, Lanyon LE, Price JS. Age‐related impairment of bones' adaptive response to loading in mice is associated with sex‐related deficiencies in osteoblasts but no change in osteocytes. J Bone Miner Res. 2014;29(8):1859‐1871. - PMC - PubMed
    1. Mumtaz H, Dallas M, Begonia M, et al. Age‐related and sex‐specific effects on architectural properties and biomechanical response of the C57BL/6N mouse femur, tibia and ulna. Bone Rep. 2020;12:100266. - PMC - PubMed

LinkOut - more resources