. 2022 May 31;3(7):955-971.
doi: 10.1039/d2cb00077f. eCollection 2022 Jul 6.

Listeria monocytogenes utilizes the ClpP1/2 proteolytic machinery for fine-tuned substrate degradation at elevated temperatures

Affiliations

Listeria monocytogenes utilizes the ClpP1/2 proteolytic machinery for fine-tuned substrate degradation at elevated temperatures

Dóra Balogh et al. RSC Chem Biol. .

Abstract

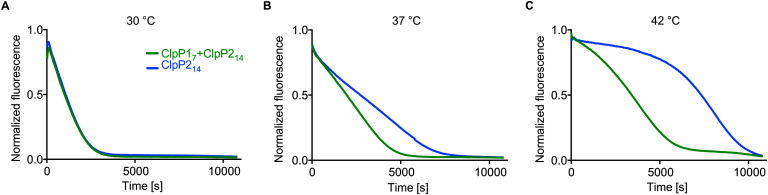
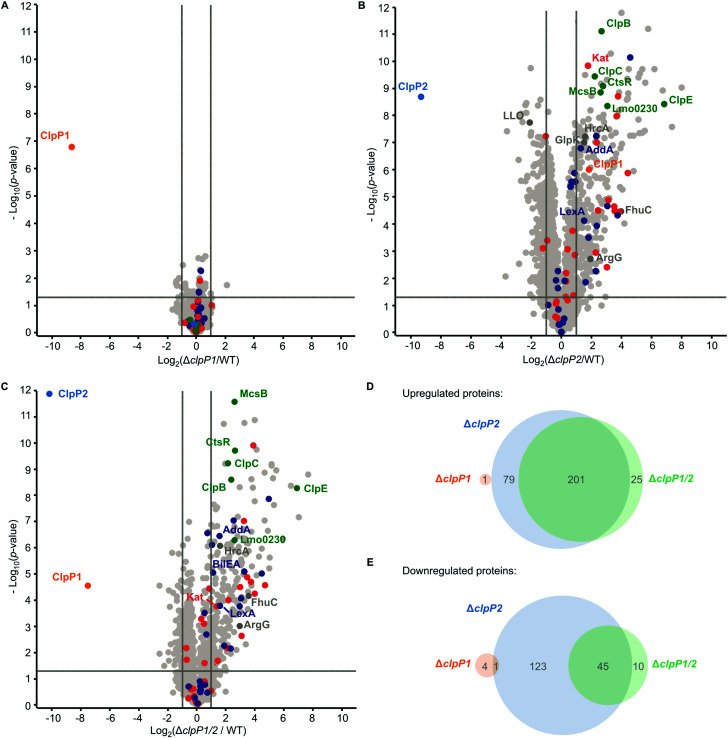
Listeria monocytogenes exhibits two ClpP isoforms (ClpP1/ClpP2) which assemble into a heterooligomeric complex with enhanced proteolytic activity. Herein, we demonstrate that the formation of this complex depends on temperature and reaches a maximum ratio of about 1 : 1 at 30 °C, while almost no complex formation occurred below 4 °C. In order to decipher the role of the two isoforms at elevated temperatures, we constructed L. monocytogenes ClpP1, ClpP2 and ClpP1/2 knockout strains and analyzed their protein regulation in comparison to the wild type (WT) strain via whole proteome mass-spectrometry (MS) at 37 °C and 42 °C. While the ΔclpP1 strain only altered the expression of very few proteins, the ΔclpP2 and ΔclpP1/2 strains revealed the dysregulation of many proteins at both temperatures. These effects were corroborated by crosslinking co-immunoprecipitation MS analysis. Thus, while ClpP1 serves as a mere enhancer of protein degradation in the heterocomplex, ClpP2 is essential for ClpX binding and functions as a gatekeeper for substrate entry. Applying an integrated proteomic approach combining whole proteome and co-immunoprecipitation datasets, several putative ClpP2 substrates were identified in the context of different temperatures and discussed with regards to their function in cellular pathways such as the SOS response.


Conflict of interest statement

There are no conflicts of interest to declare.

Figures

Fig. 1
Fig. 1. Purification of ClpP1/2 at 4 °C and at room temperature. (A) Schematic representation of ClpP1 (orange) and ClpP2 (blue) compositions at different temperatures according to size-exclusion chromatography. (B) Size-exclusion chromatography was performed on a Superdex 200 pg 16/60 column of co-expressed ClpP1/2 purified at 4 °C and 26 °C. Purifications of L. monocytogenes ClpP1/2 at 4 °C yielded a mixture of heptameric ClpP1 and tetradecameric ClpP2 (blue curve with shoulder), whereas a tetradecameric ClpP1/2 heterocomplex was obtained at room temperature (red curve).
Fig. 2
Fig. 2. Temperature-dependent formation of the ClpP1/2 heterocomplex. (A) Scheme of the SEC/ip-MS workflow. Orange: ClpP1, blue: ClpP2. (B) Size-exclusion chromatography of ClpP17 and ClpP214 after incubation at the indicated temperatures for 30 min. Black line indicates the tetradecamer (C) Percentage of ClpP1 in the 14-mer peaks after 10 min (dotted line) or 30 min incubation (straight line), measured by intact protein mass spectrometry. (D) Size-exclusion chromatography of ClpP1/2 after incubation at 30 °C for 30 min followed by 0 °C for 0 min (green), 30 min (cyan) and 120 min (dark blue). (E) Size-exclusion chromatography of ClpP17 after incubation at 0 °C for 30 min (dark blue) and at 42 °C for 30 min (dark red) compared to a mixture of ClpP1 and ClpP2 at 42 °C for 30 min (orange).
Fig. 3
Fig. 3. Protease activity of ClpP17 and ClpP214 at different temperatures. ClpP (green line: 0.1 μM ClpP214 and 0.2 μM ClpP17, blue line: 0.1 μM ClpP214) and 0.4 μM ClpX6 were pre-incubated for 30 min at 30 °C (A), 37 °C (B) and 42 °C (C), subsequently the degradation of 0.4 μM GFP-SsrA was measured. Means of triplicates are shown. The experiments were independently repeated with qualitatively identical results (Fig. S3, ESI†).
Fig. 4
Fig. 4. L. monocytogenes ΔclpP mutants. (A) Structure of the vibralactone probe. (B) Validation of the ΔclpP mutants by western blot (top) and by fluorescent labelling with vibralactone probe (bottom). Coomassie-stained gels were used as loading control. Full gels and membranes are depicted in Fig. S8 (ESI†). (C) Growth curves of the ΔclpP mutants in BHI medium at 37 °C. Means of triplicates are shown. The experiment was independently repeated with qualitatively identical results (Fig. S5A, ESI†). (D) Intracellular growth of the ΔclpP mutants in murine macrophages. CFUs were determined after 7 h and normalized to WT as 100% (n = 6, two independent experiments in triplicates were performed, mean ± 95% confidence interval).
Fig. 5
Fig. 5. Whole proteome analysis of the L. monocytogenes ΔclpP mutants at 37 °C. (A)–(C) Proteomes of L. monocytogenes ΔclpP1 (A), ΔclpP2 (B) and ΔclpP1/2 (C) compared to the WT. Bacterial cultures were grown to stationary phase at 37 °C. −log10p-values from two-sample Student's t-test are plotted against log2 ratios of LFQ protein intensities. The vertical grey lines show 2-fold enrichment, the horizontal grey lines show −log10t-test p-value = 1.3. Samples were prepared in triplicates in two independent experiments (n = 6). Class III heat shock proteins (green), SOS response proteins (dark blue) and iron-containing proteins (red) are highlighted. Other proteins mentioned in the text are highlighted in dark grey if they are significantly dysregulated in the respective plot. ClpP1 and ClpP2 are shown in orange and blue respectively. (D) and (E) Venn-diagrams showing the up-(D) and downregulated (E) proteins in the proteomes of the ΔclpP mutants compared to the WT (fold enrichment ≥ 2, –log10t-test p-value ≥ 1.3, ClpP1 and ClpP2 excluded).
Fig. 6
Fig. 6. Whole proteome analysis of the L. monocytogenes ΔclpP mutants at 42 °C. (A)–(C) Proteomes of L. monocytogenes ΔclpP1 (A), ΔclpP2 (B) and ΔclpP1/2 (C) compared to the WT. Bacterial cultures were grown to stationary phase at 42 °C. −Log10p-values from two-sample Student's t-test are plotted against log2 ratios of LFQ protein intensities. The vertical grey lines show 2-fold enrichment, the horizontal grey lines show −log10t-test p-value = 1.3. Samples were prepared in triplicates in two independent experiments (n = 6). Class III heat shock proteins (green), SOS response proteins (dark blue) and iron-containing proteins (red) are highlighted. Other proteins mentioned in the text are highlighted in dark grey if they are significantly dysregulated in the respective plot. ClpP1 and ClpP2 are shown in orange and blue respectively. (D) and (E) Venn-diagrams showing the up-(D) and downregulated (E) proteins in the proteomes of the ΔclpP mutants compared to the WT (fold enrichment ≥ 2, –log10t-test p-value ≥ 1.3, ClpP1 and ClpP2 excluded).
Fig. 7
Fig. 7. Co-immunoprecipitation of ClpP1 and ClpP2 in L. monocytogenes ΔclpP mutants. Volcano plots of co-IPs with anti-ClpP antibody in L. monocytogenes ΔclpP2 (A) and ΔclpP1 (B) at stationary phase (37 °C). − Log10p-values from two-sample Student's t-test are plotted against log2 ratios of LFQ protein intensities. The vertical grey lines show 4-fold enrichment, the horizontal grey lines show –log10t-test p-value = 1.3 (n = 4). Oxidoreductases are highlighted with purple. ClpP1 and ClpP2 are shown in orange and blue respectively.
Fig. 8
Fig. 8. Proteomic analysis of the cellular functions of the ClpP isoforms and identification of putative substrates. (A) Proteins were classified as putative ClpP substrates (see Table 1) if they were significantly enriched both in the whole proteome analysis at 37 °C and/or 42 °C and in the anti-SaClpP co-IP of the respective ΔclpP mutants at the same temperature. Additional proteins that were significantly enriched only in the co-IP are listed in Tables S11 and S12 (ESI†). (B) Venn-diagram showing the putative substrates of ClpP2 at both temperatures.
Fig. 9
Fig. 9. L. monocytogenes ΔclpP1/2 is resistant against oxidative stress. Growth curves of the ΔclpP mutants in the presence of 100 ppm H2O2 (BHI medium, 37 °C). Note that the WT strain and the single clpP knockouts show no growth under these conditions. The experiment was independently repeated with qualitatively identical results (data not shown).

Similar articles

Cited by

References

    1. Radoshevich L. Cossart P. Nat. Rev. Microbiol. 2018;16:32–46. doi: 10.1038/nrmicro.2017.126. - DOI - PubMed
    1. Bucur F. I. Grigore-Gurgu L. Crauwels P. Riedel C. U. Nicolau A. I. Front. Microbiol. 2018;9:2700. doi: 10.3389/fmicb.2018.02700. - DOI - PMC - PubMed
    1. Michel B. PLoS Biol. 2005;3:e255. doi: 10.1371/journal.pbio.0030255. - DOI - PMC - PubMed
    1. van der Veen S. Hain T. Wouters J. A. Hossain H. de Vos W. M. Abee T. Chakraborty T. Wells-Bennik M. H. J. Microbiology. 2007;153:3593–3607. doi: 10.1099/mic.0.2007/006361-0. - DOI - PubMed
    1. Cohn M. T. Kjelgaard P. Frees D. Penadés J. R. Ingmer H. Microbiology. 2011;157:677–684. doi: 10.1099/mic.0.043794-0. - DOI - PubMed