Review
. 2023 Jan;57(1):11-24.
doi: 10.1002/jmri.28369. Epub 2022 Jul 22.

Automated Methods for Detecting and Quantitation of Enlarged Perivascular spaces on MRI

Affiliations
Review

Automated Methods for Detecting and Quantitation of Enlarged Perivascular spaces on MRI

Jasmine Moses et al. J Magn Reson Imaging. 2023 Jan.

Abstract

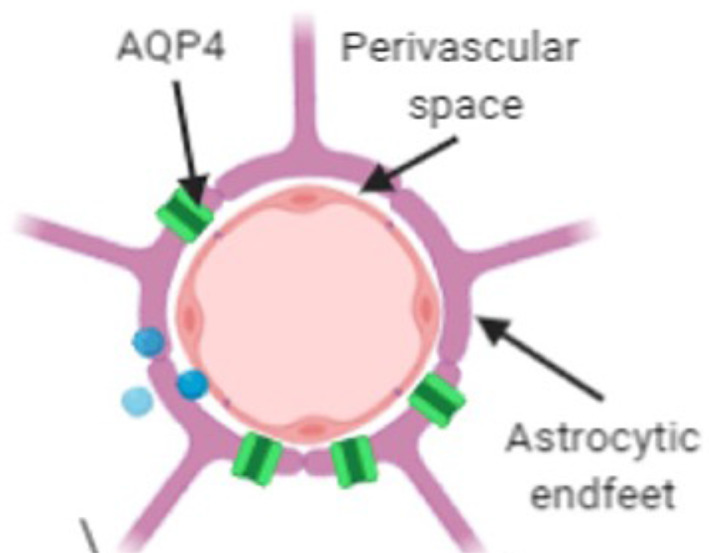
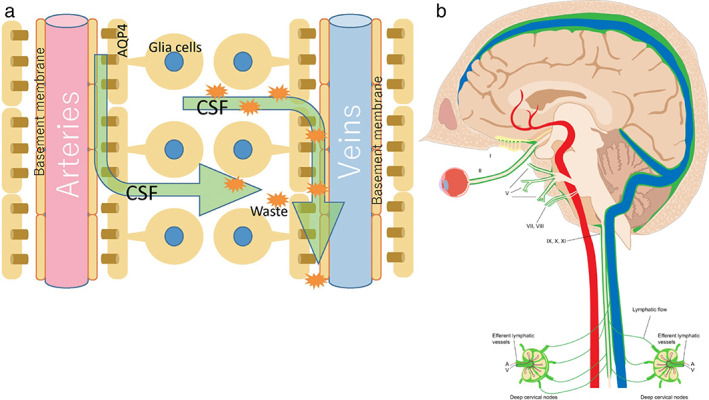
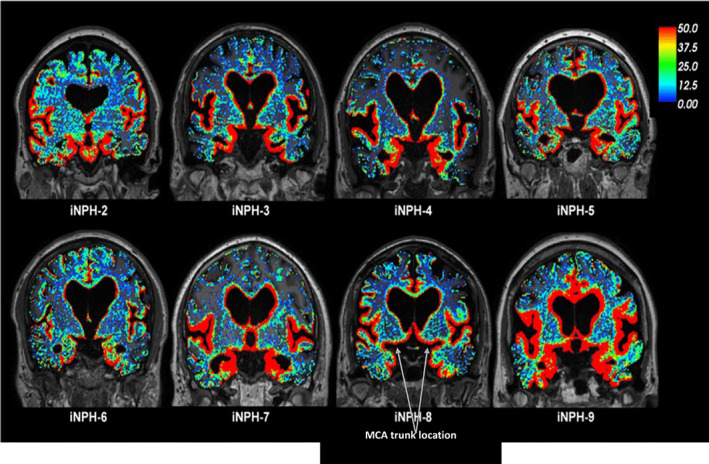
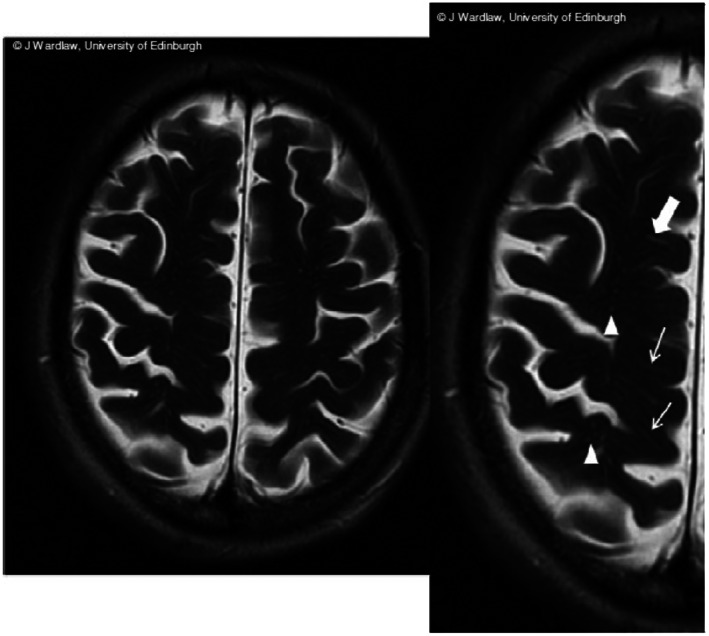
The brain's glymphatic system is a network of intracerebral vessels that function to remove "waste products" such as degraded proteins from the brain. It comprises of the vasculature, perivascular spaces (PVS), and astrocytes. Poor glymphatic function has been implicated in numerous diseases; however, its contribution is still unknown. Efforts have been made to image the glymphatic system to further assess its role in the pathogenesis of different diseases. Numerous imaging modalities have been utilized including two-photon microscopy and contrast-enhanced magnetic resonance imaging (MRI). However, these are associated with limitations for clinical use. PVS form a part of the glymphatic system and can be visualized on standard MRI sequences when enlarged. It is thought that PVS become enlarged secondary to poor glymphatic drainage of metabolites. Thus, quantitating PVS could be a good surrogate marker for glymphatic function. Numerous manual rating scales have been developed to measure the PVS number and size on MRI scans; however, these are associated with many limitations. Instead, automated methods have been created to measure PVS more accurately in different diseases. In this review, we discuss the imaging techniques currently available to visualize the glymphatic system as well as the automated methods currently available to measure PVS, and the strengths and limitations associated with each technique. EVIDENCE LEVEL: 1 TECHNICAL EFFICACY: Stage 1.

Keywords: MRI; Virchow-Robin spaces; brain; glymphatic; perivascular spaces; quantification.


Figures

FIGURE 1
FIGURE 1
The perivascular unit. Source: Adapted from reference . Perivascular spaces (PVS) are potential cerebrospinal fluid (CSF) spaces shaped as a cylinder that surround the brain's vasculature as it penetrates the brain. Astrocytes are glial cells whose end feet surround the arteries on the other side of the perivascular space and play a role in adjusting blood flow. Aquaporin‐4 (AQP4) water channels are embedded in the astrocytic endfeet and facilitate the exchange of fluids.,
FIGURE 2
FIGURE 2
Pathway through the glymphatic system. Source: (a) Taken from reference . Source: (b) Taken from reference . (a) Schematic of the pathway of CSF fluid through the glymphatic drainage system via perivascular spaces is shown. CSF enters the perivascular space surrounding the artery. The fluid then moves into the brain parenchyma via the AQP4 water channels. CSF enters the perivascular space surrounding veins, bringing any toxic proteins and metabolites (orange starburst shapes) from the brain tissue with it. Fluids, toxic proteins, and metabolites then drain through the glymphatic system, eventually draining into lymph nodes in the neck. (b) Green represents the lymphatic drainage from the brain into the cervical lymph nodes in the neck. Fluid drains from the ISF‐meningeal connections along the dural venous system to the deep lymph nodes in the neck. CSF = cerebrospinal fluid; AQP4 = aquaporin‐4; ISF = interstitial fluid.
FIGURE 3
FIGURE 3
Imaging the glymphatic system by contrast‐enhanced MRI. Source: Taken from reference .The glymphatic system was visualized in patients with idiopathic normal pressure hydrocephalus (iPH). Gadobutrol was used as the MRI contrast agent to visualize the CSF. Standardized T1w MRI scans were performed before and after intrathecal gadobutrol infusion at defined time points. Red represents areas of increased tracer uptake, green represents areas of moderate tracer uptake, and blue represents areas of poor tracer uptake. Scans taken from eight participants with iPH are shown. The color scale shows the percentage change in signal unit ratio. This demonstrates the clearance of the tracer in areas adjacent to the vasculature, most likely via PVS.
FIGURE 4
FIGURE 4
Enlarged perivascular spaces on MRI. Source: Taken from reference Linear (arrows) and round (triangles) PVS structures visible on T2‐weighted coronal MRI. MRI = magnetic resonance image, PVS = perivascular space.
FIGURE 5
FIGURE 5
Wardlaw Rating Scale. Wardlaw et al's STRIVE criteria define a PVS on MRI imaging as a fluid‐filled space of similar intensity to CSF on all imaging modalities. They can appear as either linear or ovoid/round depending on the orientation of the vessel it surrounds. PVS are typically <3 mm; however, sizes >1.5 cm have been reported. This criterion involves visually assessing MRI scans of the brain, taking slices from the centrum semiovale, basal ganglia, and midbrain. After selecting the axial slice with highest PVS burden assessed visually, the number of PVS are manually counted to assign the scan into a category on Wardlaw's PVS scale. Examples of a scan placed in category 1 is shown on the left with few PVS visible, and an example of a scan placed in category 4 is shown on the right with large numbers of PVS visible. MRI = magnetic resonance imaging; CSF = cerebrospinal fluid; PVS = perivascular spaces; EPVS = enlarged perivascular spaces.
FIGURE 6
FIGURE 6
Automated PVS detection methods. The three main techniques for automated PVS segmentation are shown with their associated literature: intensity thresholding, vesselness filter, and machine learning. (a) The final PVS mask created from the lesion explorer program using intensity‐based thresholds to identify PVS. (b) The final PVS mask created using enhanced PVS contrast and the Frangi filter to identify PVS based off vesselness. (c) The ground truth PVS mask. (d) The final PVS mask created using the Haar transform of nonlocal cubes and block‐matching filtering. (e) The 3D rendering of the ground truth PVS mask. (f) The 3D rendering of the final PVS mask using the Haar transform of nonlocal cubes and block‐matching filtering machine learning technique.

Similar articles

Cited by

References

    1. Troili F, Cipollini V, Moci M, et al. Perivascular unit: This must be the place. The anatomical crossroad between the immune vascular and nervous system. Front Neuroanat 2020;14:17. - PMC - PubMed
    1. Nedergaard M, Goldman SA. Brain drain. Sci Am 2016;314(3):44‐49. - PMC - PubMed
    1. Woollam DH, Millen JW. The perivascular spaces of the mammalian central nervous system and their relation to the perineuronal and subarachnoid spaces. J Anat 1955;89(2):193‐200. - PMC - PubMed
    1. Iliff JJ, Wang M, Liao Y, et al. A paravascular pathway facilitates CSF flow through the brain parenchyma and the clearance of interstitial solutes, including amyloid β. Sci Transl Med 2012;4(147):147ra111. - PMC - PubMed
    1. Iliff JJ, Lee H, Yu M, et al. Brain‐wide pathway for waste clearance captured by contrast‐enhanced MRI. J Clin Invest 2013;123(3):1299‐1309. - PMC - PubMed

Publication types

MeSH terms