. 2022 Jul 22;7(14):e158199.
doi: 10.1172/jci.insight.158199.

PTP1B inhibitors protect against acute lung injury and regulate CXCR4 signaling in neutrophils

Affiliations

PTP1B inhibitors protect against acute lung injury and regulate CXCR4 signaling in neutrophils

Dongyan Song et al. JCI Insight. .

Abstract

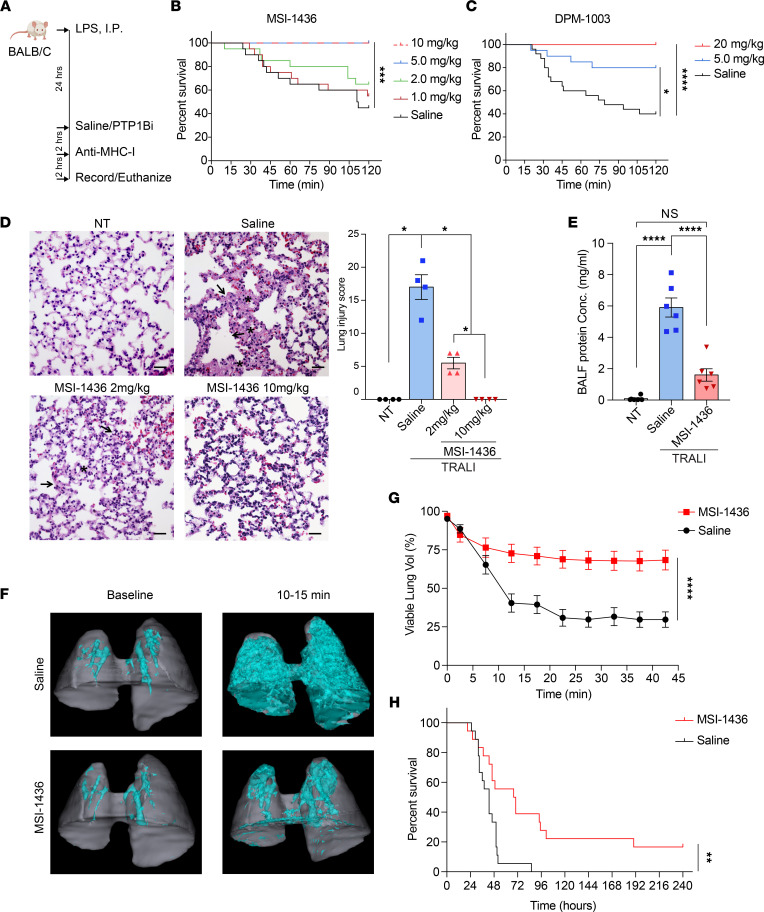
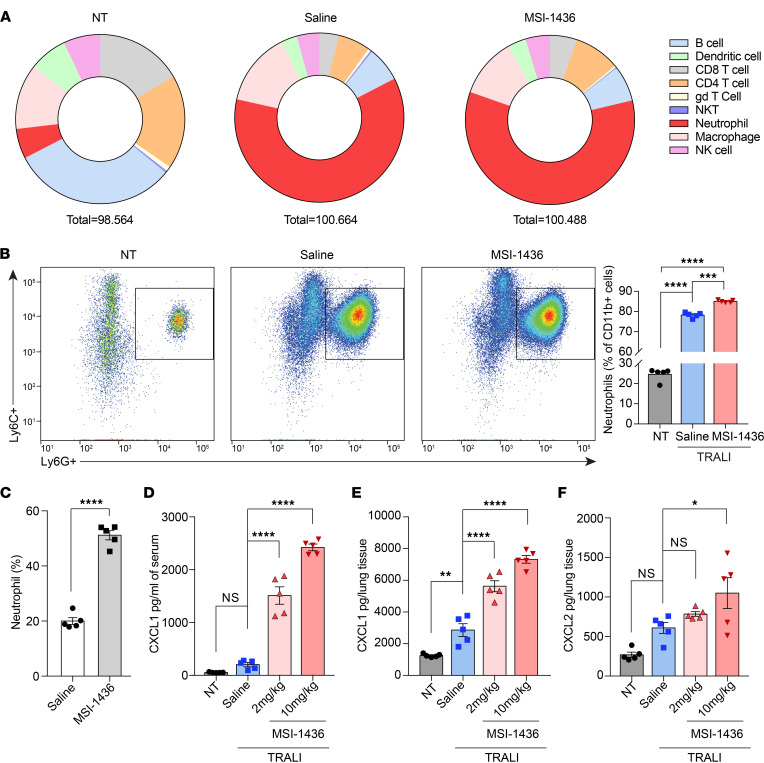
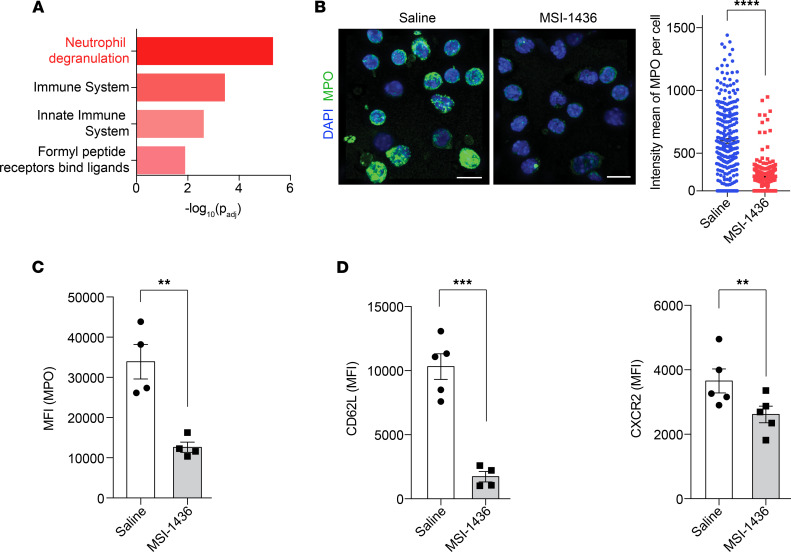
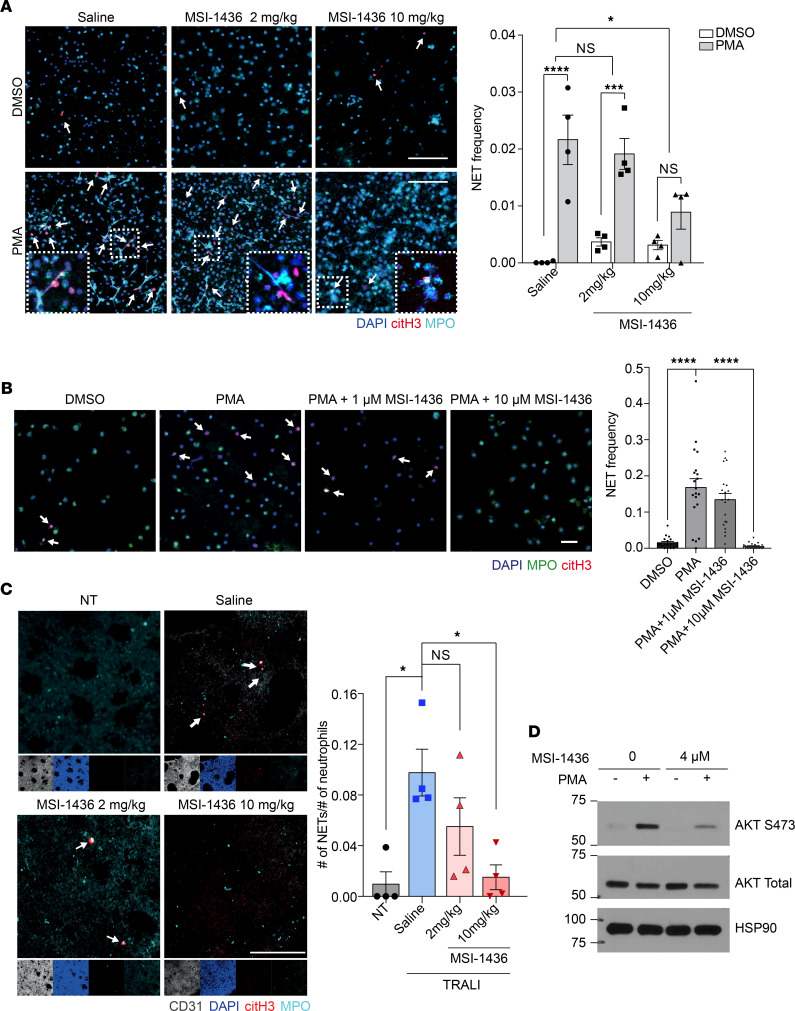
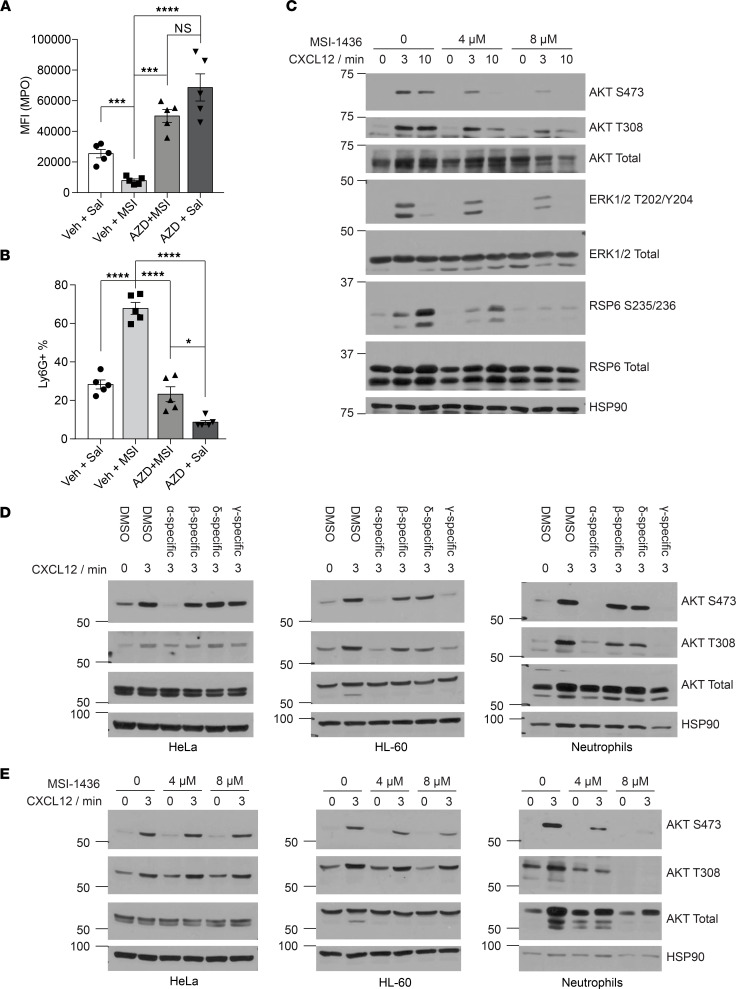
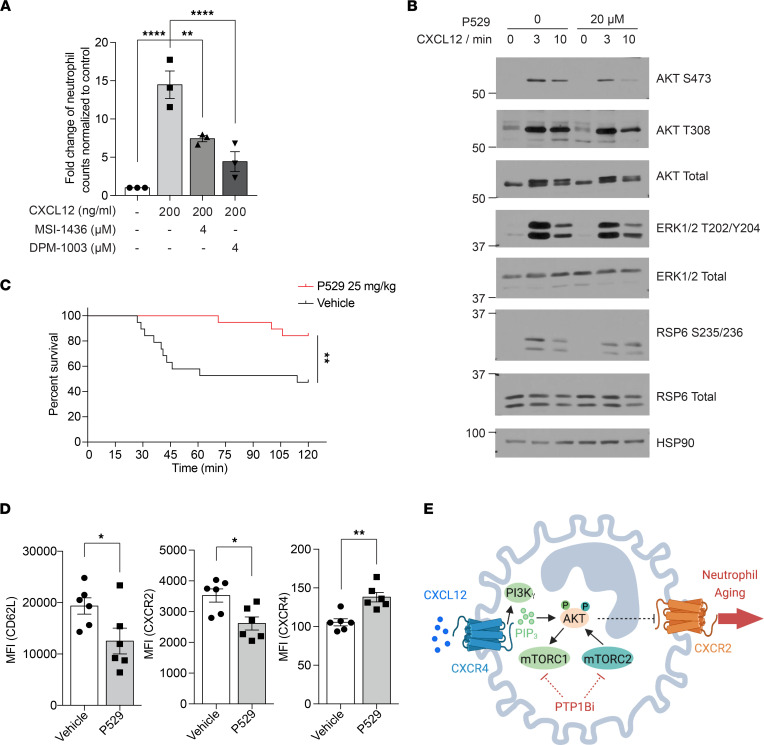
Acute lung injury (ALI) can cause acute respiratory distress syndrome (ARDS), a lethal condition with limited treatment options and currently a common global cause of death due to COVID-19. ARDS secondary to transfusion-related ALI (TRALI) has been recapitulated preclinically by anti-MHC-I antibody administration to LPS-primed mice. In this model, we demonstrate that inhibitors of PTP1B, a protein tyrosine phosphatase that regulates signaling pathways of fundamental importance to homeostasis and inflammation, prevented lung injury and increased survival. Treatment with PTP1B inhibitors attenuated the aberrant neutrophil function that drives ALI and was associated with release of myeloperoxidase, suppression of neutrophil extracellular trap (NET) formation, and inhibition of neutrophil migration. Mechanistically, reduced signaling through the CXCR4 chemokine receptor, particularly to the activation of PI3Kγ/AKT/mTOR, was essential for these effects, linking PTP1B inhibition to promoting an aged-neutrophil phenotype. Considering that dysregulated activation of neutrophils has been implicated in sepsis and causes collateral tissue damage, we demonstrate that PTP1B inhibitors improved survival and ameliorated lung injury in an LPS-induced sepsis model and improved survival in the cecal ligation and puncture-induced (CLP-induced) sepsis model. Our data highlight the potential for PTP1B inhibition to prevent ALI and ARDS from multiple etiologies.

Keywords: Cell Biology; Neutrophils.


Conflict of interest statement

Conflict of interest: ME is a member of the brensocatib research advisory board for Insmed Inc., a member of the scientific advisory board for Vividion Therapeutics Inc., and a consultant for Protalix Inc. NKT is a member of the Scientific Advisory Board of DepYmed Inc.

Figures

Figure 1
Figure 1. PTP1B inhibitors improved survival and ameliorated lung damage in the TRALI mouse model.
(A) Schematic illustration of the TRALI induction and PTP1B inhibition protocol. (B) The survival curves of TRALI mice treated with increasing concentrations of the PTP1B inhibitor MSI-1436 or saline (n = 20 mice, 2 independent biological repeats). (C) The survival curves of TRALI mice treated with increasing concentrations of the PTP1B inhibitor DPM-1003 or saline (n = 20–25 mice, 2 independent biological repeats). (D) Representative images of H&E-stained lung tissue from no treatment mice (NT), and TRALI mice after administering saline, MSI-1436 at 2 mg/kg, or MSI-1436 at 10 mg/kg. Arrows indicate alveolar damage. Asterisks indicate edema or hyaline membranes. Scale bars: 25 μm. Lung injury scores for each treatment group. (n = 4 mice per group). (E) The protein concentrations in the bronchoalveolar lavage fluid (BALF) collected from NT or TRALI mice treated with either saline or 10 mg/kg MSI-1436 (n = 6 mice per group). (F) Representative 3D-rendered images of lung volumes from CT scans of mice from the saline- and MSI-1436–treated TRALI mice. Cyan represents hyperdense areas of edema and vasculature (Hounsfield units [HU] > 0); gray represents hypodense regions of airspace — i.e. viable lung (HU < 0). (G) The percentage of viable lung volume (volume of viable lung/volume of total lung) calculated from longitudinal CT scans in 2 experimental groups as in F. (n = 7–8 mice per group). (H) The survival curves of CLP-induced sepsis model treated either with saline or 5 mg/kg MSI-1436 at 2 hours before surgery (n = 18 mice per group). Data are presented as mean ± SEM. Statistical analysis for B, C, and H by was done log-rank (Mantel-Cox) test; by nonparametric 2-tailed Mann-Whitney test for D; by 1-way ANOVA with Tukey’s multiple-comparison test for E; and by 2-way ANOVA for G. *P < 0.05, **P < 0.01, ****P < 0.0001
Figure 2
Figure 2. Treatment with PTP1B inhibitors in vivo induced neutrophilia.
(A) Pie charts of flow cytometry analysis to measure infiltration of 9 immune cell populations into lung tissues. The numbers are average abundance of each immune cell subset (% of CD45+ cells, n = 5). For saline- and MSI-1436–treated (10 mg/kg) groups, the lungs were harvested 30 minutes after TRALI induction. (B) Representative flow cytometry plots for neutrophils infiltrated into lung tissues. Quantification of percentage of neutrophil population out of myeloid cells. (C) Percentage of neutrophils (relative to total WBCs) in peripheral blood from mice treated with saline or 10 mg/kg MSI-1436 for 2.5 hours (n = 5). (D and E) CXCL1 levels in serum (D) and matched lung tissue (E) from NT and TRALI mice treated with saline or MSI-1436 at the indicated doses (n = 5). (F) CXCL2 levels in lung tissue from NT and TRALI mice treated with saline or MSI-1436 at the indicated doses (n = 5). Data are presented as mean ± SEM. Statistical analysis for C was performed by 2-tailed Student’s t test and by 1-way ANOVA with Tukey’s multiple-comparison test for B and DF. *P < 0.05, **P < 0.01, ***P < 0.001, ****P < 0.0001.
Figure 3
Figure 3. Treatment with MSI-1436 in vivo induced an aged-neutrophil phenotype.
(A) Reactome pathway analysis performed using g:Profiler for genes upregulated upon MSI-1436 treatment. (B) Representative confocal immunofluorescence microscopy images and quantification of neutrophils isolated from peripheral blood 2.5 hours after injection of saline or MSI-1436, and stained with anti-MPO (green) and DAPI (blue). Scale bars: 10 μm, n = 4 mice per group. (C) Neutrophils stained for MPO-containing granules from mice treated with saline or MSI-1436 for 2.5 hours. MPO signals were quantified as mean fluorescence intensity (MFI) (n = 4). (D) Surface expression of CD62L and CXCR2 on neutrophils from peripheral blood collected 2.5 hours after saline or MSI-1436 treatment, quantified as MFI (n = 5). Data are presented as mean ± SEM. Statistical analysis for BD by 2-tailed Student’s t test. **P < 0.01, ***P < 0.001, ****P < 0.0001.
Figure 4
Figure 4. Treatment with MSI-1436 suppressed NET formation ex vivo and in vivo.
(A) Representative immunofluorescence microscopy images and quantification, showing formation of NETs upon PMA treatment ex vivo. Arrows indicate NETs visualized by colocalization of DAPI (blue), citH3 (red), and MPO (cyan) staining. Higher magnifications of selected regions are shown in the lower squares. Scale bars: 100 μm, n = 4. The zoomed-in details for neutrophils treated with saline together with PMA (lower left panel), with 3 individual channels to show colocalization of DAPI, citH3, and MPO, is shown in Supplemental Figure 5A. (B) Representative confocal images and quantification, showing the NETosis frequency in response to PTP1B inhibitor and PMA stimulation. Scale bars: 50 μm, n = 4 mice per group with total 20 random fields for quantification. (C) Whole-mount staining of lung tissue from NT and TRALI mice administered saline, 2 mg/kg MSI-1436, or 10 mg/kg MSI-1436, with quantification of the frequencies of NETs. Arrows indicate NETs, visualized as in A. Scale bars: 100 μm, n = 4. (D) Immunoblot analyses showing AKT signaling changes using primary neutrophils isolated from BM. Representative immunoblot of 3 independent experiments. Data are presented as mean ± SEM. Statistical analysis for A was done by 1-way ANOVA with Dunnett’s multiple comparison test; by 1-way ANOVA with Sidak’s multiple-comparison test for B; and by 1-way ANOVA with Tukey’s multiple-comparison test for C. *P < 0.05, ***P < 0.001, ****P < 0.0001.
Figure 5
Figure 5. PTP1B inhibitors attenuated PI3Kγ-mediated CXCR4 signaling.
(A) Quantitation of MPO from neutrophils isolated from mice treated with vehicle + saline, vehicle + MSI-1436, AZD5069 + MSI-1436, and AZD5069 + saline (n = 5 mice for each group). (B) Percentage of neutrophils, designated as Ly6G+ population, relative to total WBCs, from the indicated treatment groups (n = 5 mice for each group). (C) Immunoblot analyses showing the effect of MSI-1436 on CXCR4 signaling upon CXCL12 stimulation from primary neutrophils isolated from BM. Representative immunoblot of 4 independent experiments. (D) Immunoblot analyses showing the AKT signaling in response to PI3K isoform–specific inhibitors in HeLa, HL-60, and mouse neutrophils. Inhibitors used: α-specific (HS-173, 1 μM); β-specific (GSK2636771, 10 μM); δ-specific (Nemiralisib, 100 nM); γ-specific (Eganelisib, 200 nM); pretreated 1 hour before CXCL12 stimulation. Representative immunoblot of 3 independent experiments. (E) Immunoblot analyses showing the impact of pretreatment with MSI-1436 on AKT signaling in HeLa, HL-60, and mouse primary neutrophils. Representative immunoblot of 3 independent experiments. Data are presented as mean ± SEM. Statistical analysis for A and B by 1-way ANOVA with Tukey’s multiple-comparison test. *P < 0.05, ***P < 0.001, ****P < 0.0001.
Figure 6
Figure 6. The effect of mTOR inhibitor on the survival of TRALI model and induction of aged-neutrophil phenotype.
(A) Neutrophil migration toward CXCL12 examined using Transwell assays (n = 3 independent biological repeats). (B) Immunoblot analyses showing the effect of P529 on mTOR signaling upon CXCL12 stimulation from primary neutrophils isolated from BM. Representative immunoblot of 3 independent experiments. (C) Survival curve of TRALI mice treated with vehicle or 25 mg/kg P529 (n = 19 mice, 2 independent biological repeats). (D) Surface expression of CD62L, CXCR2, and CXCR4 on neutrophils from peripheral blood collected 2.5 hours after vehicle or P529 treatment, quantified as MFI (n = 6 mice for each group). (E) Schematic representation of the proposed mechanism, created with BioRender.com. Data are presented as mean ± SEM. Statistical analysis for C by log-rank (Mantel-Cox) test and by 2-tailed Student’s t test for D; *P < 0.05, **P < 0.01, ****P < 0.0001.

Similar articles

Cited by

References

    1. Butt Y, et al. Acute lung injury: a clinical and molecular review. Arch Pathol Lab Med. 2016;140(4):345–350. doi: 10.5858/arpa.2015-0519-RA. - DOI - PubMed
    1. Winters BD, et al. Long-term mortality and quality of life in sepsis: a systematic review. Crit Care Med. 2010;38(5):1276–1283. doi: 10.1097/CCM.0b013e3181d8cc1d. - DOI - PubMed
    1. Zhou P, et al. A pneumonia outbreak associated with a new coronavirus of probable bat origin. Nature. 2020;579(7798):270–273. doi: 10.1038/s41586-020-2012-7. - DOI - PMC - PubMed
    1. Matthay MA, Zemans RL. The acute respiratory distress syndrome: pathogenesis and treatment. Annu Rev Pathol. 2011;6:147–163. doi: 10.1146/annurev-pathol-011110-130158. - DOI - PMC - PubMed
    1. Summers C, et al. Neutrophil kinetics in health and disease. Trends Immunol. 2010;31(8):318–324. doi: 10.1016/j.it.2010.05.006. - DOI - PMC - PubMed

Publication types

Substances