. 2022 Aug 4;14(30):11028-11037.
doi: 10.1039/d2nr02131e.

Quantitatively linking morphology and optical response of individual silver nanohedra

Affiliations

Quantitatively linking morphology and optical response of individual silver nanohedra

Yisu Wang et al. Nanoscale. .

Abstract

The optical response of metal nanoparticles is governed by plasmonic resonances, which are dictated by the particle morphology. A thorough understanding of the link between morphology and optical response requires quantitatively measuring optical and structural properties of the same particle. Here we present such a study, correlating electron tomography and optical micro-spectroscopy. The optical measurements determine the scattering and absorption cross-section spectra in absolute units, and electron tomography determines the 3D morphology. Numerical simulations of the spectra for the individual particle geometry, and the specific optical set-up used, allow for a quantitative comparison including the cross-section magnitude. Silver nanoparticles produced by photochemically driven colloidal synthesis, including decahedra, tetrahedra and bi-tetrahedra are investigated. A mismatch of measured and simulated spectra is found in some cases when assuming pure silver particles, which is explained by the presence of a few atomic layers of tarnish on the surface, not evident in electron tomography. The presented method tightens the link between particle morphology and optical response, supporting the predictive design of plasmonic nanomaterials.


Conflict of interest statement

The authors declare no conflicts of interest.

Figures

Fig. 1
Fig. 1. Schematic workflow as described in the text. (a) Photochemical formation of decahedra using blue LED illumination, monitored via the red-shift of the extinction from spherical seeds (dashed line) to decahedra (solid line). (b) Deposition of decahedra onto a TEM grid with SiO2 windows, index-matched by anisole immersion, and encapsulated by a glass slide and a coverslip. (c, d) Optical micro-spectroscopy in dark-field and bright-field configurations. BFP and FFP indicate, respectively, the back and front focal plane of the objective (obj) and condenser (cond) lens. (e) Measured single-decahedra scattering and absorption cross-section spectra in absolute units. (f) Correlative HAADF-STEM tomography through recognition of NP patterns as exemplified in (c). (g) 3D shape reconstruction from tomography. (h) Tetrahedral volume mesh used in numerical simulations. (i) Calculated spatial distribution of the Joule (resistive) heating. (j) Calculated far-field distribution of the scattering intensity. (k) Numerical simulations of cross-section spectra under experimental conditions. Panels e–k refer to the exemplary particle #20.
Fig. 2
Fig. 2. Measured (dashed lines) and simulated (solid lines) scattering (blue) and absorption (red) cross-section spectra of 6 selected particles as labelled, along with HAADF-STEM tomography surface views from the top and side. The scale bar is 40 nm. For particle #19, we show additionally the simulated scattering cross section for normal incidence for linear polarizations along (orange line) and across (green line) the long axis of the particle, as well as their average (black line).
Fig. 3
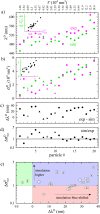
Fig. 3. Comparison of measured and simulated properties of the dipole peak in the scattering cross-section spectra for all investigated particles. (a) Position of the peak λDsca. For particles with multiple peaks, such as #19 or #3, the longer wavelength peak is shown. The symbols are indicative of the particle shape (see insets in Fig. 2 and ESI section S.V.†): #6 & #7 are tetrahedra, #8 & #10 are half spheres, #19 is a bitetrahedron, #3 is not well defined, the rest are decahedra. The inset shows simulated versus measured positions. (b) Amplitude of the peak. The inset shows simulated versus measured amplitudes. (c) Difference between the simulated and experimental peak position. (d) Ratio between simulated and experimental peak amplitude. (e) Peak amplitude ratio versus position difference.
Fig. 4
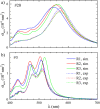
Fig. 4. Simulated and measured scattering cross-section spectra for particle #20 (a) and #3 (b) using different tomography reconstruction procedures R1 to R3 as labelled (see text).
Fig. 5
Fig. 5. Same as Fig. 4, but for increasing surface scattering gvF/R in the Drude damping of the Ag permittivity.
Fig. 6
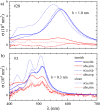
Fig. 6. Same as Fig. 4, but for the addition of a silver sulfide (Ag2S) tarnish layer of thickness h, and additionally showing the absorption cross section.

References

    1. Trügler A., Optical properties of metallic nanoparticles: basic principles and simulation, Springer, Cham, 2016
    1. Lee Y. Y. Kim R. M. Im S. W. Balamurugan M. Nam K. T. Nanoscale. 2020;12:58–66. doi: 10.1039/C9NR08433A. - DOI - PubMed
    1. Bohren C. F. and Huffman D. R., Absorption and Scattering of Light by Small Particles, Wiley-VCH Verlag, 1998
    1. Crut A. Maioli P. Del Fatti N. Vallée F. Chem. Soc. Rev. 2014;43:3921–3956. doi: 10.1039/C3CS60367A. - DOI - PubMed
    1. Olson J. Dominguez-Medina S. Hoggard A. Wang L.-Y. Chang W.-S. Link S. Chem. Soc. Rev. 2015;44:40–57. doi: 10.1039/C4CS00131A. - DOI - PMC - PubMed