. 2022 Aug 3;14(8):evac108.
doi: 10.1093/gbe/evac108.

Differentially Active and Conserved Neural Enhancers Define Two Forms of Adaptive Noncoding Evolution in Humans

Affiliations

Differentially Active and Conserved Neural Enhancers Define Two Forms of Adaptive Noncoding Evolution in Humans

Jason Pizzollo et al. Genome Biol Evol. .

Abstract

The human and chimpanzee genomes are strikingly similar, but our neural phenotypes are very different. Many of these differences are likely driven by changes in gene expression, and some of those changes may have been adaptive during human evolution. Yet, the relative contributions of positive selection on regulatory regions or other functional regulatory changes are unclear. Where are these changes located throughout the human genome? Are functional regulatory changes near genes or are they in distal enhancer regions? In this study, we experimentally combined both human and chimpanzee cis-regulatory elements (CREs) that showed either (1) signs of accelerated evolution in humans or (2) that have been shown to be active in the human brain. Using a massively parallel reporter assay, we tested the ability of orthologous human and chimpanzee CREs to activate transcription in induced pluripotent stem-cell-derived neural progenitor cells and neurons. With this assay, we identified 179 CREs with differential activity between human and chimpanzee; in contrast, we found 722 CREs with signs of positive selection in humans. Selection and differentially expressed CREs strikingly differ in level of expression, size, and genomic location. We found a subset of 69 CREs in loci with genetic variants associated with neuropsychiatric diseases, which underscores the consequence of regulatory activity in these loci for proper neural development and function. By combining CREs that either experienced recent selection in humans or CREs that are functional brain enhancers, presents a novel way of studying the evolution of noncoding elements that contribute to human neural phenotypes.

Keywords: Cis-regulation; human brain evolution; induced pluripotent stem cells; massively parallel enhancer assay.


Figures

Fig. 1.
Fig. 1.
Experimental approach using MPRAs. (A) Accelerated CREs were identified by computational methods that (1) find conserved noncoding sequences, and (2) identify brain CREs by the presence of histone marks associated with enhancers in humans but not other primates (shown in figure), or histone marks for brain-specific enhancers. (B) 230-mer oligonucleotides containing CRE and barcode sequences were cloned into a lentiviral vector, a minimal promoter and EGFP reporter gene were inserted between CREs and barcodes, and plasmids were packaged in lentivirus particles. (C) Lentivirus-containing MPRA library was used to transduce human and chimpanzee NPCs and neurons.
Fig. 2.
Fig. 2.
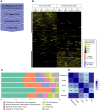
CREs exhibit distinct subsets of expression and function. (A) Background CREs include all 2,274 orthologous CREs in designed array. Selection tests identified 722 with signs of selection in human sequences. (B) Heatmap of log2-normalized RNA/DNA ratio for human CREs and chimpanzee CREs (268 orthologs), vertical bars on the left side of the plot indicate CREs that show significantly different levels of expression between orthologous CREs. (C) Proportion of enriched GO biological process terms in broad category types for each set of background, tested, active, DE, and selection (Sel) CREs. (D) Semantic similarity of enriched GO terms between CRE subsets.
Fig. 3.
Fig. 3.
Different genomic characteristics of selection and DE CREs. (A) The number of TSSs located within 1 Mb of background, selection (Sel) and DE CREs. Boxplots show median (horizontal black bar), first and third quartiles (upper and lower limits of boxes), whiskers (1.5 times the IQR, the third minus first quartile), and individual points (values beyond 1.5*IQR). (B) Number of active brain enhances within 1 Mb of CREs. (C) Size distribution of CREs. (D) Size distribution of active brain enhancers that contain CREs. (E) GC content in human and (F) chimpanzee CREs. (G) Plot of activity against size for human and chimpanzee CREs. Activity is the sum of log2-normalized RNA/DNA counts across all 12 replicates. Spearman correlation tests show relationships between activity and size.
Fig. 4.
Fig. 4.
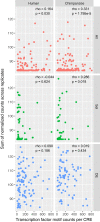
Activity versus transcription factor motif occurrences. The sum of log2-normalized RNA/DNA counts across all replicates is plotted against the total number of transcription factor motif occurrences in each CRE. Spearman correlation testes show relationships between motif occurrences and CRE activity.
Fig. 5.
Fig. 5.
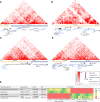
Overlaying CREs, chromatin contact maps, and neurological disease GWAS loci. (A–D) Hi-C data generated from prefrontal cortex by Schmitt et al. (2016) showing chromatin contacts in loci containing GWAS SNPs and DE CREs at the marked locations. Chromatin contacts are shown at 40 kb resolution (each individual square is 40 kb). Gene annotations under each Hi-C map were part of the 3D genome browser Wang et al. (2018) visualization but do not include unannotated transcripts. (E) Table describing GWAS SNPs, traits, nearby genes, and CREs in each locus. Log2-normalized RNA/DNA counts are shown for orthologous CREs in each of 12 replicates.
Fig. 6.
Fig. 6.
Genes modulating canonical Wnt signaling associated with selection and DE CREs. CREs were associated with genes if they occur within 500 kb of TSSs. Genes associated with selection CREs have square outlines. Genes associated with CREs that are DE between orthologs have red (higher in human) or blue (higher in chimpanzee) fill. Genes associated with CREs that are DE between cell types are marked with horizontal (higher in NPC) or vertical (higher in neuron) stripes, and stripe colors indicate if the human (stripes) or chimpanzee (stripes) CRE was DE. The selection and DE profiles of CREs associated with paralogous genes are combined for each gene in the pathway but are separately defined in Table 1. Genes with circular outlines and white color are not associated with CREs in our assay but are included to inform about relevant interactions.

References

    1. Allen BL, Taatjes DJ. 2015. The mediator complex: A central integrator of transcription. Nat Rev Mol Cell Biol. 16:155–166. - PMC - PubMed
    1. Babarinde IA, Saitou N. 2013. Heterogeneous tempo and mode of conserved noncoding sequence evolution among four mammalian orders. Genome Biol Evol. 5:2330–2343. - PMC - PubMed
    1. Babarinde IA, Saitou N. 2016. Genomic locations of conserved noncoding sequences and their proximal protein-coding genes in mammalian expression dynamics. Mol Biol Evol. 33:1807–1817. - PubMed
    1. Boyd JL, et al. . 2015. Human-chimpanzee differences in a fzd8 enhancer alter cell-cycle dynamics in the developing neocortex. Curr Biol. 25:772–779. - PMC - PubMed
    1. Boyle EA, Li YI, Pritchard JK. 2017. An expanded view of complex traits: From polygenic to omnigenic. Cell 169:1177–1186. - PMC - PubMed

Publication types