. 2022 Oct;92(4):532-544.
doi: 10.1002/ana.26456. Epub 2022 Aug 9.

Intact HIV Proviruses Persist in the Brain Despite Viral Suppression with ART

Affiliations

Intact HIV Proviruses Persist in the Brain Despite Viral Suppression with ART

Catherine R Cochrane et al. Ann Neurol. 2022 Oct.

Abstract

Objective: Human immunodeficiency virus (HIV) persistence in blood and tissue reservoirs, including the brain, is a major barrier to HIV cure and possible cause of comorbid disease. However, the size and replication competent nature of the central nervous system (CNS) reservoir is unclear. Here, we used the intact proviral DNA assay (IPDA) to provide the first quantitative assessment of the intact and defective HIV reservoir in the brain of people with HIV (PWH).

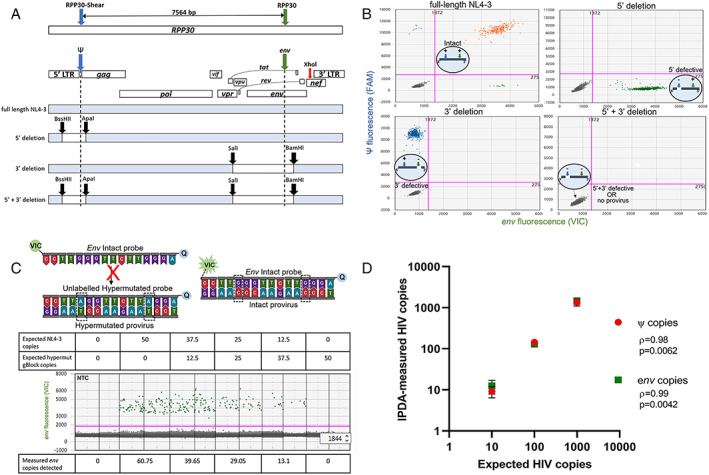
Methods: Total, intact, and defective HIV proviruses were measured in autopsy frontal lobe tissue from viremic (n = 18) or virologically suppressed (n = 12) PWH. Total or intact/defective proviruses were measured by detection of HIV pol or the IPDA, respectively, through use of droplet digital polymerase chain reaction (ddPCR). HIV-seronegative individuals were included as controls (n = 6).

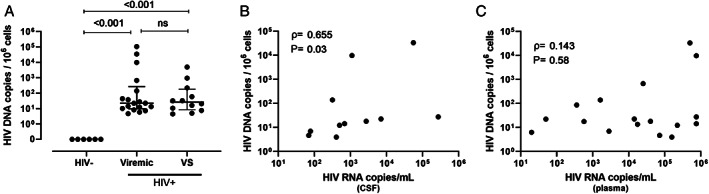
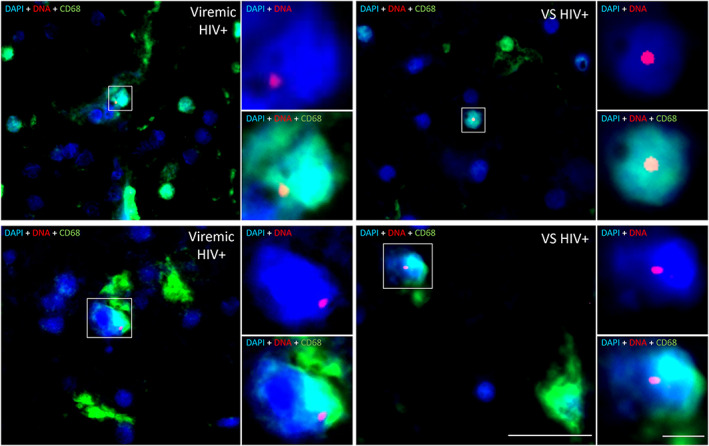
Results: Total HIV DNA was present at similar levels in brain tissues from untreated viremic and antiretroviral (ART)-suppressed individuals (median = 22.3 vs 26.2 HIV pol copies/106 cells), reflecting a stable CNS reservoir of HIV that persists despite therapy. Furthermore, 8 of 10 viremic and 6 of 9 virally suppressed PWH also harbored intact proviruses in the CNS (4.63 vs 12.7 intact copies/106 cells). Viral reservoirs in CNS and matched lymphoid tissue were similar in the composition of intact and/or defective proviruses, albeit at lower levels in the brain. Importantly, CNS resident CD68+ myeloid cells in virally suppressed individuals harbored HIV DNA, directly showing the presence of a CNS resident HIV reservoir.

Interpretation: Our results demonstrate the first evidence for an intact, potentially replication competent HIV reservoir in the CNS of virally suppressed PWH. ANN NEUROL 2022;92:532-544.


Conflict of interest statement

S.R.L. has received investigator‐initiated grant funding from Gilead, Merck, and ViiV Healthcare. She has provided paid scientific advice to Abivax, Abbvie, and Gilead. P.R.G. previously received investigator‐initiated grant funding from ViiV Healthcare. <zbmrule>

Figures

FIGURE 1
FIGURE 1
HIV DNA persists in the CNS of people with HIV PWH despite long term suppression with ART. (A) HIV pol DNA copy number in human frontal lobe brain tissue from viremic (n = 18) or virally suppressed (n = 12) PWH or HIV‐uninfected individuals (n = 6) as measured by droplet digital PCR. (B) Correlative analysis of HIV pol DNA copy number in human brain tissue relative to HIV RNA copy number in cerebrospinal fluid or (C) plasma in untreated viremic PWH only (n = 18). Median and interquartile ranges shown; comparisons made using Mann–Whitney U tests. Correlative analyses assessed by non‐parametric Pearson's correlations with Pearson's rho and p values shown. The p < 0.05 considered statistically significant. Note: CSF viral load data unavailable for n = 4. ART = antiretroviral; CNS = central nervous system; ns = not significant; PCR = polymerase chain reaction; PWH = people with HIV; VS = virally suppressed.
FIGURE 2
FIGURE 2
Validation of IPDA specificity. (A) Primer binding map for HIV Ψ (blue), HIV env (green) and RPP30 (blue and green arrows; same spacing as the Ψ and env amplicons (7,564 bp) to correct for DNA shearing in a separate multiplex ddPCR). XhoI (red arrow) binding site for gDNA digestion for the IPDA is shown. Maps of NL4‐3 plasmid controls including restriction enzyme cut sites (black arrow): (i) full‐length NL4‐3, (ii) 5′ deletion, (iii) 3′ deletion, or (iv) 5′ + 3′ deletion. (B) Representative IPDA 2D‐amplitude plots using 1,000 DNA copies of NL4‐3 plasmid controls shown in A assayed on a background of PBMC gDNA from HIV seronegative donor. Intact (HIV Ψ + and env+; orange), 5′ deleted (HIV env + only; green), 3′ deleted (HIV Ψ + only, blue), and 5′ + 3′ deleted NL4‐3 plasmid controls (HIV ψ‐ and env‐; grey). Bottom left quadrants also represents droplets with no provirus. (C) Map of env probes specific for the RRE region consisting of 2 adjacent G‐>A APOBEC3G sites (dashed boxes). An unlabeled hypermutated competitor probe preferentially binds to hypermutated proviruses, preventing the binding of the VIC‐labelled intact probe, which only hybridizes to intact proviruses to release fluorescent signal away from 3′ minor‐groove binder quencher (Q). Specificity of the env probes was validated using varying copies of HIV NL4‐3 spiked with a synthetic gBlock fragment of a hypermutated env sequence (average env copies from n = 3 experiments shown). (D) Correlative analysis of expected and IPDA‐measured frequencies of ψ and env copies of HIV. The gDNA from PBMCs of HIV seronegative donors was spiked with cell equivalent concentrations of ACH‐2 cells and subjected to the IPDA. Nonparametric Pearson's rho and significant p values (p < 0.05) shown. There were 3 experiments performed. ddPCR = droplet digital polymerase chain reaction; IPDA = intact proviral DNA assay; NNTC = National NeuroAIDS Tissue Consortium; PBMC = peripheral blood mononuclear cell; RRE = Rev response element.
FIGURE 3
FIGURE 3
Intact proviral genomes persist in the CNS despite long term viral suppression as measured by the IPDA. (A) The DSI was determined in brain (n = 27) or lymphoid (n = 7) tissue by duplex ddPCR for two regions of the RPP30 gene and represents the fraction of gDNA that has been sheared between the amplicons. Median and interquartile range shown. (B) Representative 2D‐amplitude ddPCR plot of proviruses in brain tissue from a virally suppressed PWH. (C) Copy number (standardized to 106 cells) or (D) frequency of proviral genomes defined as intact (HIV ψ + and env +; orange), 3′ defective (ψ +; blue) or 5′ defective (env +, green) from CNS frontal lobe tissue from viremic (n = 10), or virally suppressed (VS; n = 9) PWH or HIV‐uninfected individuals (n = 6) as measured by the IPDA. Median and interquartile ranges shown. (E) Correlative analysis of HIV pol DNA and intact, (F) 3′ defective or (G) 5′ defective proviruses in frontal lobe brain tissue from PWH. Nonparametric Pearson's rho and p values shown. p values <0.05 considered statistically significant. CNS = central nervous system; ddPCR = droplet digital polymerase chain reaction; DSI = droplet shearing index; IPDA = intact proviral DNA assay; PWH = people with HIV.
FIGURE 4
FIGURE 4
CNS reservoir size relative to lymphoid reservoirs in PWH. (A) Copy number (standardized to 106 cells) or (B) frequency of proviral genomes measured by the IPDA from CNS frontal lobe tissue and matched lymphoid tissue (the spleen, lymph node, or gut) from viremic (n = 3, closed symbols) or virally suppressed PWH (n = 2, open symbols), where proviruses are defined as intact (ψ+ and env +; orange), 3′ defective (ψ +; blue), or 5′ defective (env +, green). Median and interquartile ranges shown; comparisons made using paired Wilcoxon tests, p < 0.05 statistically significant. CNS = central nervous system; IPDA = intact proviral DNA assay; PWH = people with HIV.
FIGURE 5
FIGURE 5
CNS resident myeloid cells in virally suppressed PWH harbour HIV DNA. Representative images of HIV DNA+ CD68+ myeloid cells in frontal brain tissue from virally suppressed (VS HIV+; n = 2) or viremic PWH (n = 2) as determined by in situ hybridization for HIV DNA. HIV DNA (red), CD68 (green), or nuclei (blue) shown. Images acquired on a PALM Robo 4.2 at × 63 magnification. HIV DNA myeloid cells identified by white boxes. HIV DNA+DAPI+ and HIV DNA+CD68+DAPI+ insets of colocalization shown. Scale bars = 20 μm (×63 image) and 5 μm (×3.5 digital zoom ‐ insets). CNS = central nervous system; PWH = people with HIV; VS = virally suppressed.
FIGURE 6
FIGURE 6
T cells infiltrating the CNS are not predictive of HIV DNA levels in the brain. (A) Correlative analysis of frequency of infiltrating CD3+ T cells (as measured by immunohistochemistry) and HIV pol DNA levels (as determined by droplet digital PCR) in frontal brain tissue from virally suppressed (n = 10) or viremic PWH (n = 10; groups combined are shown; n = 20). (B) Correlative analysis of relative expression of TCR mRNA and HIV pol DNA levels from fresh frozen human brain of PWH (n = 11). Parameters log transformed and spearman rho and p value shown. p < 0.05 considered statistically significant. CNS = central nervous system; PCR = polymerase chain reaction; PWH = people with HIV; TCR = T cell receptor.
FIGURE 7
FIGURE 7
HIV V3 protein sequences derived from CD68+ myeloid cells isolated from brain tissue of VS or viremic PWH. The nuclei of CD68+ myeloid cells (labelled by immunohistochemistry) were isolated from FFPE brain tissue from viremic (n = 2) or VS PWH (vs; n = 5) by laser capture microdissection prior to lysis, PCR, and sequence analysis. Two sequences per patient shown. Changes in amino acids relative to HIV laboratory strain NL4.3 shown. FFPE = formalin‐fixed paraffin embedded; PCR = polymerase chain reaction; PWH = people with HIV; VS = virally suppressed

References

    1. Estes JD, Kityo C, Ssali F, et al. Defining total‐body AIDS‐virus burden with implications for curative strategies. Nat Med 2017;23:1271–1276. - PMC - PubMed
    1. Valcour V, Chalermchai T, Sailasuta N, et al. Central nervous system viral invasion and inflammation during acute HIV infection. J Infect Dis 2012;206:275–282. - PMC - PubMed
    1. Churchill MJ, Gorry PR, Cowley D, et al. Use of laser capture microdissection to detect integrated HIV‐1 DNA in macrophages and astrocytes from autopsy brain tissues. J Neurovirol 2006;12:146–152. - PubMed
    1. Ko A, Kang G, Hattler JB, et al. Macrophages but not Astrocytes Harbor HIV DNA in the brains of HIV‐1‐infected Aviremic individuals on suppressive antiretroviral therapy. J Neuroimmune Pharmacol 2019;14:110–119. - PMC - PubMed
    1. Thompson KA, Cherry CL, Bell JE, McLean CA. Brain cell reservoirs of latent virus in presymptomatic HIV‐infected individuals. Am J Pathol 2011;179:1623–1629. - PMC - PubMed

Publication types