

Comparison of Accelerometry-Based Measures of Physical Activity: Retrospective Observational Data Analysis Study
- PMID: 35867392
- PMCID: PMC9356340
- DOI: 10.2196/38077
Comparison of Accelerometry-Based Measures of Physical Activity: Retrospective Observational Data Analysis Study
Abstract
Background: Given the evolution of processing and analysis methods for accelerometry data over the past decade, it is important to understand how newer summary measures of physical activity compare with established measures.
Objective: We aimed to compare objective measures of physical activity to increase the generalizability and translation of findings of studies that use accelerometry-based data.
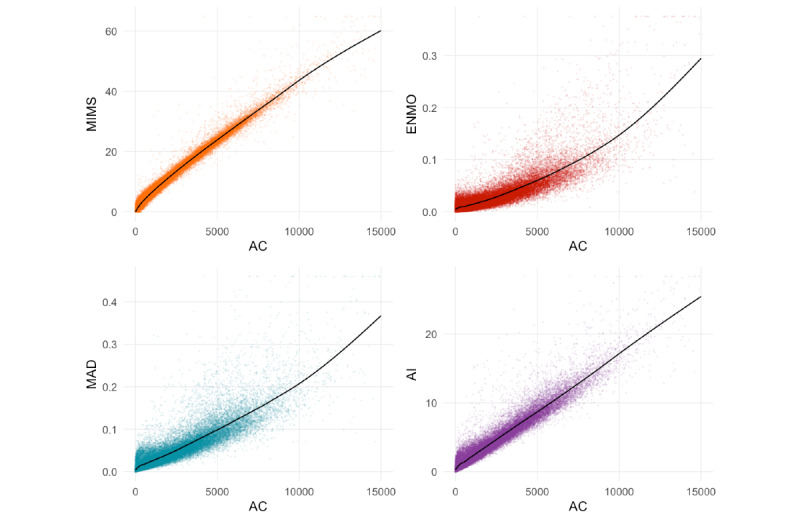
Methods: High-resolution accelerometry data from the Baltimore Longitudinal Study on Aging were retrospectively analyzed. Data from 655 participants who used a wrist-worn ActiGraph GT9X device continuously for a week were summarized at the minute level as ActiGraph activity count, monitor-independent movement summary, Euclidean norm minus one, mean amplitude deviation, and activity intensity. We calculated these measures using open-source packages in R. Pearson correlations between activity count and each measure were quantified both marginally and conditionally on age, sex, and BMI. Each measures pair was harmonized using nonparametric regression of minute-level data.
Results: Data were from a sample (N=655; male: n=298, 45.5%; female: n=357, 54.5%) with a mean age of 69.8 years (SD 14.2) and mean BMI of 27.3 kg/m2 (SD 5.0). The mean marginal participant-specific correlations between activity count and monitor-independent movement summary, Euclidean norm minus one, mean amplitude deviation, and activity were r=0.988 (SE 0.0002324), r=0.867 (SE 0.001841), r=0.913 (SE 0.00132), and r=0.970 (SE 0.0006868), respectively. After harmonization, mean absolute percentage errors of predicting total activity count from monitor-independent movement summary, Euclidean norm minus one, mean amplitude deviation, and activity intensity were 2.5, 14.3, 11.3, and 6.3, respectively. The accuracies for predicting sedentary minutes for an activity count cut-off of 1853 using monitor-independent movement summary, Euclidean norm minus one, mean amplitude deviation, and activity intensity were 0.981, 0.928, 0.904, and 0.960, respectively. An R software package called SummarizedActigraphy, with a unified interface for computation of the measures from raw accelerometry data, was developed and published.
Conclusions: The findings from this comparison of accelerometry-based measures of physical activity can be used by researchers and facilitate the extension of knowledge from existing literature by demonstrating the high correlation between activity count and monitor-independent movement summary (and other measures) and by providing harmonization mapping.
Keywords: MIMS; accelerometry; actigraphy; activity counts; aging; digital health; health monitoring; health technology; monitor-independent movement summary; older adult population; physical activity; wearable computing; wearable device; wearable technology.
©Marta Karas, John Muschelli, Andrew Leroux, Jacek K Urbanek, Amal A Wanigatunga, Jiawei Bai, Ciprian M Crainiceanu, Jennifer A Schrack. Originally published in JMIR mHealth and uHealth (https://mhealth.jmir.org), 22.07.2022.
Conflict of interest statement
Conflicts of Interest: CMC is a consultant for Bayer and Johnson and Johnson. Both these consulting contracts have been disclosed through the Johns Hopkins University Edisclose system. The current manuscript is not related to or influenced by any of these contracts.
Figures
References
-
- Karas M, Bai J, Strączkiewicz M, Harezlak J, Glynn NW, Harris T, Zipunnikov V, Crainiceanu C, Urbanek JK. Accelerometry data in health research: challenges and opportunities. Stat Biosci. 2019 Jul;11(2):210–237. doi: 10.1007/s12561-018-9227-2. http://europepmc.org/abstract/MED/31762829 - DOI - PMC - PubMed
-
- Kuo P, Schrack JA, Shardell MD, Levine M, Moore AZ, An Y, Elango P, Karikkineth A, Tanaka T, de Cabo R, Zukley LM, AlGhatrif M, Chia CW, Simonsick EM, Egan JM, Resnick SM, Ferrucci L. A roadmap to build a phenotypic metric of ageing: insights from the Baltimore Longitudinal Study of Aging. J Intern Med. 2020 Apr;287(4):373–394. doi: 10.1111/joim.13024. doi: 10.1111/joim.13024. - DOI - DOI - PMC - PubMed
-
- Neishabouri A, Nguyen J, Samuelsson J, Guthrie T, Biggs M, Wyatt J, Cross D, Karas M, Migueles JH, Khan S, Guo CC. Quantification of acceleration as activity counts in ActiGraph wearables. Research Square. doi: 10.21203/rs.3.rs-1370418/v1. Preprint posted online on February 22, 2022. - DOI - PMC - PubMed
-
- Troiano Richard P, McClain James J, Brychta Robert J, Chen Kong Y. Evolution of accelerometer methods for physical activity research. Br J Sports Med. 2014 Jul;48(13):1019–23. doi: 10.1136/bjsports-2014-093546. http://europepmc.org/abstract/MED/24782483 bjsports-2014-093546 - DOI - PMC - PubMed
Publication types
MeSH terms
Grants and funding
LinkOut - more resources
Full Text Sources
Medical
Miscellaneous
