. 2022 Aug 10;96(15):e0071822.
doi: 10.1128/jvi.00718-22. Epub 2022 Jul 18.

Conserved Lysine Residues of Hepatitis B Virus Core Protein Are Not Required for Covalently Closed Circular DNA Formation

Affiliations

Conserved Lysine Residues of Hepatitis B Virus Core Protein Are Not Required for Covalently Closed Circular DNA Formation

Xupeng Hong et al. J Virol. .

Abstract

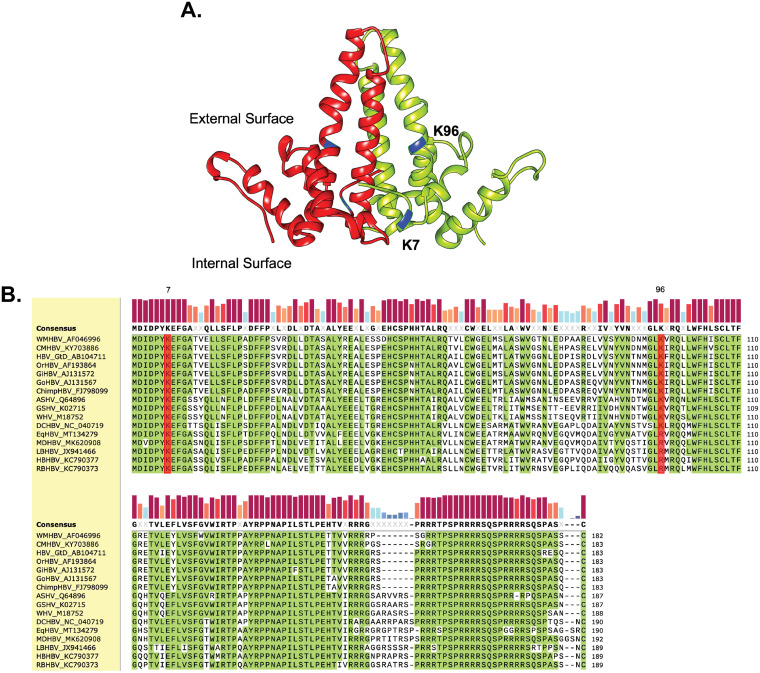
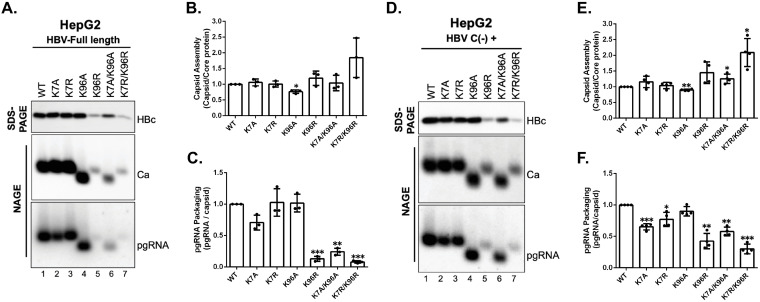
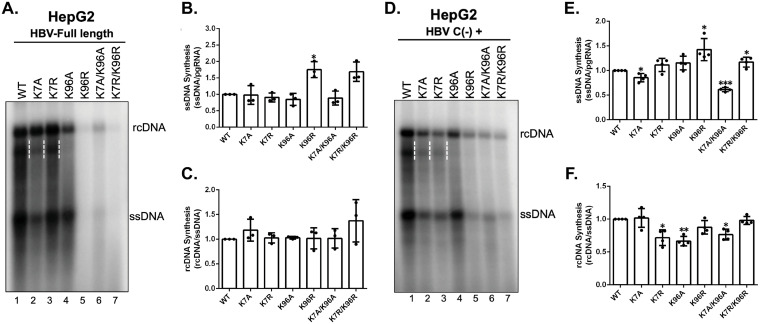
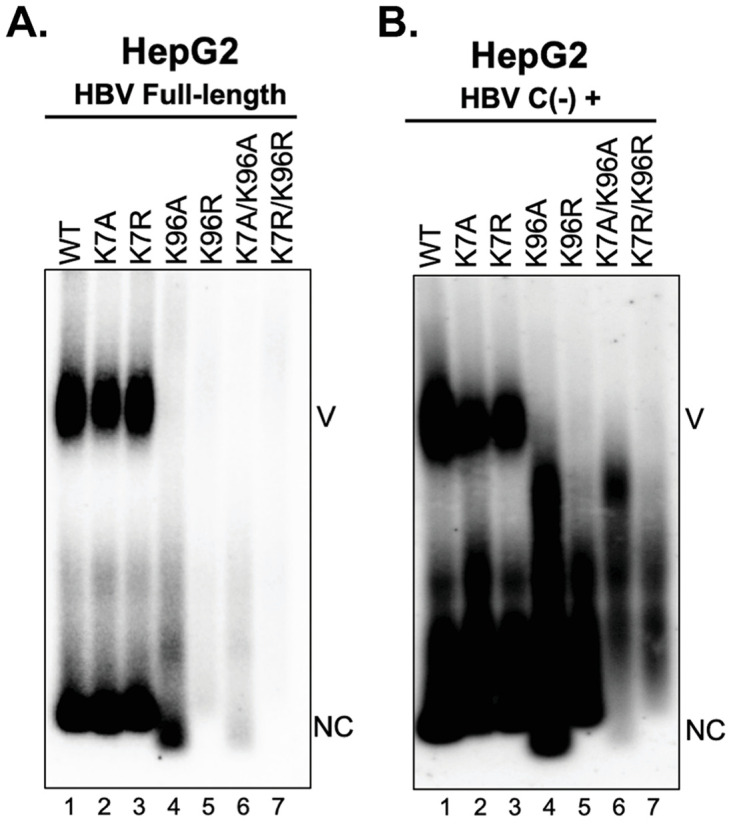
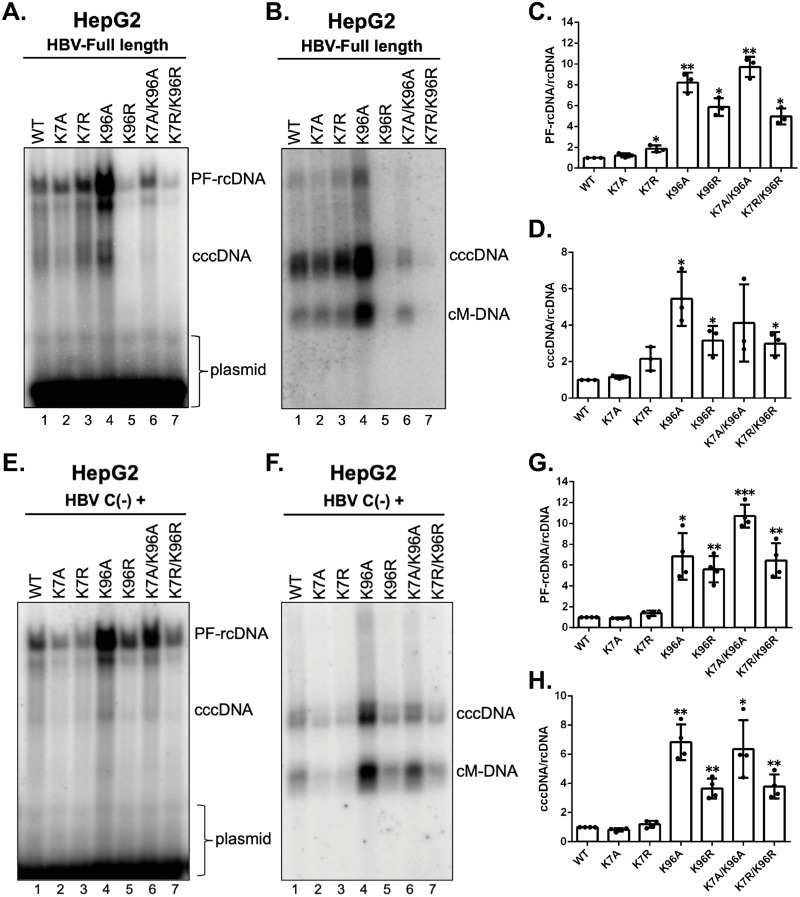
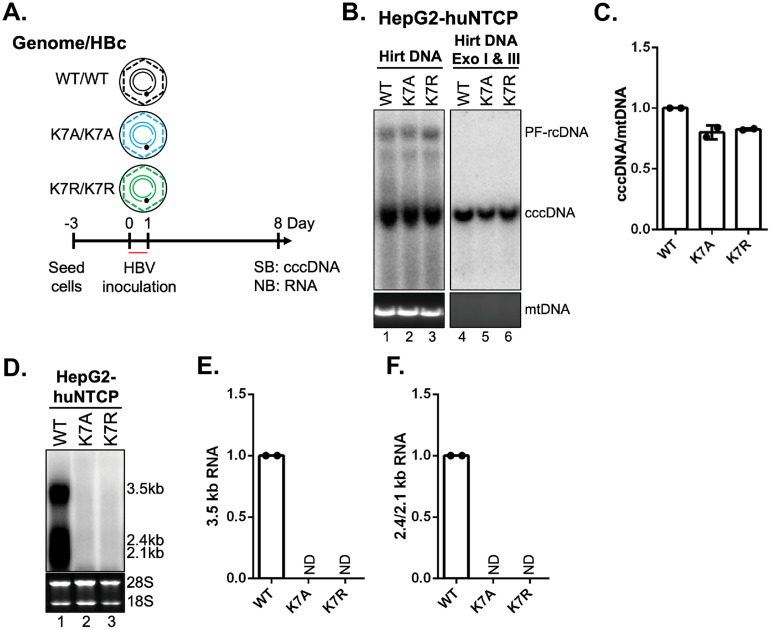
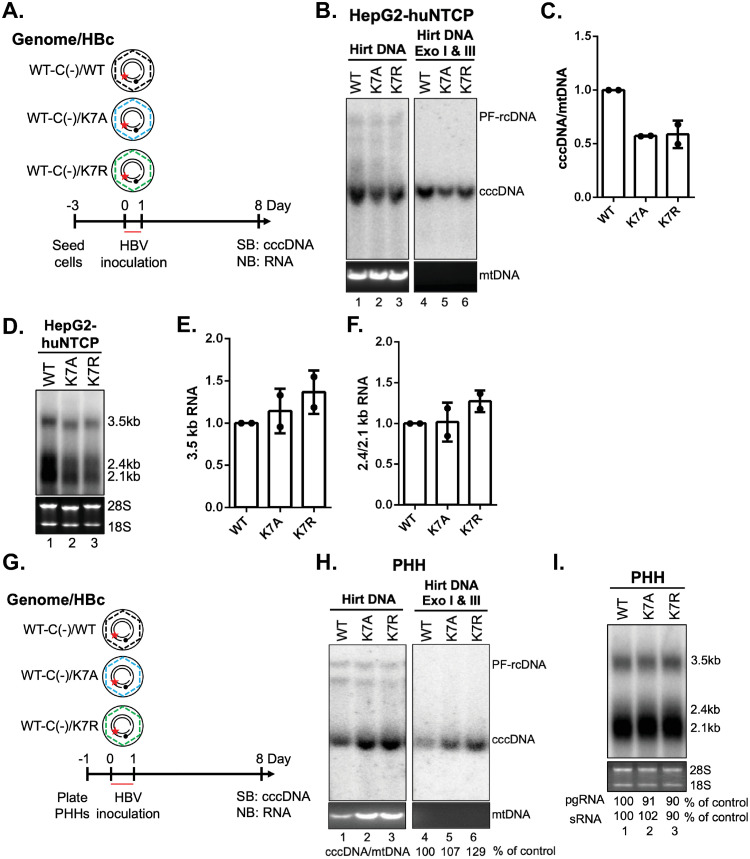
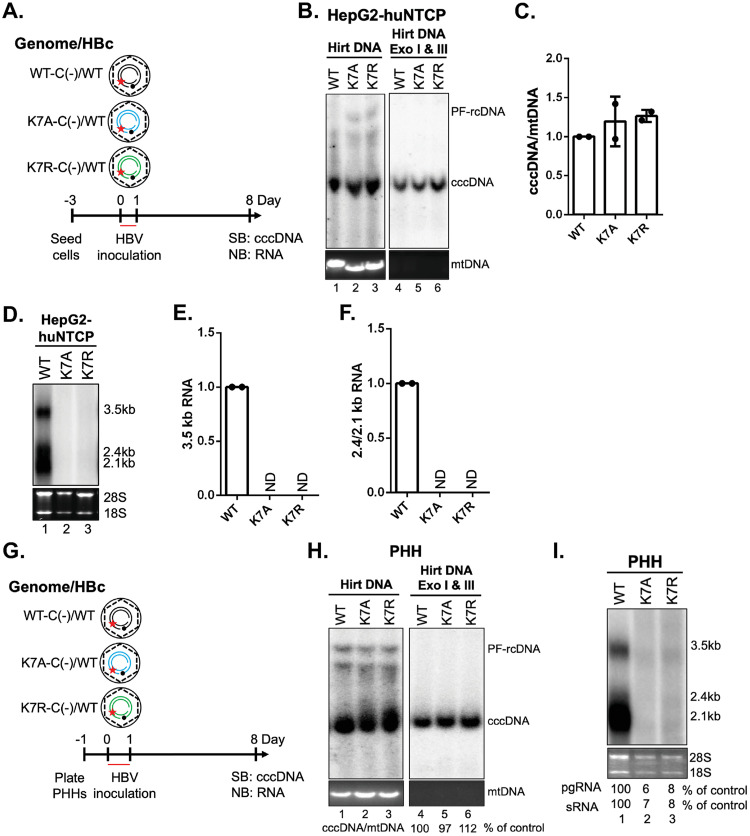
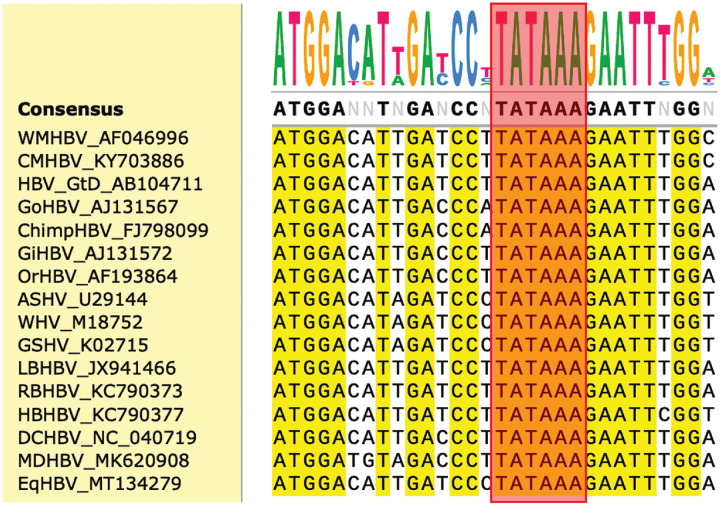
Hepatitis B virus (HBV) core protein (HBc), the building block of the viral capsid, plays a critical role throughout the HBV life cycle. There are two highly conserved lysine residues, namely, K7 and K96, on HBc, which have been proposed to function at various stages of viral replication, potentially through lysine-specific posttranslational modifications (PTMs). Here, we substituted K7 and K96 with alanine or arginine, which would also block potential PTMs on these two lysine residues, and tested the effects of these substitutions on HBV replication and infection. We found that the two lysine residues were dispensable for all intracellular steps of HBV replication. In particular, all mutants were competent to form the covalently closed circular DNA (cccDNA) via the intracellular amplification pathway, indicating that K7 and K96, or any PTMs of these residues, were not essential for nucleocapsid uncoating, a prerequisite for cccDNA formation. Furthermore, we found that K7A and K7R mutations did not affect de novo cccDNA formation and RNA transcription during infection, indicating that K7 or any PTMs of this residue were dispensable for HBV infection. In addition, we demonstrated that the HBc K7 coding sequence (AAA), as part of the HBV polyadenylation signal UAUAAA, was indispensable for viral RNA production, implicating this cis requirement at the RNA level, instead of any function of HBc-K7, likely constrains the identity of the 7th residue of HBc. In conclusion, our results provided novel insights regarding the roles of lysine residues on HBc, and their coding sequences, in the HBV life cycle. IMPORTANCE Hepatitis B virus (HBV) infection remains a public health burden that affects 296 million individuals worldwide. HBV core protein (HBc) is involved in almost all steps in the HBV life cycle. There are two conserved lysine residues on HBc. Here, we found that neither of them is essential for HBV intracellular replication, including the formation of covalently closed circular DNA (cccDNA), the molecular basis for establishing and sustaining the HBV infection. However, K96 is critical for virion morphogenesis, while the K7 coding sequence, but not HBc-K7 itself, is indispensable, as part of the RNA polyadenylation signal, for HBV RNA production from cccDNA. Our results provide novel insights regarding the role of the conserved lysine residues on HBc, and their coding sequences, in viral replication, and should facilitate the development of antiviral drugs against the HBV capsid protein.

Keywords: capsid; cccDNA; core; hepatitis B virus; infection; lysine; polyadenylation; posttranslational modification; replication; transcription.


Conflict of interest statement

The authors declare no conflict of interest.

Figures

FIG 1
FIG 1
K7 and K96 are highly conserved in orthohepadnaviral core proteins. (A) Localization of K7 and K96, highlighted in blue, on the HBc dimer three-dimensional (3D) structure (PDB 1QGT). (B) Amino acid sequence alignment of the orthohepadnaviruses core proteins. The invariant K7 and the highly conserved K96 residues are highlighted in the red boxes. Other residues conserved across at least 50% of all hepadnaviral core proteins are highlighted in green. Numberings start from the first methionine of the core ORF.
FIG 2
FIG 2
Effects of HBc K7 and K96 mutations on HBc expression, capsid assembly, and pgRNA packaging. The full-length HBV replicon construct expressing the HBc K7A, K7R, K96A, K96R, K7A/K96A, or K7R/K96R mutant was transfected into HepG2 cells (i.e., single transfection) (A to C). (A) Levels of HBc proteins (top) were measured by Western blotting using the T2221 anti-HBc NTD MAb after SDS-PAGE of cytoplasmic lysates from the transfected cells. The assembled capsids (middle) and packaged pgRNA (bottom) were detected by the MAb T2221 and the anti-sense HBV RNA probe, respectively, following resolution of cytoplasmic lysates from the transfected cells by native agarose gel electrophoresis (NAGE) and transfer to nitrocellulose membrane. Capsid assembly efficiency (B) was determined by normalizing the levels of capsids to those of total HBc protein, and pgRNA packaging efficiency (C) was determined by normalizing the levels of pgRNA to those of capsids, with the efficiencies of WT set to 1.0. In addition, the WT or the indicated mutant HBc expression construct was cotransfected together with the HBV replicon defective in HBc expression [HBV-C(−)] into HepG2 cells (i.e., trans-complementation assay) (D to F). (D) Levels of HBc proteins (top), the assembled capsid (middle), and packaged pgRNA (bottom) were measured as in A. Capsid assembly efficiency (E) and pgRNA packaging efficiency (F) were determined as in B and C. Data are shown as the mean ± SD. Two-tailed unpaired Student’s t test was used to compare the difference of each data set versus WT (*, P < 0.05; **, P < 0.01; ***, P < 0.001). Ca, capsid; pgRNA, pregenomic RNA; HBc, HBV core protein.
FIG 3
FIG 3
Effects of HBc K7 and K96 mutations on HBV reverse transcription. (A) HBV core DNA was released from the cytoplasmic lysate of WT or mutant full-length HBV replicon-transfected HepG2 cells (i.e., single transfection) by SDS-proteinase K treatment and detected by Southern blotting. The ssDNA synthesis efficiency (B) was determined by normalizing the levels of ssDNA to those of pgRNA in Fig. 2A, and the rcDNA synthesis efficiency (C) was determined by normalizing the levels of rcDNA to those of ssDNA, with the efficiencies of WT set to 1.0. Similarly, the core DNA from the cotransfected HepG2 cells in the trans-complementation assay (as in Fig. 2D) was analyzed (D). The ssDNA synthesis efficiency (E) was determined by normalizing the levels of ssDNA to those of pgRNA in Fig. 2D, and the rcDNA synthesis efficiency (F) was determined by normalizing the levels of rcDNA to those of ssDNA, with the efficiencies of WT set to 1.0. Data are shown as the mean ± SD. Two-tailed unpaired Student's t test was used to compare the difference of each data set versus WT (*, P < 0.05; **, P < 0.01; ***, P < 0.001). ssDNA, single-strand DNA; rcDNA, relaxed circular DNA. White vertical bars denote the partially double-stranded DNA species migrating just below the rcDNA band and contained in intracellular virions (see the text for details).
FIG 4
FIG 4
Effects of HBc K7 and K96 mutations on HBV virion secretion. Culture supernatant from HepG2 cells transfected with the single HBV replicon (A) or cotransfected in the trans-complementation assay (B) was harvested at day 5 posttransfection, concentrated (by 50×), resolved by agarose gel electrophoresis, and transferred to nitrocellulose membrane. HBV DNA in virions was detected by a 32P-dGTP-labeled HBV DNA probe. V, virion; NC, nucleocapsid.
FIG 5
FIG 5
Effects of HBc K7 and K96 mutations on cccDNA formation via intracellular amplification. HBV PF-DNA from HepG2 cells following the single replicon transfection (A to D) or cotransfection in the trans-complementation assay (E to H) was isolated by the Hirt extraction method and detected by Southern blotting. The extracted DNA was treated with Dpn I (A, E) to digest plasmid DNA or Dpn I plus Exo I and III (B, F) to remove all DNA with free 3′ ends. The PF-rcDNA synthesis efficiency (C, G) was determined by normalizing the levels of PF-rcDNA to those of rcDNA in Fig. 3A (for single transfection) or Fig. 3D (for cotransfection), and cccDNA formation efficiency (D, H) was determined by normalizing the levels of cccDNA to those of rcDNA in Fig. 3A (for single transfection) or Fig. 3D (for cotransfection), with the efficiencies of WT HBc set to 1.0. Data are shown as the mean ± SD. Two-tailed unpaired Student’s t test was used to compare the difference of each data set versus WT (*, P < 0.05; **, P < 0.01; ***, P < 0.001). cccDNA, covalently closed circular DNA; cM-DNA, closed minus strand DNA, derived from cM-rcDNA after Exo I and III digestion (39).
FIG 6
FIG 6
Effects of the HBc K7 mutations carried on both the HBc protein and the genome on cccDNA formation and RNA production during infection. (A) The scheme of HBV infection assay. HepG2-huNTCP cells were seeded 3 days prior to the infection. At day 0, when the cells reached confluence, they were infected with WT, K7A, or K7R mutant virus that was prepared from the single replicon-transfected HepG2 cells. The K7A and K7R mutant virus carried the respective mutation on both the capsid and the genome, as depicted in the virion diagrams (blue or green color on the rcDNA genome as well as the capsid). At day 8 postinfection, the infected cells were harvested for analysis of HBV cccDNA and RNA. (B) PF-DNA was isolated by the Hirt extraction method and analyzed by Southern blotting, without (lanes 1 to 3) or with pretreatment by Exo I and III (lanes 4 to 6). Mitochondrial DNA (mtDNA) was used as the loading control (lane 1 to 3, bottom), which was eliminated by Exo I and III as anticipated (lanes 4 to 6, bottom). (C) The efficiency of cccDNA formation during de novo infection were determined by normalizing the levels of cccDNA to those of mtDNA, with that of the WT set to 1.0. (D) Total RNA (15 μg) extracted from the infected HepG2-huNTCP cells was analyzed by Northern blotting assay to detect HBV RNAs (top). Ribosomal RNAs (18S and 28S) served as the loading control (bottom). The levels of the HBV 3.5-kb pgRNA (E) and 2.4/2.1-kb surface RNA (F) were normalized to those of the ribosomal RNAs and cccDNA, with those from the WT set to 1.0. ND, not detected.
FIG 7
FIG 7
Effects of the HBc K7 mutations carried only on the capsid on cccDNA formation and RNA production during infection. (A to F) Infection of HepG2-huNTCP cells. (A) The scheme of the HBV infection assay in HepG2-huNTCP cells was similar to that in Fig. 6, except that the K7A or K7R mutant virus carried the mutation only on the capsid (blue or green) but not on the rcDNA genome. All three viruses, namely, WT, K7A, and K7R, contained a stop codon mutation in the core gene on the rcDNA genome (red stars). The WT or mutant virus was prepared using the trans-complementation assay whereby the WT or mutant HBc expression construct was cotransfected together with the HBc-defective (otherwise WT) replicon into HepG2 cells. (B) PF-DNA extracted from infected cells at 8 dpi was analyzed by Southern blotting, as in Fig. 6B. (C) The cccDNA quantification was done as described in Fig. 6. (D) Total RNA from infected HepG2-huNTCP cells was extracted and analyzed by Northern blotting for HBV RNA, as in Fig. 6. Quantification of 3.5-kb pgRNA (E) and 2.4/2.1-kb sRNA (F) was also done as in Fig. 6. (G to I) Infection of PHHs. (G) The scheme of an HBV infection assay in PHHs. PHHs were plated 1 day prior to infection and infected with WT, K7A, or K7R mutant virus (the mutation only on the capsid but not on the genome), as in A for Hepg2-huNTCP cells. (H) HBV cccDNA from the infected PHHs was analyzed as in Fig. 6B, and levels of cccDNA are indicated at the bottom as a percentage of WT. (I) One microgram of total RNA from infected PHHs was analyzed by Northern blotting for HBV RNAs (top). Ribosomal RNAs served as the loading control (bottom). The levels of 3.5-kb pgRNA and 2.4/2.1-kb surface RNA (sRNA) are indicated as a percentage of WT.
FIG 8
FIG 8
Effects of the HBc K7 mutations carried only on the rcDNA genome on cccDNA formation and RNA production during infection. (A to F) Infection of HepG2-huNTCP cells. (A) The scheme of an HBV infection assay in HepG2-huNTCP cells, which is similar to that in Fig. 6 and 7, except that the K7A or K7R mutant virus carried the mutation only on the rcDNA genome (denoted by the blue or green color). The genome in the WT or the mutant viruses also harbored the core stop mutation (red stars). All viruses contained the WT capsid. These viruses were prepared by trans-complementation of the WT or HBc K7 mutant replicon (all defective in HBc expression) with the WT HBc expression construct in HepG2 cells. (B) PF-DNA was analyzed by Southern blotting, as in Fig. 6B. (C) The level of cccDNA formation during de novo infection was determined as in Fig. 6C. (D) HBV RNAs from the infected cells were analyzed by Northern blotting, as in Fig. 6D. Quantification of 3.5-kb pgRNA (E) and 2.4/2.1-kb surface RNA (sRNA) (F) was done as described in Fig. 6. (G to I) Infection of PHHs. (G) The scheme of an HBV infection assay in PHHs, which was the same as that in Fig. 7G except that the inocula were the same as that used in Fig. 8A. (H) HBV cccDNA from the infected PHHs was analyzed as in Fig. 6B, and the levels of cccDNA are indicated at the bottom as a percentage of WT. (I) One microgram of total RNA from infected PHHs was analyzed by Northern blotting for HBV RNAs (top). The levels of 3.5-kb pgRNA and 2.4/2.1-kb surface RNA (sRNA) are indicated as a percentage of WT.
FIG 9
FIG 9
The HBc K7 coding sequence (AAA) is part of the invariant polyadenylation signal across orthohepadnaviruses. Nucleotide sequence alignment of the first 10 codons of the orthohepadnaviruses core gene. UAUAAA, the noncanonical HBV polyadenylation signal, is highlighted by the red box. Other conserved nucleotides within the first 10 codons of the core gene across all known orthohepadnaviruses are highlighted in yellow.

Similar articles

Cited by

References

    1. Hu J, Seeger C. 2015. Hepadnavirus genome replication and persistence. Cold Spring Harb Perspect Med 5:a021386. 10.1101/cshperspect.a021386. - DOI - PMC - PubMed
    1. WHO. 2021. Hepatitis B. WHO, Geneva, Switzerland. https://www.who.int/news-room/fact-sheets/detail/hepatitis-b.
    1. Yan H, Zhong G, Xu G, He W, Jing Z, Gao Z, Huang Y, Qi Y, Peng B, Wang H, Fu L, Song M, Chen P, Gao W, Ren B, Sun Y, Cai T, Feng X, Sui J, Li W. 2012. Sodium taurocholate cotransporting polypeptide is a functional receptor for human hepatitis B and D virus. Elife 1:e00049. 10.7554/eLife.00049. - DOI - PMC - PubMed
    1. Hu J, Protzer U, Siddiqui A. 2019. Revisiting hepatitis B virus: challenges of curative therapies. J Virol 93:e01032-19. 10.1128/JVI.01032-19. - DOI - PMC - PubMed
    1. Zlotnick A, Venkatakrishnan B, Tan Z, Lewellyn E, Turner W, Francis S. 2015. Core protein: a pleiotropic keystone in the HBV lifecycle. Antiviral Res 121:82–93. 10.1016/j.antiviral.2015.06.020. - DOI - PMC - PubMed

MeSH terms