. 2022 Jul 27;96(14):e0050522.
doi: 10.1128/jvi.00505-22. Epub 2022 Jul 6.

In Vivo Profiling of Individual Multiciliated Cells during Acute Influenza A Virus Infection

Affiliations

In Vivo Profiling of Individual Multiciliated Cells during Acute Influenza A Virus Infection

Cait E Hamele et al. J Virol. .

Abstract

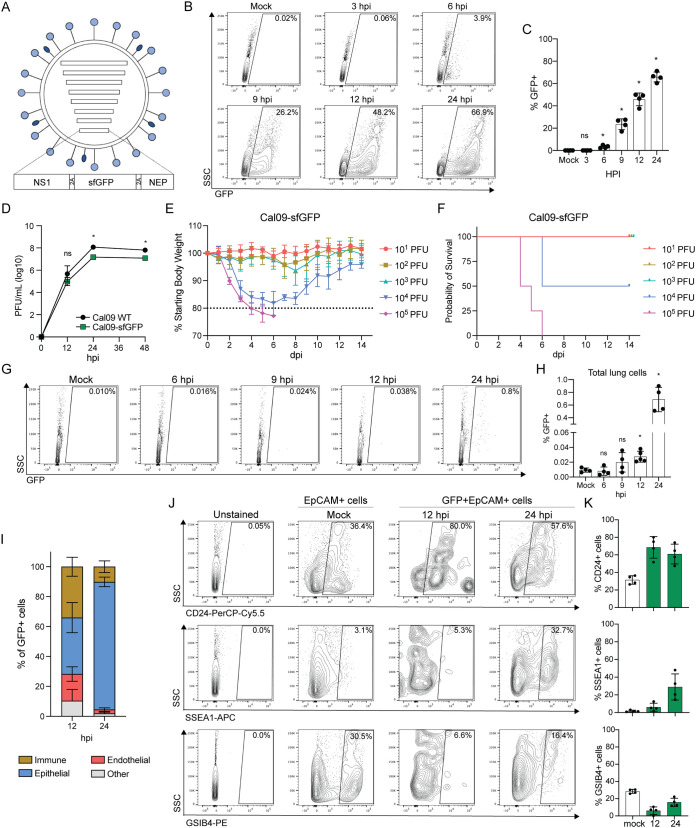
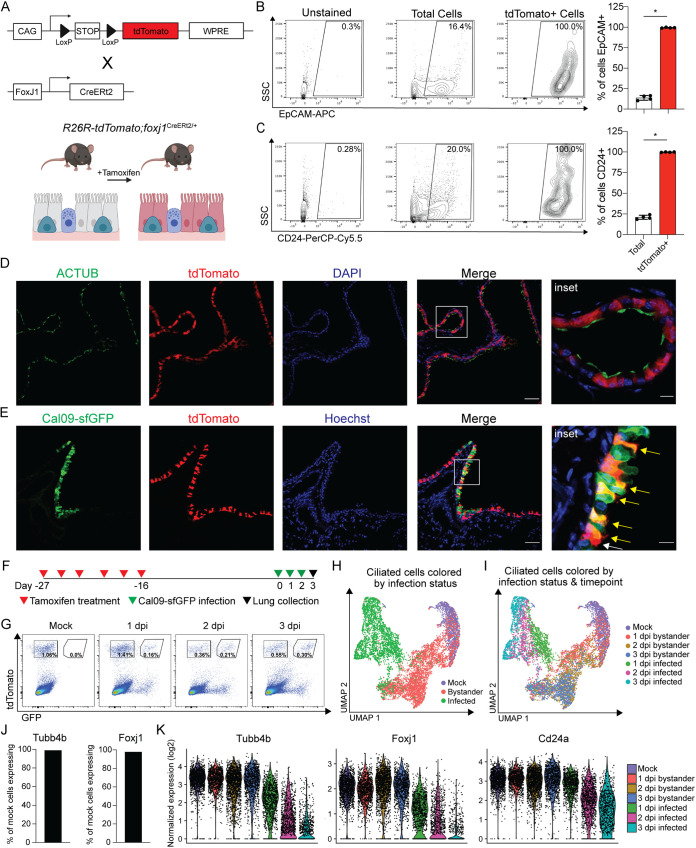
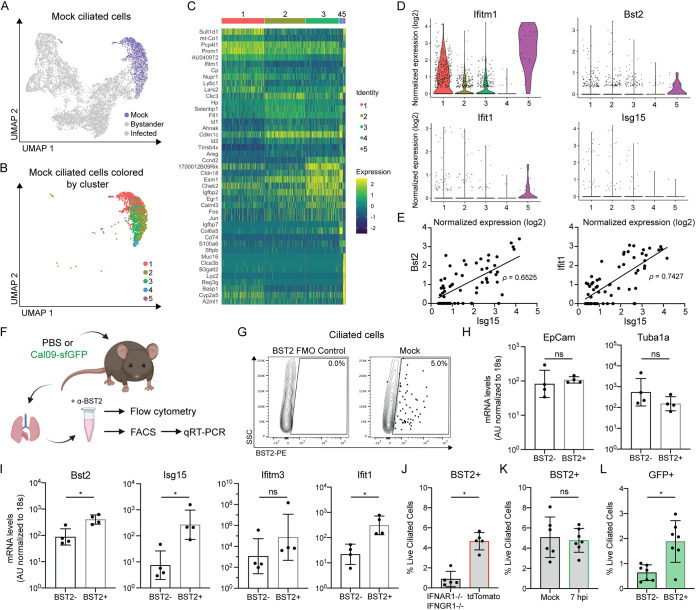
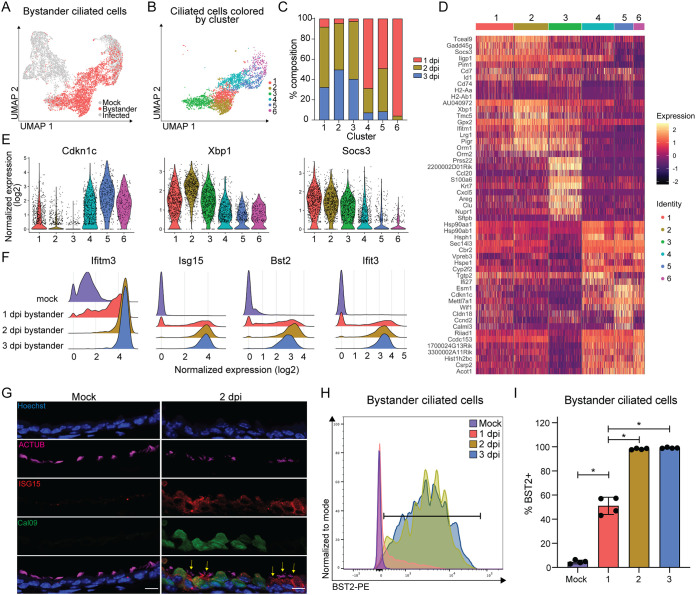
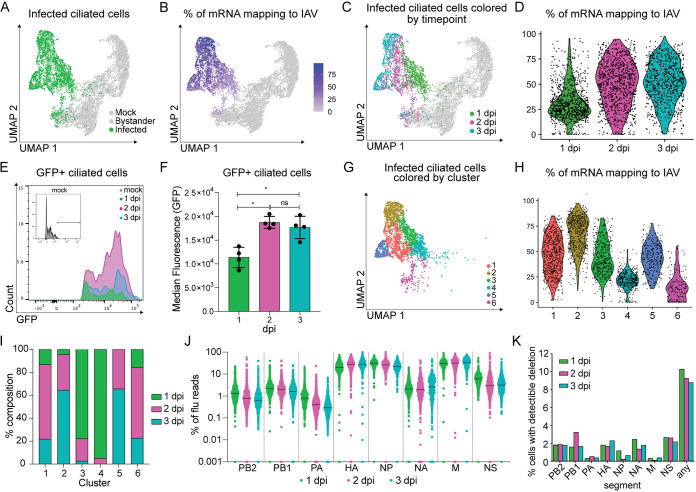
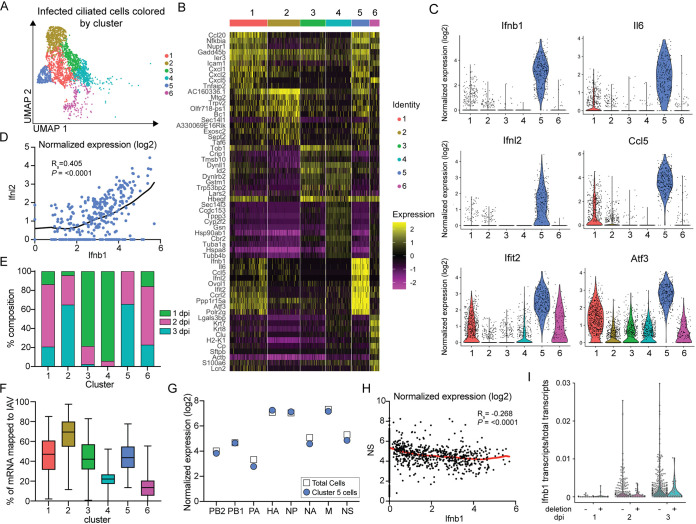
Influenza virus infections are thought to be initiated in a small number of cells; however, the heterogeneity across the cellular responses of the epithelial cells during establishment of disease is incompletely understood. Here, we used an H1N1 influenza virus encoding a fluorescent reporter gene, a cell lineage-labeling transgenic mouse line, and single-cell RNA sequencing to explore the range of responses in a susceptible epithelial cell population during an acute influenza A virus (IAV) infection. Focusing on multiciliated cells, we identified a subpopulation that basally expresses interferon-stimulated genes (ISGs), which we hypothesize may be important for the early response to infection. We subsequently found that a population of infected ciliated cells produce most of the ciliated cell-derived inflammatory cytokines, and nearly all bystander ciliated cells induce a broadly antiviral state. From these data together, we propose that variable preexisting gene expression patterns in the initial cells targeted by the virus may ultimately affect the establishment of viral disease. IMPORTANCE Influenza A virus poses a significant threat to public health, and each year, millions of people in the United States alone are exposed to the virus. We do not currently, however, fully understand why some individuals clear the infection asymptomatically and others become severely ill. Understanding how these divergent phenotypes arise could eventually be leveraged to design therapeutics that prevent severe disease. As a first step toward understanding these different infection states, we used a technology that allowed us to determine how thousands of individual murine lung epithelial cells behaved before and during IAV infection. We found that small subsets of epithelial cells exhibited an antiviral state prior to infection, and similarly, some cells made high levels of inflammatory cytokines during infection. We propose that different ratios of these individual cellular responses may contribute to the broader antiviral state of the lung and may ultimately affect disease severity.

Keywords: RNA sequencing; gene expression; interferon-stimulated genes; reporter virus; single cell; transgenic mouse.


Conflict of interest statement

The authors declare no conflict of interest.

Figures

FIG 1
FIG 1
Ciliated cells are a target of a Cal09 reporter virus in the murine upper respiratory tract. (A) Schematic of A/California/04/2009 reporter virus expressing sfGFP from segment 8, which also encodes nonstructural proteins NS1 and NEP. 2A, porcine teschovirus 2A sequence. (B) Representative flow cytometry of GFP+ cells collected at the indicated time points following infection with Cal09-sfGFP (MDCK cells, MOI = 0.5, single-cycle infection). hpi, hours postinfection. (C) Quantification of flow cytometry in panel B. Means with SDs are shown; n = 4 independent experiments; Mann-Whitney U test. (D) Viral titer after replication in embryonated chicken eggs for the time indicated for wild-type Cal09 or Cal09-sfGFP (1,000 PFU), measured using plaque assays. PFU, plaque-forming units. Means with SDs are shown; n =4 eggs per sample; Mann-Whitney U test. (E) Body weights of mice infected with the indicated doses of Cal09-sfGFP. Means with SDs are shown; n =4 to 6 mice per dose. Dashed line represents humane endpoint. dpi, days postinfection. (F) Kaplan-Meier survival curve of mice infected with the indicated doses of Cal09-sfGFP. n = 4 to 6 mice per dose. (G) Representative flow cytometry of GFP+ cells from the lungs of mice infected with Cal09-sfGFP at the indicated times postinfection. (H) Quantification of flow cytometry in panel G. Means with SDs are shown; n = 4 to 5 mice per time point; Mann-Whitney U test. (I) Quantification of GFP+ cell surface expression of CD45, EpCAM, or CD31. Immune cells, CD45+; epithelial cells, CD45-EpCAM+; endothelial, CD45-CD31+. Cells without expression of either three were categorized as “other.” Cells were isolated from tracheas of Cal09-sfGFP-infected mice at the indicated times postinfection. Means with SDs are shown; n =4 mice per time point. (J) Representative flow cytometry of unstained, EpCAM+ (Mock) or GFP+ EpCAM+ (12 hpi, 24 hpi) cells isolated from the tracheas of mice infected with Cal09-sfGFP at the indicated times postinfection stained for surface expression of CD24 (ciliated cells), SSEA1 (secretory cells), and GSIB4 (basal cells). (K) Quantification of flow cytometry in panel J (EpCAM+ cells, white bars; GFP+ EpCAM+ cells, green bars). Means with SDs are shown; n =4 mice per time point. For all panels, ns, not significant, and *, P ≤ 0.05.
FIG 2
FIG 2
A transgenic mouse model genetically labels ciliated cells for identification during infection. (A) Schematic of transgenic mouse model. Mice containing a Cre-responsive reporter cassette were crossed to mice expressing Cre recombinase under the promoter for the ciliated cell-specific transcription factor Foxj1. When tdT;foxj1 mice are treated with tamoxifen, ciliated cells permanently express tdTomato. WPRE, woodchuck hepatitis virus posttranscriptional regulatory element. (B) Representative flow cytometry and quantification of total and tdTomato+ cell surface EpCAM expression. Cells isolated from the lungs of tamoxifen-treated tdT;foxj1 mice. Means with SDs are shown. n =4; Mann-Whitney U test. (C) Representative flow cytometry and quantification of total and tdTomato+ cell surface CD24 expression. Cells isolated from the lungs of tamoxifen treated tdT;foxj1 mice. Means with SDs are shown. n =4; Mann-Whitney U test. (D) Cross-sectioned microscopy of lung epithelial cells from tamoxifen treated tdT;foxj1 mice. ACTUB (green), cilia; tdTomato (red), Foxj1 activity; DAPI (blue), DNA. Scale bar, 50 μm, 10-μm inset. Image representative of two independent experiments with at least 2 mice each. (E) Cross-sectioned microscopy of lung epithelial cells from tamoxifen-treated tdT;foxj1 mice 24 hpi with Cal09-sfGFP. Cal09-sfGFP (green), GFP; tdTomato (red), Foxj1 activity; Hoechst (blue), DNA. Yellow arrows, GFP+ ciliated cells. White arrows, GFP- ciliated cells. Scale bar, 50 μm; 10-μm inset. Image representative of two independent experiments with at least 2 mice each. (F) Schematic of scRNA-seq experiment design. TdT;foxj1 mice were treated with tamoxifen six times over 2 weeks followed by a 2-week recovery period before infection with Cal09-sfGFP. Total lung cells were isolated at the indicated times postinfection for FACS. (G) Flow cytometry of FACS-sorted tdTomato+ ciliated cells isolated from tamoxifen-treated tdT;foxj1 mice at the indicated times postinfection with Cal09-sfGFP or mock infected with PBS. (H) UMAP dimensionality reduction plot showing ciliated cells clustered based on their transcriptomes and relation to one another. Ciliated cells are colored based on their infection status. (I) UMAP dimensionality reduction plot showing ciliated cells clustered based on their transcriptomes and relation to one another. Ciliated cells are colored based on their infection status and time point. (J) The percentage of mock tdTomato+ cells with at least one transcript of ciliated cell markers Tubb4b and Foxj1. (K) Violin plot of normalized expression of ciliated cell markers Tubb4b, Foxj1, and CD24a by sample. The width of each violin represents the frequency of that expression level. For all panels, ns, not significant, and *, P ≤ 0.05.
FIG 3
FIG 3
Identification of a subpopulation of ciliated cells with basal ISG expression prior to infection. (A) UMAP dimensionality reduction plot showing ciliated cells clustered by their transcriptome similarity. Mock ciliated cells are colored purple. (B) UMAP dimensionality reduction plot showing clusters of mock ciliated cells containing at least one transcript of Foxj1. (C) Heat map of the top 10 most variably expressed genes by each mock ciliated cell cluster. Genes are ordered based on P value. The scale of the heat map shows the expression of a gene by each cell relative to the mean expression by all cells in the sample. (D) Violin plots showing the normalized expression of each ISG by the cells in each cluster. The width of each violin represents the frequency of that expression level. (E) Normalized expression of the ISGs Bst2 and Ifit1 plotted against normalized expression of Isg15 in mock cells containing at least one transcript of Isg15. Pearson’s correlation coefficient, ρ, was used to measure the linear correlation of expression. (F) Schematic of experiments used to evaluate basal ISG expression in ciliated cells in panels G to L. (G) Representative flow cytometry of ciliated cells (CD45 CD31 CD24+) isolated from mock-infected mice stained for BST2/tetherin. The BST2 gate was set using fluorescence minus one (FMO) control as shown on the left side of the panel. (H and I) qRT-PCR of mRNA isolated from FACS-sorted BST2+ or BST2 ciliated cells (CD45 CD31 CD24+) was used to quantify transcripts for ciliated cell marker genes (EpCam, Tuba1a) (H) and ISGs (Bst2, Isg15, Ifitm3, and Ifit1) (I). Gene expression was quantified based on a standard curve and normalized to endogenous 18s expression. Means with SDs are shown. n = four independent mice; Mann-Whitney U test. AU, arbitrary units. (J) Quantification of flow cytometry. Ciliated cells (CD45 CD31 CD24+) were isolated from untreated IFNAR1−/− IFNGR1−/− or tdTomato mice and stained for BST2. Means with SDs are shown; n =5 mice per group; Mann-Whitney U rest. (K) Quantification of flow cytometry. Ciliated cells (CD45 CD31 CD24+) were isolated from mock-infected or Cal09-sfGFP-infected (1.4e5 PFU) mice 7 hpi and stained for BST2. Means with SDs are shown; n = at least 6 mice per group from two independent experiments; Mann-Whitney U test. (L) Quantification of flow cytometry. GFP expression by BST2+ or BST2 ciliated cells (CD45 CD31 CD24+) isolated from mice 7 hpi with Cal09-sfGFP (1.4e5 PFU) was measured. Means with SDs are shown. n =7 mice from two independent experiments; Mann-Whitney U test. For all panels, ns, not significant, and *, P ≤ 0.05.
FIG 4
FIG 4
Uninfected bystander ciliated cells respond homogenously to pulmonary inflammation during IAV infection. (A) UMAP dimensionality reduction plot showing bystander cells. (B) UMAP dimensionality reduction plot showing unbiased clustering of bystander GFP ciliated cells. GFP ciliated cells were considered bystander cells if they had less than 10 viral transcripts. (C) Stacked bar graph plotting the percentage of each cluster that belongs to each time point. (D) Heat map of the top 10 most variably expressed genes by each cluster of bystander GFP ciliated cells. Genes are ordered based on P value. The scale of the heat map shows the expression of a gene by each cell relative to the mean expression by all cells in the sample. (E) Violin plot showing the normalized expression of Cdkn1c (negative regulation of cell cycle), Xbp1 (stress response), and Socs3 (interferon signaling). The width of each violin represents the frequency of that expression level. (F) Ridge plots depicting normalized expression of ISGs, grouped by sample. Ridge height indicates the frequency of expression level. (G) Microscopy of cross-sectioned lung epithelial cells from mock- or Cal09-sfGFP-infected mice (2 dpi) stained for ACTUB and ISG15. Scale bar, 10 μm. Yellow arrows indicate ISG15+ bystander ciliated cells. Image representative of sections from three mice from two independent experiments. (H) Flow cytometry of bystander ciliated cells (CD45 CD31 CD24+ GFP) stained for BST2. Ciliated cells were isolated from the lungs of mock-infected or Cal09-sfGFP-infected mice at the indicated times postinfection. Gate for BST2 was set using FMO control. (I) Quantification of flow cytometry in panel H. Means with SDs are shown; n =4 mice per group; Mann-Whitney U test. For all panels, ns, not significant, and *, P ≤ 0.05.
FIG 5
FIG 5
Viral replication characteristics across ciliated cells during the first 3 days of infection. (A) UMAP dimensionality reduction plot depicting infected ciliated cells. (B) UMAP dimensionality reduction plot of total ciliated cells shaded based on the fraction of total mRNA transcripts that are viral. (C) UMAP dimensionality reduction plot depicting GFP+ ciliated cells 1, 2, or 3 days post-Cal09-sfGFP infection. (D) Violin plot showing the fraction of total mRNA transcripts that are viral for each GFP+ cell grouped by sample. Violin width indicates the frequency of the percentage level. (E) Representative flow cytometry histogram of GFP+ ciliated cells (CD45 CD31 CD24+). Ciliated cells were isolated from mock-infected or Cal09-sfGFP-infected mice at the indicated times postinfection. (F) Quantification of the median fluorescence (GFP) of GFP+ ciliated cells in panel E. Means with SDs are shown; n =4 mice per time point; Mann-Whitney U test. (G) UMAP dimensionality reduction plot depicting clusters of infected cells (GFP+, ≥10 viral transcripts), which are colored by cluster identity. (H) Violin plot showing the fraction of total mRNA transcripts that are viral for each GFP+ cell grouped by cluster identity. Violin width indicates the frequency of the percentage level. (I) Quantification of the fraction of cells from each time point that make up each cluster. Cells were clustered based on host and viral gene expression. (J) Plot showing the fraction of total viral transcripts belonging to each influenza segment in infected GFP+ cells, grouped by time point. GFP+ cells were classified as infected based on the presence of 10 or more viral transcripts. If a fraction for a gene was 0, it was set to 0.001 for inclusion in the plot. (K) Bar graph depicting the percentage of infected cells (GFP+, ≥10 viral transcripts) with detectable deletions (>15 reads, >75 nt deletion, final product > 150 nt) in each flu segment or any segment.
FIG 6
FIG 6
Inflammatory antiviral responses are restricted to a subpopulation of infected ciliated cells during infection. (A) UMAP dimensionality reduction plot showing unbiased clustering of infected GFP+ cells. GFP+ cells were classified as infected based on the presence of 10 or more viral transcripts. Clustering was based on the expression of host genes only. (B) Heat map of the top 10 most variably expressed genes by each cluster of infected GFP+ ciliated cells. Cells are clustered based on host gene expression only. Genes are ordered based on P value. The scale of the heat map shows the expression of a gene by each cell relative to the mean expression by all cells in the sample. (C) Violin plots of normalized expression for 6 of the top 10 most variably expressed genes in cluster 5. Violin width indicates the frequency of the expression level. (D) Plot of the normalized expression (log2) of Ifnb1 versus Ifnl2 by cells in cluster 5. A locally weighted scatterplot smoothing (LOWESS) curve was fitted to visualize the relationship of expression. Spearman’s rank order correlation, P < 0.0001; we reject the null hypothesis that there is no correlation between Ifnb1 and Ifnl2 expression. (E) Stacked bar graph showing the percentage of each cluster in panel A that belongs to each of the three GFP+ time points. (F) Box-and-whisker plot showing the fraction of total mRNA transcripts that are virally grouped by cluster. Clustering was based on the expression of host genes only. Box extends from 25th to 75th percentiles with a line representing the median value for each cluster. Whiskers extend to the minimum and maximum value. (G) Plot of average normalized expression of each viral gene for total infected GFP+ cells and cluster 5 cells. (H) Plot of the normalized expression of Ifnb1 versus NS for total infected GFP+ cells. A LOWESS curve was fitted to visualize the relationship of expression. Spearman’s rank order correlation, P < 0.0001; we reject the null hypothesis that there is no correlation between Ifnb1 and NS expression. (I) Distribution of Ifnb1 transcripts normalized to total cellular transcripts in GFP+ infections in which deletions were (+) and were not (−) detected according to our thresholds. For all panels: ns, not significant, and *, P ≤ 0.05.

Similar articles

Cited by

References

    1. Iuliano AD, Roguski KM, Chang HH, Muscatello DJ, Palekar R, Tempia S, Cohen C, Gran JM, Schanzer D, Cowling BJ, Wu P, Kyncl J, Ang LW, Park M, Redlberger-Fritz M, Yu H, Espenhain L, Krishnan A, Emukule G, van Asten L, Pereira da Silva S, Aungkulanon S, Buchholz U, Widdowson M-A, Bresee JS, Azziz-Baumgartner E, Cheng P-Y, Dawood F, Foppa I, Olsen S, Haber M, Jeffers C, MacIntyre CR, Newall AT, Wood JG, Kundi M, Popow-Kraupp T, Ahmed M, Rahman M, Marinho F, Sotomayor Proschle CV, Vergara Mallegas N, Luzhao F, Sa L, Barbosa-Ramírez J, Sanchez DM, Gomez LA, Vargas XB, Acosta Herrera A, Llanés MJ, et al. 2018. Estimates of global seasonal influenza-associated respiratory mortality: a modelling study. Lancet 391:1285–1300. 10.1016/S0140-6736(17)33293-2. - DOI - PMC - PubMed
    1. Russell AB, Elshina E, Kowalsky JR, Te Velthuis AJW, Bloom JD. 2019. Single-cell virus sequencing of influenza infections that trigger innate immunity. J Virol 93:e00500-19. 10.1128/JVI.00500-19. - DOI - PMC - PubMed
    1. Papalexi E, Satija R. 2018. Single-cell RNA sequencing to explore immune cell heterogeneity. Nat Rev Immunol 18:35–45. 10.1038/nri.2017.76. - DOI - PubMed
    1. Paik DT, Cho S, Tian L, Chang HY, Wu JC. 2020. Single-cell RNA sequencing in cardiovascular development, disease and medicine. Nat Rev Cardiol 17:457–473. 10.1038/s41569-020-0359-y. - DOI - PMC - PubMed
    1. Carraro G, Langerman J, Sabri S, Lorenzana Z, Purkayastha A, Zhang G, Konda B, Aros CJ, Calvert BA, Szymaniak A, Wilson E, Mulligan M, Bhatt P, Lu J, Vijayaraj P, Yao C, Shia DW, Lund AJ, Israely E, Rickabaugh TM, Ernst J, Mense M, Randell SH, Vladar EK, Ryan AL, Plath K, Mahoney JE, Stripp BR, Gomperts BN. 2021. Transcriptional analysis of cystic fibrosis airways at single-cell resolution reveals altered epithelial cell states and composition. Nat Med 27:806–814. 10.1038/s41591-021-01332-7. - DOI - PMC - PubMed

Publication types