. 2022 Jul 27;96(14):e0056522.
doi: 10.1128/jvi.00565-22. Epub 2022 Jul 11.

KSHV Topologically Associating Domains in Latent and Reactivated Viral Chromatin

Affiliations

KSHV Topologically Associating Domains in Latent and Reactivated Viral Chromatin

Mel Campbell et al. J Virol. .

Abstract

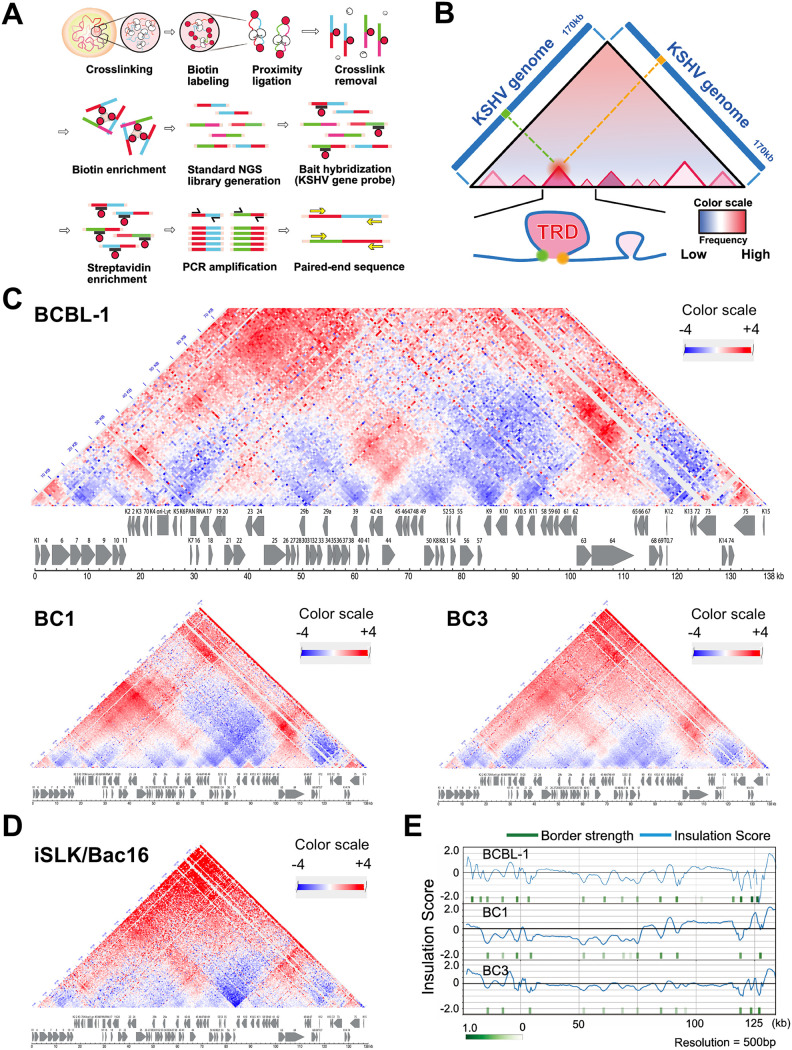
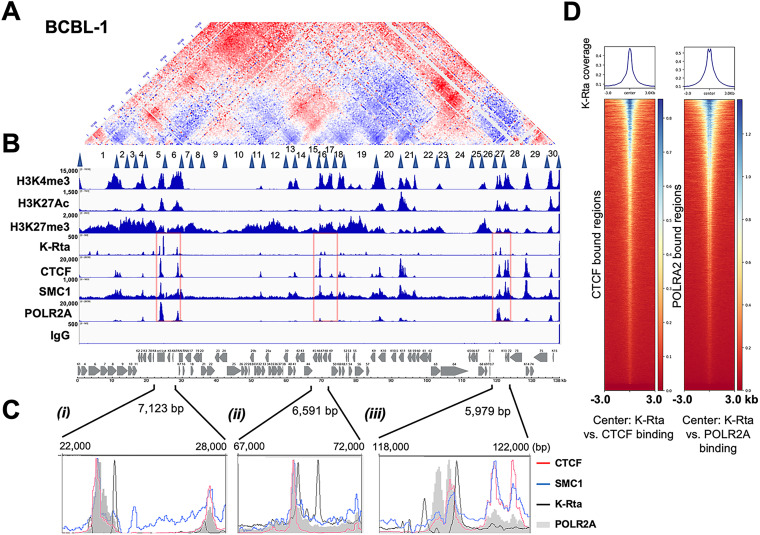
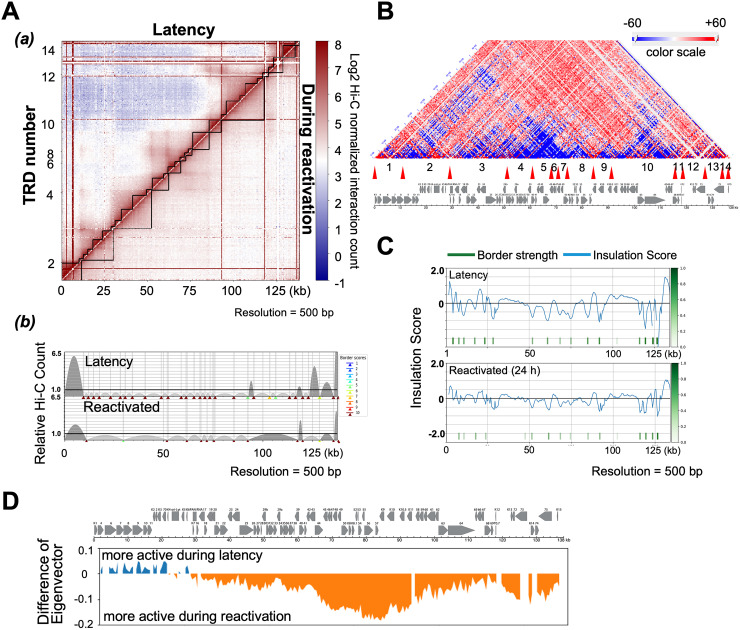
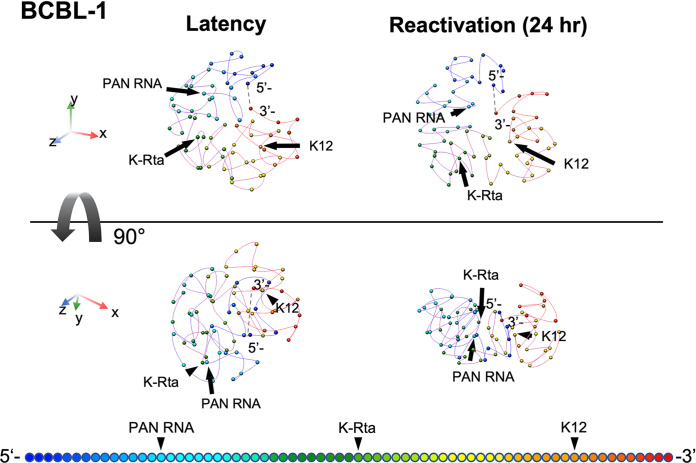
Eukaryotic genomes are structurally organized via the formation of multiple loops that create gene expression regulatory units called topologically associating domains (TADs). Here we revealed the KSHV TAD structure at 500 bp resolution and constructed a 3D KSHV genomic structural model with 2 kb binning. The latent KSHV genome formed very similar genomic architectures in three different naturally infected PEL cell lines and in an experimentally infected epithelial cell line. The majority of the TAD boundaries were occupied by structural maintenance of chromosomes (SMC1) cohesin complex and CCCTC-binding factor (CTCF), and the KSHV transactivator was recruited to those sites during reactivation. Triggering KSHV gene expression decreased prewired genomic loops within the regulatory unit, while contacts extending outside of regulatory borders increased, leading to formation of a larger regulatory unit with a shift from repressive to active compartments (B to A). The 3D genomic structural model proposes that the immediate early promoter region is localized on the periphery of the 3D viral genome during latency, while highly inducible noncoding RNA regions moved toward the inner space of the structure, resembling the configuration of a "bird cage" during reactivation. The compartment-like properties of viral episomal chromatin structure and its reorganization during the transition from latency may help facilitate viral gene transcription. IMPORTANCE The 3D architecture of chromatin allows for efficient arrangement, expression, and replication of genetic material. The genomes of all organisms studied to date have been found to be organized through some form of tiered domain structures. However, the architectural framework of the genomes of large double-stranded DNA viruses such as the herpesvirus family has not been reported. Prior studies with Kaposi's sarcoma-associated herpesvirus (KSHV) have indicated that the viral chromatin shares many biological properties exhibited by the host cell genome, essentially behaving as a mini human chromosome. Thus, we hypothesized that the KSHV genome may be organized in a similar manner. In this report, we describe the domain structure of the latent and lytic KSHV genome at 500 bp resolution and present a 3D genomic structural model for KSHV under each condition. These results add new insights into the complex regulation of the viral life cycle.

Keywords: CTCF; Capture Hi-C; KSHV; ORF50; TAD; epigenetics; genome organization; transcriptional regulation.


Conflict of interest statement

The authors declare no conflict of interest.

Figures

FIG 1
FIG 1
KSHV genomic contact map. (A) Capture Hi-C procedure. Biotin-labeled nucleotide and biotin-labeled tiling oligos are used to enrich successfully ligated and KSHV genome-containing DNA fragments. (B) Representative Hi-C contact map. Diagram of representative Hi-C contact map is presented. (C) KSHV genome contact maps in both naturally infected cells (PEL cells, BCBL-1, BC1, and BC3) and (D) experimentally infected cells (iSLK/BAC16 cells). Genomic contacts detected at more than expected frequencies are depicted in red, while underrepresented contacts between loci are shown in blue. A color range scale is listed and KSHV ORF maps are shown beneath each contact map. (E) Position of transcription regulatory domain borders. Insulation scores and positions of borders are calculated based on direction of genomic loop and looping frequencies. Borders are indicated by green vertical rectangles and insulation score is shown by the continuous blue lines.
FIG 2
FIG 2
Superimposition of select histone modifications and protein factor binding sites on genomic contacts of the latent KSHV genome. (A) The BCBL-1 contact map. The BCBL-1 contact map from Fig. 1C is shown. Latent TRDs numbered 1–30 with their borders (blue triangles) (from Fig. 3A) are listed below the contact map. (B) Histone modification and protein recruitment sites. Alignment of histone modifications H3K4Me3, H3K27Ac, H3K27me3, and binding sites of K-Rta (TREx-BCBL-1; reactivated, 12 h), CTCF, SMC1, and POLR2A in BCBL-1 from CUT&RUN or ChIP-seq (K-Rta) are shown. Control IgG for background control with CUT&RUN is also shown. The sequence reads were mapped to the KSHV genome. IGV snapshots and a KSHV genome map are shown. Numbers on the left-hand side of each track denotes the height of the peak (e.g., read depth). (C) Zoomed view of CTCF, SMC1, K-Rta, and RNAPII enrichment at select regions of the KSHV genome (i) K4-PAN RNA, (ii) ORFs 45–50, and (iii) K12 region. (D) Genome-wide correlation among K-Rta, CTCF, and RNAPII recruitment sites. Density plots showing average K-Rta ChIP-seq signals within ±3 kb regions around the center of CTCF or POLR2A peaks. The heatmap shows K-Rta signals on CTCF or POLRA2 CUT&RUN peaks. The y axis is ranked according to CTCF or POLR2A enrichment in descending order.
FIG 3
FIG 3
Dynamics of genomic contacts by reactivation. (A) Interaction frequency matrix. TRDs were calculated and visualized with TADbit, and genomic domains defined by frequencies of DNA contacts are marked with black solid lines along the diagonal (a). TAD border alignment during latency (upper) and during reactivation (lower) are shown (b). Dark and light gray arches indicate TRDs with higher and lower than expected intra-TRD interactions, respectively. TADbit border robustness (from 1–10) is identified by a color gradient from blue to red. (B) Contact heatmap: BCBL-1 reactivation versus latency. Contacts are color coded as described in Fig. 1 (red, increased contacts; blue decreased contacts). TRDs called during reactivation (Fig. 3A) numbered 1–14 with their borders (red triangles) are listed below the contact map. The KSHV ORF map is included in the bottom panel. The portion of figures (A and B) are adapted and modified from a previously published book chapter (44). (C) TAD border analyses. Insulation score (border strength) is plotted (a). Reactivation reduced insulation and border strength to create larger transcription units (b). (D) Compartment analysis. 500 bp bins were identified as in compartment A or B by calculating eigenvectors.
FIG 4
FIG 4
KSHV 3D genomic structure modeling. Frequencies of ligated fragments were used to calculate distances between fragments at 2 kb resolution. The average of 8 different models were used to draw the figures. KSHV 3D genomic structure before (left) and after (right) triggering reactivation are shown. The 90-degree rotated views are also shown in the panels (bottom). Color gradation associated with KSHV genomic position are depicted at the bottom of figures. The movies of the 3D figures including individual 8 models in shadow are presented in Fig. S5. The dotted line in each structure represents the putative terminal repeat (TR) position. Each sphere marks 2 kb of linear genomic sequence.

Similar articles

Cited by

References

    1. Bechtel JT, Liang Y, Hvidding J, Ganem D. 2003. Host range of Kaposi's sarcoma-associated herpesvirus in cultured cells. J Virol 77:6474–6481. 10.1128/jvi.77.11.6474-6481.2003. - DOI - PMC - PubMed
    1. Vieira J, O'Hearn PM. 2004. Use of the red fluorescent protein as a marker of Kaposi's sarcoma-associated herpesvirus lytic gene expression. Virology 325:225–240. 10.1016/j.virol.2004.03.049. - DOI - PubMed
    1. Johnson AS, Maronian N, Vieira J. 2005. Activation of Kaposi's sarcoma-associated herpesvirus lytic gene expression during epithelial differentiation. J Virol 79:13769–13777. 10.1128/JVI.79.21.13769-13777.2005. - DOI - PMC - PubMed
    1. Arias C, Weisburd B, Stern-Ginossar N, Mercier A, Madrid AS, Bellare P, Holdorf M, Weissman JS, Ganem D. 2014. KSHV 2.0: a comprehensive annotation of the Kaposi's sarcoma-associated herpesvirus genome using next-generation sequencing reveals novel genomic and functional features. PLoS Pathog 10:e1003847. 10.1371/journal.ppat.1003847. - DOI - PMC - PubMed
    1. Bruce AG, Barcy S, DiMaio T, Gan E, Garrigues HJ, Lagunoff M, Rose TM. 2017. Quantitative analysis of the KSHV transcriptome following primary infection of blood and lymphatic endothelial cells. Pathogens 6:11. 10.3390/pathogens6010011. - DOI - PMC - PubMed

Publication types