. 2022 Jul 26;88(14):e0061722.
doi: 10.1128/aem.00617-22. Epub 2022 Jul 11.

Demographic Expansions and the Emergence of Host Specialization in Genetically Distinct Ecotypes of the Tick-Transmitted Bacterium Anaplasma phagocytophilum

Affiliations

Demographic Expansions and the Emergence of Host Specialization in Genetically Distinct Ecotypes of the Tick-Transmitted Bacterium Anaplasma phagocytophilum

Matthew L Aardema et al. Appl Environ Microbiol. .

Abstract

In Europe, genetically distinct ecotypes of the tick-vectored bacterium Anaplasma phagocytophilum circulate among mammals in three discrete enzootic cycles. To date, potential ecological factors that contributed to the emergence of these divergent ecotypes have been poorly studied. Here, we show that the ecotype that predominantly infects roe deer (Capreolus capreolus) is evolutionarily derived. Its divergence from a host generalist ancestor occurred after the last glacial maximum as mammal populations, including roe deer, recolonized the European mainland from southern refugia. We also provide evidence that this host specialist ecotype's effective population size (Ne) has tracked changes in the population of its roe deer host. Specifically, both host and bacterium have undergone substantial increases in Ne over the past 1,500 years. In contrast, we show that while it appears to have undergone a major population expansion starting ~3,500 years ago, in the past 500 years, the contemporary host generalist ecotype has experienced a substantial reduction in genetic diversity levels, possibly as a result of reduced opportunities for transmission between competent hosts. IMPORTANCE The findings of this study reveal specific events important for the evolution of host specialization in a naturally occurring, obligately intracellular bacterial pathogen. Specifically, they show that host range shifts and the emergence of host specialization may occur during periods of population growth in a generalist ancestor. Our results also demonstrate the close correlation between demographic patterns in host and pathogen for a specialist system. These findings have important relevance for understanding the evolution of host range diversity. They may inform future work on host range dynamics, and they provide insights for understanding the emergence of pathogens that have human and veterinary health implications.

Keywords: Anaplasmataceae; Capreolus capreolus; Rickettsiales; arthropod vector; enzootic cycles; host range.


Conflict of interest statement

The authors declare no conflict of interest.

Figures
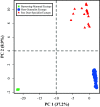
FIG 1
FIG 1
Results from a principal-component analysis (PCA) based on concatenated data from seven previously published genetic regions from European A. phagocytophilum samples (see the text). Shown are the first and second principal components (PC1 and PC2, respectively). This figure was produced using the R package Adegent version 2.1.3 (72), as implemented in R version 4.0.2 (73). Each color/shape combination represents one of the three mammal-infecting ecotypes of A. phagocytophilum circulating in Europe.
FIG 2
FIG 2
Box-and-whisker plots indicating the numbers of derived replacement (a) and silent (b) substitutions observed in all pairwise comparisons of each unique strain from the roe deer specialist and host generalist ecotypes. Polarization to define the ancestral state was done in comparison to the unique strains of the burrowing-mammal ecotype. The thick horizontal black bars indicate the observed median numbers of substitutions. The boxes show the second and third quartiles, while the whiskers indicate the first and fourth quartiles. Outlying observations are indicated by the open circles. Circles may represent more than one observation. Comparisons between the roe deer specialist ecotype and the generalist ecotype were both statistically significant (P < 0.001; see text for more details).
FIG 3
FIG 3
Divergence time estimates for the three ecotypes. (a) Tree, including the outgroup A. marginale. (b) Subtree with only samples of A. phagocytophilum. In both trees, the mean estimated divergence time is shown above the node (in black text), followed in parentheses by the median estimated divergence time (in gray text). The 95% HPD is given below the node. Only estimates for nodes representing species/ecotype divergences are shown. The scale bar at the bottom of each tree indicates time in millions of years (a) or years (b). Duplicate haplotypes were removed prior to analysis.
FIG 4
FIG 4
Extended Bayesian skyline plot (EBSP) results for the two I. ricinus-vectored ecotypes showing changes in effective population size (Ne) over time. Median results are shown by the black dashed lines, while the upper and lower 95% highest posterior density (HPD) intervals are indicated by the colored areas contained within the thin solid lines. Changes in the roe deer specialist ecotype’s Ne are indicated in red, and changes in the host generalist ecotype’s Ne are indicated in blue. The original timeline was determined in terms of number of generations, and this was converted to years assuming 100 generations per year (see Materials and Methods for more details). The timeline has been restricted to 4,000 years. Also shown are the median (finely dashed vertical gray line) and mean (coarsely dashed vertical gray line) divergence estimates for the two ecotypes from our Bayesian coalescent analysis (see the text and Fig. 3 for more details).
FIG 5
FIG 5
Extended Bayesian skyline plot (EBSP) results for roe deer (Capreolus capreolus), showing changes in effective population size (Ne) over time. Median results are shown by the black dashed line, while the upper and lower 95% highest posterior density (HPD) intervals are indicated by the orange areas contained within the thin solid lines. The timeline has been restricted to 4,000 years.

Similar articles

Cited by

References

    1. Dobson A. 2004. Population dynamics of pathogens with multiple host species. Am Nat 164:S64–S78. 10.1086/424681. - DOI - PubMed
    1. Woolhouse ME, Gowtage-Sequeria S. 2005. Host range and emerging and reemerging pathogens. Emerg Infect Dis 11:1842–1847. 10.3201/eid1112.050997. - DOI - PMC - PubMed
    1. Johnson CK, Hitchens PL, Pandit PS, Rushmore J, Evans TS, Young C, Doyle MM. 2020. Global shifts in mammalian population trends reveal key predictors of virus spillover risk. Proc Biol Sci 287:20192736. 10.1098/rspb.2019.2736. - DOI - PMC - PubMed
    1. Thines M. 2019. An evolutionary framework for host shifts—jumping ships for survival. New Phytol 224:605–617. 10.1111/nph.16092. - DOI - PubMed
    1. Hibbing ME, Fuqua C, Parsek MR, Peterson SB. 2010. Bacterial competition: surviving and thriving in the microbial jungle. Nat Rev Microbiol 8:15–25. 10.1038/nrmicro2259. - DOI - PMC - PubMed

Publication types

LinkOut - more resources