. 2022 Sep-Oct;42(5):1415-1432.
doi: 10.1148/rg.220036. Epub 2022 Jul 22.

Musculoskeletal Manifestations of COVID-19: Currently Described Clinical Symptoms and Multimodality Imaging Findings

Affiliations

Musculoskeletal Manifestations of COVID-19: Currently Described Clinical Symptoms and Multimodality Imaging Findings

Imran M Omar et al. Radiographics. 2022 Sep-Oct.

Abstract

COVID-19, the clinical syndrome produced by infection with SARS-CoV-2, can result in multisystem organ dysfunction, including respiratory failure and hypercoagulability, which can lead to critical illness and death. Musculoskeletal (MSK) manifestations of COVID-19 are common but have been relatively underreported, possibly because of the severity of manifestations in other organ systems. Additionally, patients who have undergone sedation and who are critically ill are often unable to alert clinicians of their MSK symptoms. Furthermore, some therapeutic measures such as medications and vaccinations can worsen existing MSK symptoms or cause additional symptoms. Symptoms may persist or occur months after the initial infection, known as post-COVID condition or long COVID. As the global experience with COVID-19 and the vaccination effort increases, certain patterns of MSK disease involving the bones, muscles, peripheral nerves, blood vessels, and joints have emerged, many of which are likely related to a hyperinflammatory host response, prothrombotic state, or therapeutic efforts rather than direct viral toxicity. Imaging findings for various COVID-19-related MSK pathologic conditions across a variety of modalities are being recognized, which can be helpful for diagnosis, treatment guidance, and follow-up. The online slide presentation from the RSNA Annual Meeting is available for this article. ©RSNA, 2022.


Conflict of interest statement

Disclosures of conflicts of interest.—: M.S.T. Royalties from Oxford University Press.

Figures

None
Graphical abstract
Diagram shows the pathogenesis of SARS-CoV-2 infection after viral cell
entry. Three main processes—the cytokine storm, an autoimmune response,
and hypercoagulability—lead to a cascade of events contributing to many
of the most common MSK clinical conditions (items in red). Treatments such as
medications, and vaccinations can also contribute to the pathogenesis of various
conditions.
Figure 1.
Diagram shows the pathogenesis of SARS-CoV-2 infection after viral cell entry. Three main processes—the cytokine storm, an autoimmune response, and hypercoagulability—lead to a cascade of events contributing to many of the most common MSK clinical conditions (items in red). Treatments such as medications, and vaccinations can also contribute to the pathogenesis of various conditions.
ON of the humeral heads in a 62-year-old woman with a history of
sickle cell disease and post–COVID-19 condition with progressive
shortness of breath and corticosteroid treatment. Axial CT image (bone
window) of the chest shows subchondral serpentine lucency, adjacent
sclerosis (arrows), and subchondral plate irregularity involving both
humeral heads, especially on the left. The humeral heads appeared normal at
a prior CT examination 1.5 years earlier (see supplemental online
presentation).
Figure 2.
ON of the humeral heads in a 62-year-old woman with a history of sickle cell disease and post–COVID-19 condition with progressive shortness of breath and corticosteroid treatment. Axial CT image (bone window) of the chest shows subchondral serpentine lucency, adjacent sclerosis (arrows), and subchondral plate irregularity involving both humeral heads, especially on the left. The humeral heads appeared normal at a prior CT examination 1.5 years earlier (see supplemental online presentation).
Multifocal ON of the foot in a 66-year-old nondiabetic woman who
presented with COVID toes. (A) Sagittal T1-weighted
non–fat-suppressed MR image of the right second toe shows multifocal
serpentine areas of dark signal intensity (arrows), most pronounced in the
metatarsal head. (B) Sagittal T2-weighted fat-suppressed MR image of the
region shows corresponding areas of subchondral marrow edema (arrows), which
are confluent in the phalanges, with associated periosteal edema and digital
soft-tissue edema. The skin dorsal to the middle and distal phalanges and
over the distal phalangeal distal tuft is thinned, corresponding to
cutaneous excoriation. (C, D) Axial (C) and sagittal (D) T1-weighted
fat-suppressed postcontrast MR images show nonenhancing central areas of
necrosis, with peripheral enhancement (solid arrows) reflecting reparative
change. There is extensive great toe soft-tissue enhancement (dashed arrows)
corresponding to the edema and rash seen in COVID toes.
Figure 3.
Multifocal ON of the foot in a 66-year-old nondiabetic woman who presented with COVID toes. (A) Sagittal T1-weighted non–fat-suppressed MR image of the right second toe shows multifocal serpentine areas of dark signal intensity (arrows), most pronounced in the metatarsal head. (B) Sagittal T2-weighted fat-suppressed MR image of the region shows corresponding areas of subchondral marrow edema (arrows), which are confluent in the phalanges, with associated periosteal edema and digital soft-tissue edema. The skin dorsal to the middle and distal phalanges and over the distal phalangeal distal tuft is thinned, corresponding to cutaneous excoriation. (C, D) Axial (C) and sagittal (D) T1-weighted fat-suppressed postcontrast MR images show nonenhancing central areas of necrosis, with peripheral enhancement (solid arrows) reflecting reparative change. There is extensive great toe soft-tissue enhancement (dashed arrows) corresponding to the edema and rash seen in COVID toes.
HO in two patients. (A) Axial fused PET/CT image through the hips in a
55-year-old woman with prolonged hospitalization for COVID-19 and
progressive hip stiffness shows extensive bulky HO (arrows) at the
posterolateral aspect of both acetabula that is partially adherent to the
underlying bone and mildly hypermetabolic. (B) Axial CT image (bone window)
of the chest at the level of the glenohumeral joints in a 54-year-old man
with a history of COVID-19 (hospitalized for 6 weeks) and with left shoulder
stiffness shows bilateral periarticular ossifications. On the right, there
is incompletely assessed glenohumeral osteoarthritis with clustered anterior
joint recess intra-articular bodies that are separate from the glenoid rim
(dashed arrow). On the left, the ossification is well corticated and
partially adherent to the posterior glenoid rim (solid arrow), consistent
with mild HO. No signs of left glenohumeral osteoarthritis are depicted.
Note the right apical pneumothorax related to the patient’s
underlying pulmonary disease.
Figure 4.
HO in two patients. (A) Axial fused PET/CT image through the hips in a 55-year-old woman with prolonged hospitalization for COVID-19 and progressive hip stiffness shows extensive bulky HO (arrows) at the posterolateral aspect of both acetabula that is partially adherent to the underlying bone and mildly hypermetabolic. (B) Axial CT image (bone window) of the chest at the level of the glenohumeral joints in a 54-year-old man with a history of COVID-19 (hospitalized for 6 weeks) and with left shoulder stiffness shows bilateral periarticular ossifications. On the right, there is incompletely assessed glenohumeral osteoarthritis with clustered anterior joint recess intra-articular bodies that are separate from the glenoid rim (dashed arrow). On the left, the ossification is well corticated and partially adherent to the posterior glenoid rim (solid arrow), consistent with mild HO. No signs of left glenohumeral osteoarthritis are depicted. Note the right apical pneumothorax related to the patient’s underlying pulmonary disease.
COVID-19–related myositis in a 59-year-old nondiabetic woman
who presented with burning bilateral foot pain and swelling. The serum
C-reactive protein concentration was elevated to 197 mg/dL, consistent with
the inflammatory state, although the serum creatine kinase level remained
normal. Axial T2-weighted fat-suppressed MR image (A) of the right forefoot
shows extensive diffuse intrinsic muscle edema, with extensive enhancement
seen in the same region on the axial postgadolinium-enhanced T1-weighted
fat-suppressed MR image (B). The findings were symmetric with those of the
contralateral left forefoot (see supplemental online
presentation).
Figure 5.
COVID-19–related myositis in a 59-year-old nondiabetic woman who presented with burning bilateral foot pain and swelling. The serum C-reactive protein concentration was elevated to 197 mg/dL, consistent with the inflammatory state, although the serum creatine kinase level remained normal. Axial T2-weighted fat-suppressed MR image (A) of the right forefoot shows extensive diffuse intrinsic muscle edema, with extensive enhancement seen in the same region on the axial postgadolinium-enhanced T1-weighted fat-suppressed MR image (B). The findings were symmetric with those of the contralateral left forefoot (see supplemental online presentation).
Myonecrosis in a 44-year-old man with a history of COVID-19 acute
respiratory distress syndrome and right shoulder and arm pain and swelling.
The serum creatine kinase level briefly peaked at 645 units/L (normal,
0–223 units/L) and quickly normalized. (A) Axial T1-weighted
non–fat-suppressed MR image of the right upper arm shows mild
subcutaneous reticular stranding extending to the muscular fascia without
muscle atrophy or fatty infiltration. (B) Axial T2-weighted fat-suppressed
MR image of the same area shows extensive diffuse muscle edema with some
focal sparing of the adjacent anterolateral triceps and posterior deltoid
muscles. There is circumferential deep and superficial fascial and
subcutaneous edema. (C) Axial T1-weighted fat-suppressed postcontrast MR
image of the same area shows extensive muscle and fascial enhancement,
consistent with myositis, with scattered small areas of nonenhancement,
consistent with focal type 2 myonecrosis (arrows), surrounded by rims of
peripherally enhancing muscle.
Figure 6.
Myonecrosis in a 44-year-old man with a history of COVID-19 acute respiratory distress syndrome and right shoulder and arm pain and swelling. The serum creatine kinase level briefly peaked at 645 units/L (normal, 0–223 units/L) and quickly normalized. (A) Axial T1-weighted non–fat-suppressed MR image of the right upper arm shows mild subcutaneous reticular stranding extending to the muscular fascia without muscle atrophy or fatty infiltration. (B) Axial T2-weighted fat-suppressed MR image of the same area shows extensive diffuse muscle edema with some focal sparing of the adjacent anterolateral triceps and posterior deltoid muscles. There is circumferential deep and superficial fascial and subcutaneous edema. (C) Axial T1-weighted fat-suppressed postcontrast MR image of the same area shows extensive muscle and fascial enhancement, consistent with myositis, with scattered small areas of nonenhancement, consistent with focal type 2 myonecrosis (arrows), surrounded by rims of peripherally enhancing muscle.
Inflammatory arthritis in a 53-year-old woman who had recovered from
COVID-19 2 weeks earlier and presented with intermittent arthralgias
and swelling. (A) Coronal T2-weighted fat-suppressed MR image of the palm of
the hand shows oligoarticular arthritis of the first carpometacarpal joint
with periarticular soft-tissue edema (solid arrow in A and B), along with
flexor bursal synovial edema (between dashed arrows in A and B). Note mild
fifth metacarpophalangeal radial pericapsular edema without associated
erosions or bone marrow edema. (B) Coronal T1-weighted fat-suppressed
postcontrast MR image of the same area shows enhancement of the affected
regions, indicating active inflammation and synovitis. (C) Axial T1-weighted
fat-suppressed postcontrast MR image of the wrist through the proximal
carpal row shows synovial enhancement in the second extensor compartment
(solid arrow) and the flexor tendon bursae (dashed arrows), consistent with
active synovitis.
Figure 7.
Inflammatory arthritis in a 53-year-old woman who had recovered from COVID-19 2 weeks earlier and presented with intermittent arthralgias and swelling. (A) Coronal T2-weighted fat-suppressed MR image of the palm of the hand shows oligoarticular arthritis of the first carpometacarpal joint with periarticular soft-tissue edema (solid arrow in A and B), along with flexor bursal synovial edema (between dashed arrows in A and B). Note mild fifth metacarpophalangeal radial pericapsular edema without associated erosions or bone marrow edema. (B) Coronal T1-weighted fat-suppressed postcontrast MR image of the same area shows enhancement of the affected regions, indicating active inflammation and synovitis. (C) Axial T1-weighted fat-suppressed postcontrast MR image of the wrist through the proximal carpal row shows synovial enhancement in the second extensor compartment (solid arrow) and the flexor tendon bursae (dashed arrows), consistent with active synovitis.
Inflammatory arthritis in a 43-year-old man who had recovered from
mild COVID-19 a few weeks earlier and presented with scattered areas of
bilateral hand arthralgia and periarticular swelling. The left second
metacarpophalangeal (MCP) joint was among the affected joints. Long-axis
microvascular Doppler US image of the radial margin of the second MCP joint
shows a mildly thickened synovial fluid complex with mild hyperemia (arrow),
indicating active synovitis. No articular erosions were seen, and no
significant periarticular vascularity was seen at color Doppler US of the
same region. MC = metacarpal (head), PP = proximal phalanx.
Figure 8.
Inflammatory arthritis in a 43-year-old man who had recovered from mild COVID-19 a few weeks earlier and presented with scattered areas of bilateral hand arthralgia and periarticular swelling. The left second metacarpophalangeal (MCP) joint was among the affected joints. Long-axis microvascular Doppler US image of the radial margin of the second MCP joint shows a mildly thickened synovial fluid complex with mild hyperemia (arrow), indicating active synovitis. No articular erosions were seen, and no significant periarticular vascularity was seen at color Doppler US of the same region. MC = metacarpal (head), PP = proximal phalanx.
Sacroiliitis in a 55-year-old man with a history of COVID-19 2
months earlier and subsequent low back and perianal pain. A full workup
failed to show a gastrointestinal cause for the patient’s symptoms.
Given the patient’s age (>45 years) and the lack of classic
inflammatory back pain symptoms or history of psoriasis or inflammatory
bowel disease, an axial spondyloarthritis was felt to be unlikely, and the
HLA-B27 receptor status is unknown. (A) Coronal oblique T1-weighted
non–fat-suppressed MR image of the sacroiliac joints shows bilateral
sacroiliac erosions with irregularity of the subchondral bone plates
(arrows) that are more pronounced on the iliac side of the joints. (B, C)
Coronal oblique T2-weighted fat-suppressed (B) and coronal oblique
T1-weighted fat-suppressed postcontrast (C) MR images of the same area show
bone marrow edema and enhancement in the areas of erosion (arrows),
suggestive of active lesions. The findings are slightly worse on the right,
where they extend more cranially and involve the sacral side of the joint to
a greater degree.
Figure 9.
Sacroiliitis in a 55-year-old man with a history of COVID-19 2 months earlier and subsequent low back and perianal pain. A full workup failed to show a gastrointestinal cause for the patient’s symptoms. Given the patient’s age (>45 years) and the lack of classic inflammatory back pain symptoms or history of psoriasis or inflammatory bowel disease, an axial spondyloarthritis was felt to be unlikely, and the HLA-B27 receptor status is unknown. (A) Coronal oblique T1-weighted non–fat-suppressed MR image of the sacroiliac joints shows bilateral sacroiliac erosions with irregularity of the subchondral bone plates (arrows) that are more pronounced on the iliac side of the joints. (B, C) Coronal oblique T2-weighted fat-suppressed (B) and coronal oblique T1-weighted fat-suppressed postcontrast (C) MR images of the same area show bone marrow edema and enhancement in the areas of erosion (arrows), suggestive of active lesions. The findings are slightly worse on the right, where they extend more cranially and involve the sacral side of the joint to a greater degree.
Adhesive capsulitis in a 46-year-old woman who developed atraumatic
left shoulder pain and decreased range of motion 2 months after recovering
from mild symptoms of COVID-19. (A) Coronal T2-weighted fat-suppressed MR
image of the shoulder shows typical findings often seen with adhesive
capsulitis, including an edematous thickened inferior glenohumeral ligament
(IGHL), particularly at its humeral attachment (arrows). (B) Sagittal
T2-weighted fat-suppressed MR image of the shoulder again shows edema of the
IGHL (solid arrows), with additional mild rotator interval edema and
thickening of the coracohumeral ligament (dashed arrow). Mild supraspinatus
myotendinous junction edema is also seen (arrowhead). (C) Sagittal
T1-weighted non–fat-suppressed MR image of the same area confirms
thickening and ill definition of the coracohumeral ligament (dashed arrow).
The fat within the rotator interval is still partially preserved. The IGHL
also appears thickened diffusely (solid arrows). The MRI findings are
compatible with the freezing or inflamed phase of adhesive
capsulitis.
Figure 10.
Adhesive capsulitis in a 46-year-old woman who developed atraumatic left shoulder pain and decreased range of motion 2 months after recovering from mild symptoms of COVID-19. (A) Coronal T2-weighted fat-suppressed MR image of the shoulder shows typical findings often seen with adhesive capsulitis, including an edematous thickened inferior glenohumeral ligament (IGHL), particularly at its humeral attachment (arrows). (B) Sagittal T2-weighted fat-suppressed MR image of the shoulder again shows edema of the IGHL (solid arrows), with additional mild rotator interval edema and thickening of the coracohumeral ligament (dashed arrow). Mild supraspinatus myotendinous junction edema is also seen (arrowhead). (C) Sagittal T1-weighted non–fat-suppressed MR image of the same area confirms thickening and ill definition of the coracohumeral ligament (dashed arrow). The fat within the rotator interval is still partially preserved. The IGHL also appears thickened diffusely (solid arrows). The MRI findings are compatible with the freezing or inflamed phase of adhesive capsulitis.
Arterial and venous lower extremity thrombosis in a 49-year-old man
with a history of COVID-19 who presented with left lower extremity pain,
swelling, and pulselessness. (A) Axial CT angiographic image of the lower
extremities at the level of the femoral condyles shows contrast material
opacifying the right popliteal artery and vein (solid arrow) but not the
left (dashed arrow), consistent with thrombosis. (B) More distal axial CT
angiographic image of the calves shows near-complete nonopacification of the
right popliteal vein with a thin rim of surrounding contrast material (solid
arrow), indicating near-occlusive thrombosis. In the left lower leg, there
is subcutaneous stranding (arrowhead), consistent with soft-tissue edema.
The multifocal arterial and venous thrombi are suggestive of a
hypercoagulable state. (C) Three-dimensional reformatted coronal CT
angiographic image shows absence of opacification of the left popliteal
artery and its major branches (dashed arrow) owing to the arterial
thrombosis. In comparison, the right popliteal artery and its major branches
are well opacified (solid arrow), consistent with patency.
Figure 11.
Arterial and venous lower extremity thrombosis in a 49-year-old man with a history of COVID-19 who presented with left lower extremity pain, swelling, and pulselessness. (A) Axial CT angiographic image of the lower extremities at the level of the femoral condyles shows contrast material opacifying the right popliteal artery and vein (solid arrow) but not the left (dashed arrow), consistent with thrombosis. (B) More distal axial CT angiographic image of the calves shows near-complete nonopacification of the right popliteal vein with a thin rim of surrounding contrast material (solid arrow), indicating near-occlusive thrombosis. In the left lower leg, there is subcutaneous stranding (arrowhead), consistent with soft-tissue edema. The multifocal arterial and venous thrombi are suggestive of a hypercoagulable state. (C) Three-dimensional reformatted coronal CT angiographic image shows absence of opacification of the left popliteal artery and its major branches (dashed arrow) owing to the arterial thrombosis. In comparison, the right popliteal artery and its major branches are well opacified (solid arrow), consistent with patency.
Spontaneous intramuscular hematoma resulting in acute muscle
denervation from compressive neuropathy in a 60-year-old man with COVID-19
undergoing anticoagulation therapy who presented with left flank pain
radiating to the left inguinal region. (A) Axial T1-weighted
non–fat-suppressed MR image of the retroperitoneum shows a
heterogeneous left iliopsoas collection (arrow) with a thin peripheral dark
rim related to a pseudocapsule and hemosiderin deposition, an inner ring of
high signal intensity and a central core of lower signal intensity, related
to blood products in various stages (concentric ring sign). (B) Coronal
T1-weighted fat-suppressed postcontrast MR image of the pelvis shows the
inner ring of hyperintense signal (arrow) without significant enhancement of
the collection. (C) Axial T2-weighted fat-suppressed MR image of the pelvis
inferior to A shows edema of the left femoral nerve (arrow), consistent with
compressive neuropathy. (D) More inferior axial T2-weighted fat-suppressed
MR image of the inguinal regions shows anterior and anteromedial muscle
edema (arrow), most pronounced in the adductor compartment, consistent with
compressive femoral neuropathy.
Figure 12.
Spontaneous intramuscular hematoma resulting in acute muscle denervation from compressive neuropathy in a 60-year-old man with COVID-19 undergoing anticoagulation therapy who presented with left flank pain radiating to the left inguinal region. (A) Axial T1-weighted non–fat-suppressed MR image of the retroperitoneum shows a heterogeneous left iliopsoas collection (arrow) with a thin peripheral dark rim related to a pseudocapsule and hemosiderin deposition, an inner ring of high signal intensity and a central core of lower signal intensity, related to blood products in various stages (concentric ring sign). (B) Coronal T1-weighted fat-suppressed postcontrast MR image of the pelvis shows the inner ring of hyperintense signal (arrow) without significant enhancement of the collection. (C) Axial T2-weighted fat-suppressed MR image of the pelvis inferior to A shows edema of the left femoral nerve (arrow), consistent with compressive neuropathy. (D) More inferior axial T2-weighted fat-suppressed MR image of the inguinal regions shows anterior and anteromedial muscle edema (arrow), most pronounced in the adductor compartment, consistent with compressive femoral neuropathy.
Secondary infections in two patients. (A) Transverse color Doppler US
image of the lower back in a 34-year-old woman with type I diabetes mellitus
and subsequent COVID-19 who presented with worsening back pain, swelling,
and fevers shows typical findings of a subcutaneous abscess, including an
anechoic collection with marked surrounding hyperemia. The subcutaneous fat
in the near-field is echogenic and has irregular hypoechoic septa
(cobblestone appearance), representing edema and probably phlegmon. The
results of a fine-needle aspiration confirmed methicillin-susceptible S
aureus. (B) Sagittal T1-weighted fat-suppressed midline postcontrast MR
image of the lower lumbar spine in a 66-year-old man hospitalized for
COVID-19 respiratory infection who developed back pain radiating to the
lower extremities and fevers shows a peripherally enhancing collection
within the spinal canal (arrow), consistent with an epidural abscess. The
patient was diagnosed with methicillin-resistant S aureus
bacteremia.
Figure 13.
Secondary infections in two patients. (A) Transverse color Doppler US image of the lower back in a 34-year-old woman with type I diabetes mellitus and subsequent COVID-19 who presented with worsening back pain, swelling, and fevers shows typical findings of a subcutaneous abscess, including an anechoic collection with marked surrounding hyperemia. The subcutaneous fat in the near-field is echogenic and has irregular hypoechoic septa (cobblestone appearance), representing edema and probably phlegmon. The results of a fine-needle aspiration confirmed methicillin-susceptible S aureus. (B) Sagittal T1-weighted fat-suppressed midline postcontrast MR image of the lower lumbar spine in a 66-year-old man hospitalized for COVID-19 respiratory infection who developed back pain radiating to the lower extremities and fevers shows a peripherally enhancing collection within the spinal canal (arrow), consistent with an epidural abscess. The patient was diagnosed with methicillin-resistant S aureus bacteremia.
GBS in a 15-year-old adolescent girl with COVID-19 with progressive
ascending lower extremity pain and weakness. The patient was diagnosed with
COVID-19–related acute motor axonal neuropathy (AMAN), a variant of
GBS, and myopathy due to either AMAN, critical illness myopathy, or both.
(A, B) Axial T1-weighted non–fat-suppressed postcontrast MR image of
the lumbar spine at the L3 level (A) and sagittal T1-weighted fat-suppressed
postcontrast MR image of the lumbar spine through the left neural foramina
(B) show thickening and enhancement of the nerve roots (arrows). (C) Axial
T1-weighted non–fat-suppressed MR image of the mid thighs shows
diffuse left thigh muscle atrophy, particularly in the posterior
compartment, with more subtle right thigh posterior compartment decreased
muscle bulk. (D) Axial short τ inversion-recovery (STIR) MR image at
the same level shows mild diffuse left thigh muscle edema and subtle left
thigh anterior compartment muscle edema, which may indicate areas of greater
disease activity.
Figure 14.
GBS in a 15-year-old adolescent girl with COVID-19 with progressive ascending lower extremity pain and weakness. The patient was diagnosed with COVID-19–related acute motor axonal neuropathy (AMAN), a variant of GBS, and myopathy due to either AMAN, critical illness myopathy, or both. (A, B) Axial T1-weighted non–fat-suppressed postcontrast MR image of the lumbar spine at the L3 level (A) and sagittal T1-weighted fat-suppressed postcontrast MR image of the lumbar spine through the left neural foramina (B) show thickening and enhancement of the nerve roots (arrows). (C) Axial T1-weighted non–fat-suppressed MR image of the mid thighs shows diffuse left thigh muscle atrophy, particularly in the posterior compartment, with more subtle right thigh posterior compartment decreased muscle bulk. (D) Axial short τ inversion-recovery (STIR) MR image at the same level shows mild diffuse left thigh muscle edema and subtle left thigh anterior compartment muscle edema, which may indicate areas of greater disease activity.
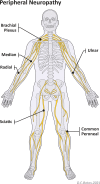
Diagram shows the most frequently reported sites of peripheral
neuropathy in patients with COVID-19. The upper extremity, particularly the
ulnar nerve and brachial plexus, is more commonly affected than the lower
extremity.
Figure 15.
Diagram shows the most frequently reported sites of peripheral neuropathy in patients with COVID-19. The upper extremity, particularly the ulnar nerve and brachial plexus, is more commonly affected than the lower extremity.
Sciatic mononeuropathy after prone ventilation in a 34-year-old
critically ill man with obesity and a history of prolonged hospitalization
for COVID-19. The patient presented with left lower extremity weakness along
the sciatic nerve distribution. (A) Axial T2-weighted fat-suppressed MR
image of the upper thigh shows increased signal intensity of the sciatic
nerve (arrow), which suggests sciatic neuropathy. No significant muscle
edema or atrophy is depicted, which suggests that the neuropathy may not
extend proximal to the thigh. (B) More distal axial T2-weighted
fat-suppressed MR image of the upper calf shows tibial nerve edema (arrow).
Note the diffuse lower leg posterior compartment muscle edema, consistent
with denervation. (C) Sagittal postcontrast isotropic three-dimensional fast
spin-echo STIR reformatted MR image shows the long-axis extent of the
sciatic neuropathy from the femoral subtrochanteric level through the
popliteal fossa (arrow). No space-occupying lesions are depicted along the
course of the sciatic nerve.
Figure 16.
Sciatic mononeuropathy after prone ventilation in a 34-year-old critically ill man with obesity and a history of prolonged hospitalization for COVID-19. The patient presented with left lower extremity weakness along the sciatic nerve distribution. (A) Axial T2-weighted fat-suppressed MR image of the upper thigh shows increased signal intensity of the sciatic nerve (arrow), which suggests sciatic neuropathy. No significant muscle edema or atrophy is depicted, which suggests that the neuropathy may not extend proximal to the thigh. (B) More distal axial T2-weighted fat-suppressed MR image of the upper calf shows tibial nerve edema (arrow). Note the diffuse lower leg posterior compartment muscle edema, consistent with denervation. (C) Sagittal postcontrast isotropic three-dimensional fast spin-echo STIR reformatted MR image shows the long-axis extent of the sciatic neuropathy from the femoral subtrochanteric level through the popliteal fossa (arrow). No space-occupying lesions are depicted along the course of the sciatic nerve.
Asymmetric muscle denervation atrophy in a 37-year-old woman with a
history of mechanical ventilation owing to COVID-19. The patient experienced
subsequent sciatic mononeuropathy with long-standing hamstring and lower leg
weakness. (A) Axial T2-weighted fat-suppressed MR image of the left mid
thigh shows left sciatic nerve edema (solid arrow). There is posterior
compartment diffuse muscle edema, particularly involving the semimembranosus
muscle (dashed arrow). (B) Axial T1-weighted non–fat-suppressed MR
image at the same level shows posterior compartment–predominant
muscle atrophy and fatty infiltration, also more pronounced in the
semimembranosus muscle (arrow). The findings are consistent with denervation
in the sciatic nerve distribution that has a chronic component given the
muscular atrophy.
Figure 17.
Asymmetric muscle denervation atrophy in a 37-year-old woman with a history of mechanical ventilation owing to COVID-19. The patient experienced subsequent sciatic mononeuropathy with long-standing hamstring and lower leg weakness. (A) Axial T2-weighted fat-suppressed MR image of the left mid thigh shows left sciatic nerve edema (solid arrow). There is posterior compartment diffuse muscle edema, particularly involving the semimembranosus muscle (dashed arrow). (B) Axial T1-weighted non–fat-suppressed MR image at the same level shows posterior compartment–predominant muscle atrophy and fatty infiltration, also more pronounced in the semimembranosus muscle (arrow). The findings are consistent with denervation in the sciatic nerve distribution that has a chronic component given the muscular atrophy.
Sarcopenia in a 54-year-old man hospitalized for COVID-19 acute
respiratory distress syndrome who was diagnosed with weakness and global
pelvic muscle atrophy. (A) Axial CT image of the abdomen at the L3 level was
obtained at patient admission, and subsequent skeletal muscle
cross-sectional area quantification measured 59.5 cm2/m2. (B) Repeat axial
CT image of the abdomen at the L3 level 4 weeks later, after an extended
stay in the intensive care unit, shows that the skeletal muscle
cross-sectional area has decreased to 48.5 cm2/m2, indicating
sarcopenia.
Figure 18.
Sarcopenia in a 54-year-old man hospitalized for COVID-19 acute respiratory distress syndrome who was diagnosed with weakness and global pelvic muscle atrophy. (A) Axial CT image of the abdomen at the L3 level was obtained at patient admission, and subsequent skeletal muscle cross-sectional area quantification measured 59.5 cm2/m2. (B) Repeat axial CT image of the abdomen at the L3 level 4 weeks later, after an extended stay in the intensive care unit, shows that the skeletal muscle cross-sectional area has decreased to 48.5 cm2/m2, indicating sarcopenia.
Diaphragm atrophy and poor contractility in a 46-year-old man with
COVID-19 with persistent dyspnea, right hemidiaphragm dysfunction, and
normal left hemidiaphragm function. (A) Gray-scale US image of the right
hemidiaphragm in the ninth intercostal space during the expiratory phase of
respiration shows that the zone of apposition of the diaphragm measures 0.18
cm. The left hemidiaphragm thickness was 0.24 cm (see supplemental online
presentation), and normal thickness is approximately 0.15 cm or greater. (B)
Gray-scale US image of the same region during the inspiratory phase of
respiration shows that the zone of apposition of the diaphragm measures 0.20
cm. The left hemidiaphragm thickness was 0.33 cm (see supplemental online
presentation), and normal thickness is about 0.18 cm or greater. The
contractility ratio, which is the thickness of the zone apposition with
inspiration divided by the thickness during expiration, measures 1.1, and
normal is at least 1.2. (C) M-mode US image of the diaphragm over several
deep breaths shows that the diaphragmatic excursion, which is the height of
the diaphragm with terminal expiration minus the height of the diaphragm
during deep inspiration, measures 1.46 cm. Although the absolute thickness
of the diaphragmatic zone of apposition on the right is normal with
inspiration and expiration, there is a significant difference between the
right and left sides, and the contractility ratio is lower than expected.
Furthermore, the diaphragmatic excursion with deep breathing is much less
than expected. Together, these findings are consistent with left
hemidiaphragm atrophy and dysfunction.
Figure 19.
Diaphragm atrophy and poor contractility in a 46-year-old man with COVID-19 with persistent dyspnea, right hemidiaphragm dysfunction, and normal left hemidiaphragm function. (A) Gray-scale US image of the right hemidiaphragm in the ninth intercostal space during the expiratory phase of respiration shows that the zone of apposition of the diaphragm measures 0.18 cm. The left hemidiaphragm thickness was 0.24 cm (see supplemental online presentation), and normal thickness is approximately 0.15 cm or greater. (B) Gray-scale US image of the same region during the inspiratory phase of respiration shows that the zone of apposition of the diaphragm measures 0.20 cm. The left hemidiaphragm thickness was 0.33 cm (see supplemental online presentation), and normal thickness is about 0.18 cm or greater. The contractility ratio, which is the thickness of the zone apposition with inspiration divided by the thickness during expiration, measures 1.1, and normal is at least 1.2. (C) M-mode US image of the diaphragm over several deep breaths shows that the diaphragmatic excursion, which is the height of the diaphragm with terminal expiration minus the height of the diaphragm during deep inspiration, measures 1.46 cm. Although the absolute thickness of the diaphragmatic zone of apposition on the right is normal with inspiration and expiration, there is a significant difference between the right and left sides, and the contractility ratio is lower than expected. Furthermore, the diaphragmatic excursion with deep breathing is much less than expected. Together, these findings are consistent with left hemidiaphragm atrophy and dysfunction.
COVID-19 vaccine–related findings in three patients. (A)
Coronal T2-weighted fat-suppressed MR image of the right shoulder in a
34-year-old woman with persistent pain and limited range of motion 2 months
after receiving the Pfizer-BioNTech mRNA COVID-19 vaccine. The patient
experienced progressive pain 3 days after her first dose of the vaccine and
had no other trauma or prior shoulder injury. There is moderate
subacromial-subdeltoid bursitis (solid white arrows), with tendinopathy at
the junction of the supraspinatus and infraspinatus tendons and fraying
(black arrow), and underlying superolateral humeral head marrow edema and
irregularity (dashed arrow). The tendon and bone findings could be related
to deep needle placement through the bursa and into the substance of the
tendon. (B) Axial T2-weighted fat-suppressed MR image of the left shoulder
in a 27-year-old woman who received the second dose of the Moderna mRNA
COVID-19 vaccine 5 weeks earlier with continued shoulder pain and tenderness
shows persistent mild ill-defined lateral deltoid muscle edema (arrow) at
the site of maximal tenderness, thought to represent postinjection myopathy.
No other findings to explain the patient’s symptoms were seen. (C)
Coronal T2-weighted fat-suppressed MR image of the anterior shoulder in a
45-year-old woman who received the first dose of the Pfizer-BioNTech
COVID-19 vaccination 4 days earlier with new onset of shoulder pain and
decreased range of motion shows reactive axillary lymphadenopathy (solid
arrow). Note the additional enlarged supraclavicular lymph node (dashed
arrow).
Figure 20.
COVID-19 vaccine–related findings in three patients. (A) Coronal T2-weighted fat-suppressed MR image of the right shoulder in a 34-year-old woman with persistent pain and limited range of motion 2 months after receiving the Pfizer-BioNTech mRNA COVID-19 vaccine. The patient experienced progressive pain 3 days after her first dose of the vaccine and had no other trauma or prior shoulder injury. There is moderate subacromial-subdeltoid bursitis (solid white arrows), with tendinopathy at the junction of the supraspinatus and infraspinatus tendons and fraying (black arrow), and underlying superolateral humeral head marrow edema and irregularity (dashed arrow). The tendon and bone findings could be related to deep needle placement through the bursa and into the substance of the tendon. (B) Axial T2-weighted fat-suppressed MR image of the left shoulder in a 27-year-old woman who received the second dose of the Moderna mRNA COVID-19 vaccine 5 weeks earlier with continued shoulder pain and tenderness shows persistent mild ill-defined lateral deltoid muscle edema (arrow) at the site of maximal tenderness, thought to represent postinjection myopathy. No other findings to explain the patient’s symptoms were seen. (C) Coronal T2-weighted fat-suppressed MR image of the anterior shoulder in a 45-year-old woman who received the first dose of the Pfizer-BioNTech COVID-19 vaccination 4 days earlier with new onset of shoulder pain and decreased range of motion shows reactive axillary lymphadenopathy (solid arrow). Note the additional enlarged supraclavicular lymph node (dashed arrow).

References

    1. Johns Hopkins University . COVID-19 Dashboard. Johns Hopkins Coronavirus Resource Center. https://coronavirus.jhu.edu/map. Accessed May 13, 2022.
    1. Revzin MV , Raza S , Warshawsky R , et al. . Multisystem Imaging Manifestations of COVID-19, Part 1: Viral Pathogenesis and Pulmonary and Vascular System Complications. RadioGraphics 2020; 40( 6):1574–1599. - PMC - PubMed
    1. Tuzun S , Keles A , Okutan D , Yildiran T , Palamar D . Assessment of musculoskeletal pain, fatigue and grip strength in hospitalized patients with COVID-19. Eur J Phys Rehabil Med 2021; 57( 4):653–662. - PubMed
    1. Bakılan F , Gökmen İG , Ortanca B , et al. . Musculoskeletal symptoms and related factors in postacute COVID-19 patients. Int J Clin Pract 2021; 75( 11):e14734. - PMC - PubMed
    1. Ramani SL , Samet J , Franz CK , et al. . Musculoskeletal involvement of COVID-19: review of imaging. Skeletal Radiol 2021; 50( 9):1763–1773. - PMC - PubMed