. 2022 Jul 12;119(28):e2120193119.
doi: 10.1073/pnas.2120193119. Epub 2022 Jul 7.

Motor guidance by long-range communication on the microtubule highway

Affiliations

Motor guidance by long-range communication on the microtubule highway

Sithara S Wijeratne et al. Proc Natl Acad Sci U S A. .

Abstract

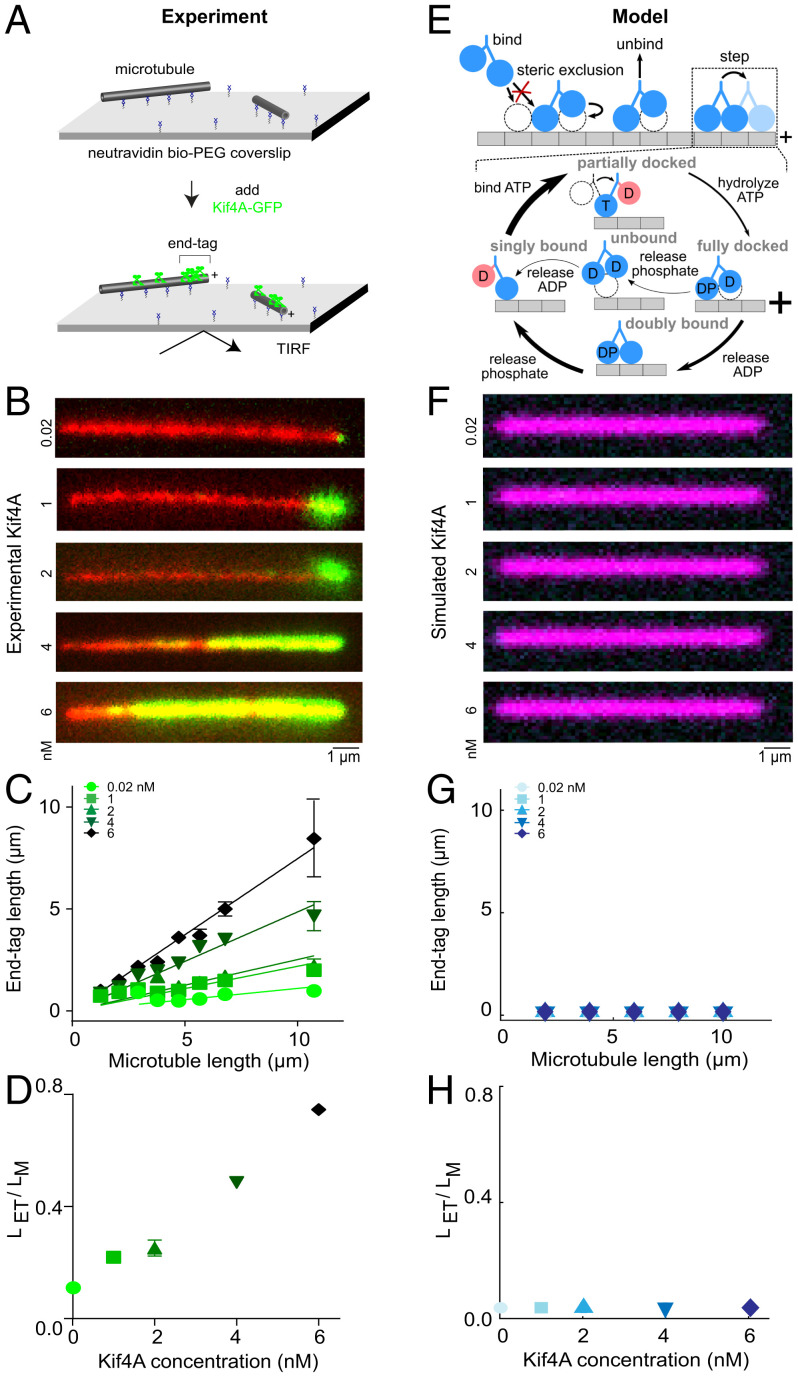
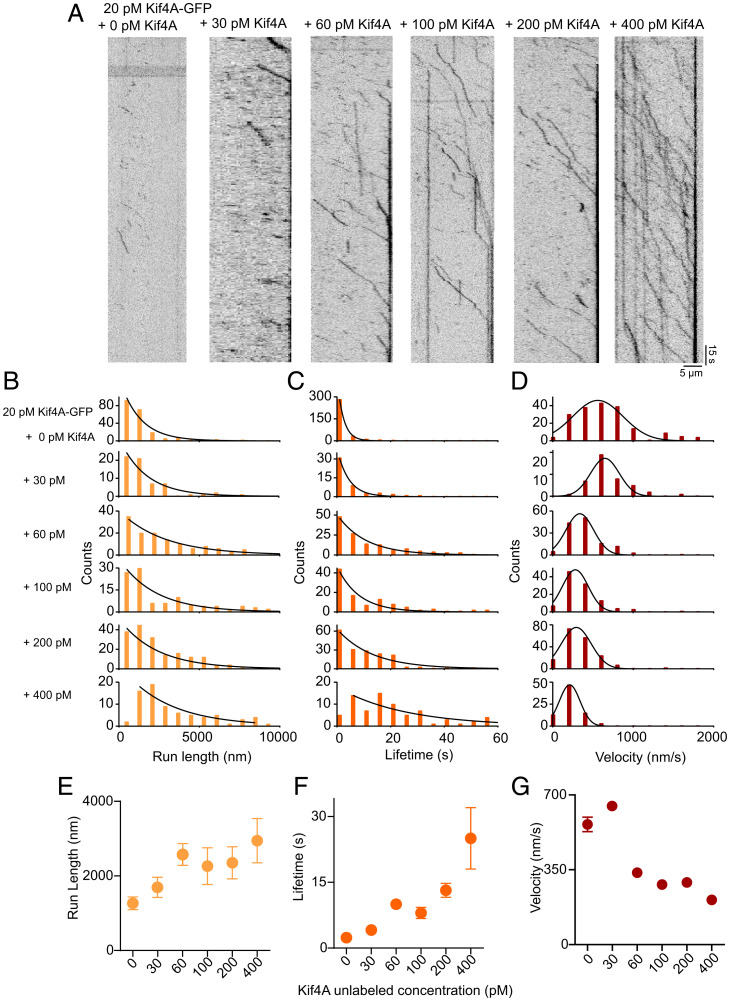
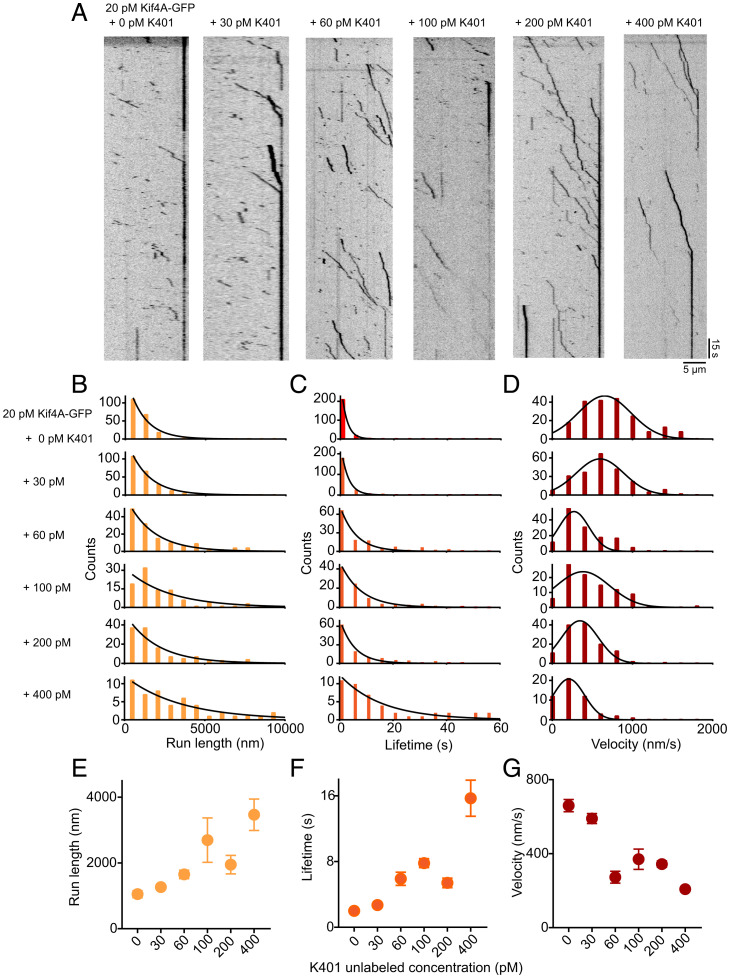
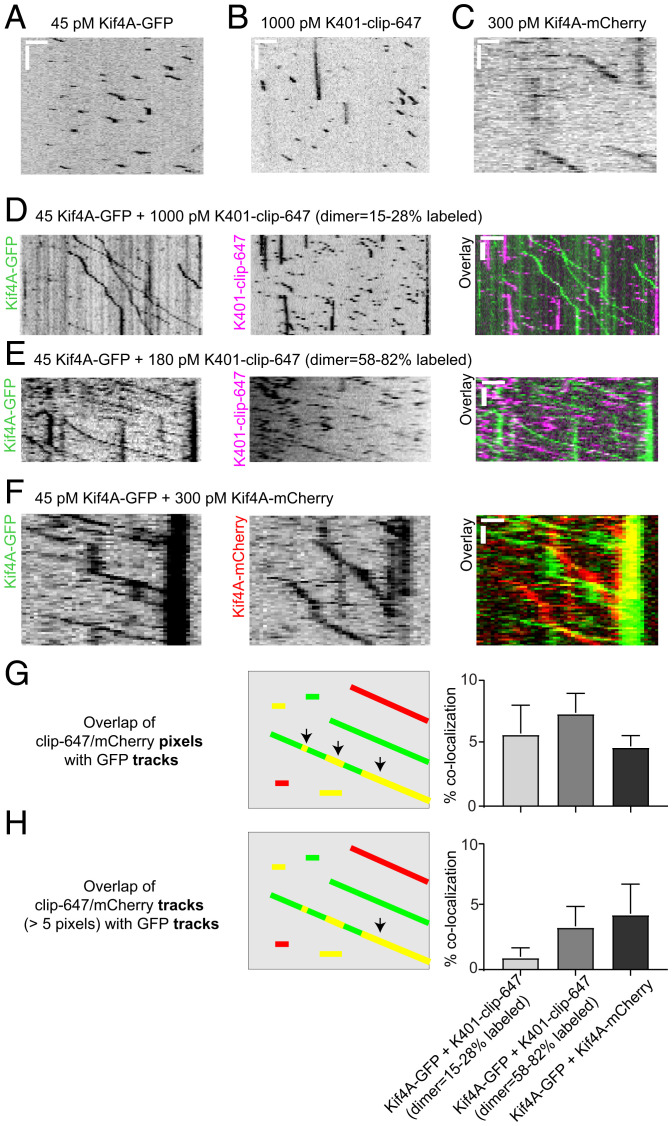
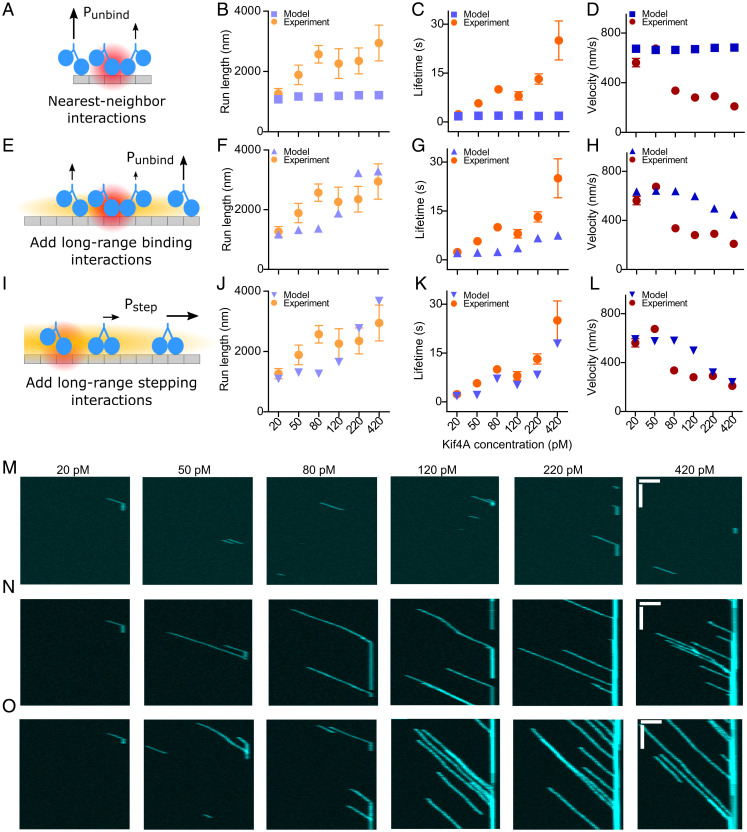
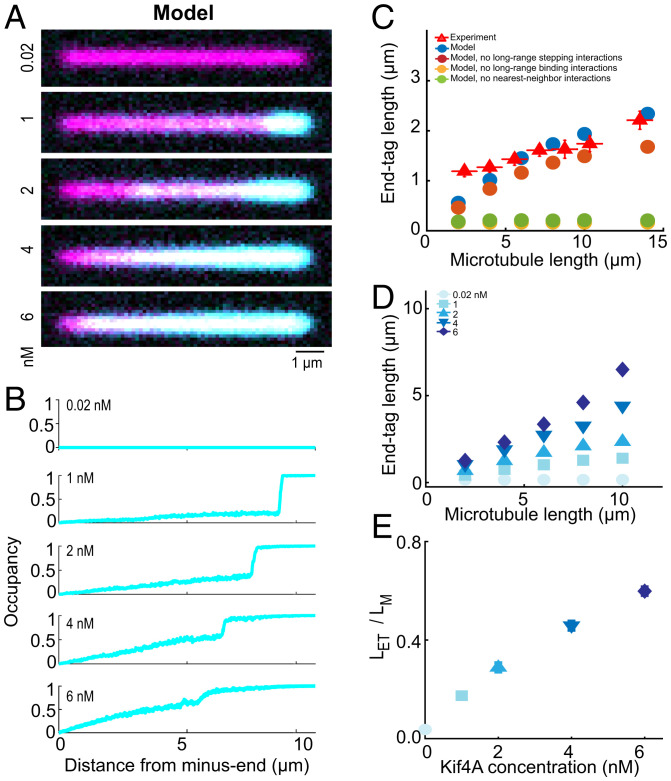
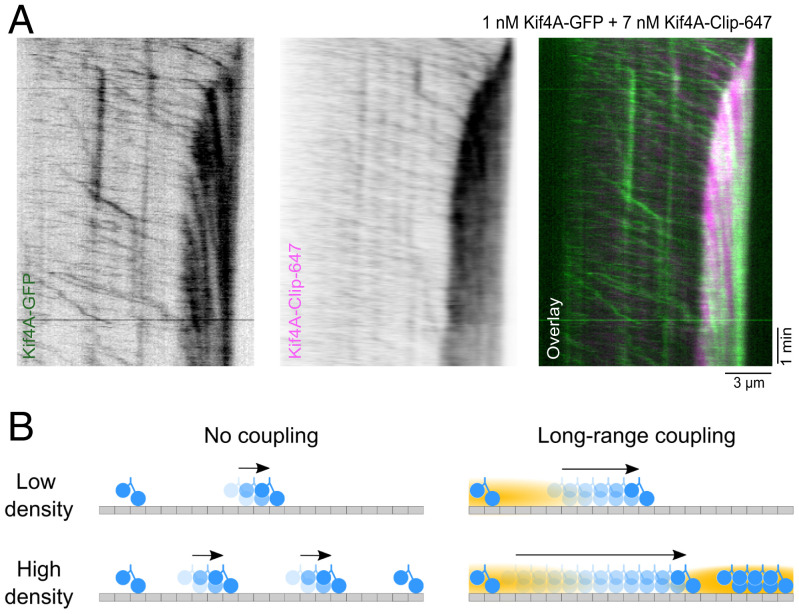
Coupling of motor proteins within arrays drives muscle contraction, flagellar beating, chromosome segregation, and other biological processes. Current models of motor coupling invoke either direct mechanical linkage or protein crowding, which rely on short-range motor-motor interactions. In contrast, coupling mechanisms that act at longer length scales remain largely unexplored. Here we report that microtubules can physically couple motor movement in the absence of detectable short-range interactions. The human kinesin-4 Kif4A changes the run length and velocity of other motors on the same microtubule in the dilute binding limit, when approximately 10-nm-sized motors are much farther apart than the motor size. This effect does not depend on specific motor-motor interactions because similar changes in Kif4A motility are induced by kinesin-1 motors. A micrometer-scale attractive interaction potential between motors is sufficient to recreate the experimental results in a biophysical model. Unexpectedly, our theory suggests that long-range microtubule-mediated coupling affects not only binding kinetics but also motor mechanochemistry. Therefore, the model predicts that motors can sense and respond to motors bound several micrometers away on a microtubule. Our results are consistent with a paradigm in which long-range motor interactions along the microtubule enable additional forms of collective motor behavior, possibly due to changes in the microtubule lattice.

Keywords: cytoskeleton; kinesin; microtubules; motors.


Conflict of interest statement

The authors declare no competing interest.

Figures

Fig. 1.
Fig. 1.
The kinesin-4 motor Kif4A forms microtubule-length–dependent end tags, but a minimal motor model does not reproduce the experimental observations. (A) Schematic of the in vitro assay used to study Kif4A-GFP (green) on single microtubules (gray). (B) Representative fluorescence micrographs showing end-tag formation with Kif4A-GFP concentration from 0.02 to 6 nM. Images show X-rhodamine–labeled microtubules (red) with Kif4A-GFP (green). (C) End-tag length versus microtubule length in assays with Kif4A-GFP concentration from 0.02 to 6 nM: 0.02 nM (slope 0.11 ± 0.02), 1 nM (slope 0.22 ± 0.02), 2 nM (slope 0.25 ± 0.03), 4 nM (slope 0.49 ± 0.02), and 6 nM (slope 0.75 ± 0.02). (D) Slope (end-tag length divided by microtubule length) versus Kif4A concentration. (E) Model overview. Motors can bind, unbind, and step, constrained by steric interactions. Inset, model mechanochemical cycle. See SI Appendix and previous work (32). (F) Simulated fluorescence images created from the model using 10-µm-long microtubules and with Kif4A concentration from 0.02 to 6 nM. (G) Simulated end-tag length versus microtubule length. (H) Slope (simulated end-tag length divided by microtubule length) versus Kif4A concentration.
Fig. 2.
Fig. 2.
Single-molecule analysis of Kif4A-GFP movement in the presence of Kif4A-unlabeled. (A) Kymographs obtained from time-lapse image sequence acquired in examining microtubule interaction of Kif4A-GFP (20 pM) in presence of 0, 30, 60, 100, 200, and 400 pM Kif4A-unlabeled. Kymographs are aligned so that the plus ends of microtubules appear on the right. (BD) Histograms of the run length (B), lifetime (C), and average velocity (D) obtained from time-lapse image sequence acquired in examining microtubule interaction of Kif4A-GFP (20 pM) in presence of 0, 30, 60, 100, 200, and 400 pM Kif4A-unlabeled. The run length and lifetime histograms were fitted to an exponential function. The average velocity histogram was fitted to a Gaussian distribution. (E) Average run length versus Kif4A concentration, obtained from the exponential fits in C: 0 pM (1,265 nm, n = 205), 30 pM (1,700 nm, n = 62), 60 pM (2,572 nm, n = 134), 100 pM (2,262 nm, n = 106), 200 pM (2,350 nm, n = 182), and 400 pM (2,946 nm, n = 78). (F) Average lifetime versus Kif4A concentration, obtained from the exponential fits in D: 0 pM (2.4 s, n = 205), 30 pM (4.3 s, n = 50, 60 pM (10 s, n = 134), 100 pM (8 s, n = 106), 200 pM (13.6 s, n = 182), and 400 pM (25 s, n = 78). (G) Average velocity versus Kif4A concentration, obtained from the Gaussian fits in E: 0 pM (562 nm/s, n = 205), 30 pM (675 nm/s, n = 43), 60 pM (336 nm/s, n = 134), 100 pM (281 nm/s, n = 106), 200 pM (291 nm/s, n = 182), and 400 pM (209 nm/s, n = 78). The error bars represent the SEM.
Fig. 3.
Fig. 3.
Single-molecule analysis of Kif4A-GFP movement in the presence of K401-unlabeled. (A) Kymographs obtained from time-lapse image sequence of microtubules with Kif4A-GFP (20 pM) in presence of 0, 30, 60, 100, 200, and 400 pM K401-unlabeled. Kymographs are aligned so that the plus ends of microtubules appear on the right. (BD) Histograms of the run length (B), lifetime (C), and average velocity (D) obtained from time-lapse image sequence of Kif4A-GFP (20 pM) in presence of 0, 30, 60, 100, 200, and 400 pM K401-unlabeled. Run length and lifetime histograms were fitted to an exponential function. The average velocity histogram was fitted to a Gaussian distribution. (E) Average run length versus K401 concentration, obtained from the exponential fit in B: 0 pM (1,050 nm, n = 202), 30 pM (1,264 nm, n = 228), 60 pM (1,650 nm, n = 140), 100 pM (2,694 nm, n = 96), 200 pM (1,949 nm, n = 129), and 400 pM (3,465 nm, n = 51). (F) Average lifetime versus K401 concentration, obtained from the exponential fit in C: 0 pM (1.5 s, n = 202), 30 pM (2.7 s, n = 228), 60 pM (5.9 s, n = 140), 100 pM (7.8 s, n = 96), 200 pM (5.4 s, n = 129), and 400 pM (15.7 s, n = 51). (G) Average velocity versus K401 concentration, obtained from the Gaussian fits in D: 0 pM (660 nm/s, n = 202), 30 pM (590 nm/s, n = 228), 60 pM (273 nm/s, n = 140), 100 pM (370 nm/s, n = 96), 200 pM (343 nm/s, n = 129), and 400 pM (208, n = 51). The error bars represent the SEM.
Fig. 4.
Fig. 4.
Single-molecule analysis of Kif4A-GFP movement in the presence of K401-clip-647 or Kif4A-mCherry. (AF) Kymographs obtained from time-lapse image sequence acquired in examining microtubule interaction of (A) 45 pM Kif4A-GFP (scale bar: x = 2 µm; y = 6 s), (B) 1,000 pM K401-clip-647 (scale bar: x = 5 µm; y = 11 s), (C) 300 pM Kif4A-mCherry (scale bar: x = 2 µm; y = 7 s), (D) 45 pM Kif4A-GFP + 1,000 pM K401-clip-647 (dimer 15 to 28% labeled) (scale bar: x = 3 µm; y = 10 s), (E) 45 pM Kif4A-GFP + 180 pM K401-clip-647 (dimer 58 to 82% labeled) (scale bar: x = 1.5 µm; y = 10 s), and (F) 45 pM Kif4A-GFP + 300 pM Kif4A-mCherry (scale bar: x = 1 µm; y = 2 s). (G and H) Two methods of quantitative analysis of the colocalization of the GFP with either K401-clip-647 or Kif4A-mCherry from the two color experiments from DF (Materials and Methods). The kymograph schematic and bar graph show percentage of colocalization of (G) clip-647/mCherry pixels with GFP tracks (Kif4A-GFP + K401-clip-647 [dimer = 15 to 28% labeled], mean 6 ± 2%, n = 11; Kif4A-GFP + K401-clip-647 [dimer = 58 to 82% labeled], 7 ± 2%, n = 32; Kif4A-GFP + Kif4A-mCherry, 5 ± 1%, n = 50) and (H) clip-647/mCherry tracks (greater than 5 pixels) with GFP tracks (Kif4A-GFP + K401-clip-647 [dimer = 15 to 28% labeled], mean 1 ± 1%, n = 24; Kif4A-GFP + K401-clip-647 [dimer = 58 to 82% labeled], 3 ± 2%, n = 20; Kif4A-GFP + Kif4A-mCherry, 5 ± 2%, n = 51). The kymograph overlay schematic shows GFP (green lines), clip-647/mCherry (red lines), and the overlap between GFP and clip-647/mCherry (yellow lines). The measured events are indicated by the black arrows. The error is the SEM.
Fig. 5.
Fig. 5.
A model with long-range interactions that affect both motor binding and stepping best reproduces the experimental results. (A) Schematic of nearest-neighbor interaction. The red cloud shows the range of the interaction (one site), and the length of arrows shows relative event probability. In the model, nearest-neighbor interactions decrease the motor unbinding rate but do not affect binding. (BD) Motor run length, lifetime, and velocity versus motor concentration for simulation (blue) and experiment (orange, red). The strength of the interaction is 2 kBT, but the simulation results are similar for interaction strength up to 10 kBT (SI Appendix, Fig. S21). (E) Schematic of long-range binding interaction. The orange cloud represents the range of the interaction (not to scale; the range in simulation is ∼1,000 binding sites). This long-range interaction affects motor binding and unbinding and is implemented in addition to the nearest-neighbor interaction. (FH) Motor run length, lifetime, and velocity versus motor concentration for simulation (blue) and experiment (orange, red). (I) Schematic of long-range stepping interaction. This long-range interaction acts to reduce overall motor velocity and is implemented in addition to both the long-range binding and nearest-neighbor interactions. (JL) Motor run length, lifetime, and velocity versus motor concentration for simulation (blue) and experiment (orange, red). (MO) Simulated kymographs with varying motor concentration and 20-pM visible motors for the model with (M) nearest-neighbor interactions only; (N) nearest-neighbor and long-range binding interactions; and (O) nearest-neighbor, long-range binding, and long-range stepping interactions. The plus ends of microtubules appear on the right. (Horizontal and vertical scale bars: 2 µm and 10 s, respectively.).
Fig. 6.
Fig. 6.
The computational model with long-range cooperativity that fits low-density experiments predicts length-dependent end tags and Kif4A motility changes with no free parameters. (A and B) Simulated fluorescence images (A) and fractional occupancy profiles (B) created from simulations using 10-µm microtubules with varying Kif4A concentration. (C) End-tag length versus microtubule length for varying models in simulation (circles) and experiment from ref. (triangles). Blue circles correspond to the final model that includes nearest-neighbor, long-range binding, and long-range stepping interactions. The other red, orange, and green circles show results of the model with one interaction removed. (D) Simulated end-tag length versus microtubule length for varying Kif4A concentration. (E) Simulated end-tag length divided by microtubule length versus Kif4A concentration. For plots CE, the data points represent the average of different values from four independent simulations. The error bars represent SEM.
Fig. 7.
Fig. 7.
Illustration of effects of long-range motor coupling. (A) Kymographs obtained from time-lapse sequence acquired in spiking experiments of Kif4A-Clip-647 (7 nM) in presence of Kif4A-GFP (1 nM) on a single microtubule. (B) Schematic shows motors (blue) moving on microtubule (gray) with interaction regions (orange cloud, not to scale). Length of arrows represents motor run length (not to scale). (Top Left) Noninteracting motors do not affect the run length or velocity of other motors. (Top Right) Long-range interactions mean that Kif4A changes the run length and velocity of widely separated motors on the same microtubule. Our theory suggests that this long-range coupling affects not only binding kinetics, but also motor mechanochemistry. (Bottom Left) Noninteracting motors do not change their motility or collective behavior at higher density. (Bottom Right) Long-range coupling promotes the formation of Kif4A end tags at high density. The microtubule therefore responds dynamically to motor binding and alters the behavior of other motors, allowing new forms of collective motor behavior.

Similar articles

Cited by

References

    1. Huxley H. E., Brown W., The low-angle x-ray diagram of vertebrate striated muscle and its behaviour during contraction and rigor. J. Mol. Biol. 30, 383–434 (1967). - PubMed
    1. Craig R., Woodhead J. L., Structure and function of myosin filaments. Curr. Opin. Struct. Biol. 16, 204–212 (2006). - PubMed
    1. Gibbons I. R., Rowe A. J., Dynein: A protein with adenosine triphosphatase activity from cilia. Science 149, 424–426 (1965). - PubMed
    1. Mitchison T. J., Mitchison H. M., Cell biology: How cilia beat. Nature 463, 308–309 (2010). - PubMed
    1. Kozminski K. G., Johnson K. A., Forscher P., Rosenbaum J. L., A motility in the eukaryotic flagellum unrelated to flagellar beating. Proc. Natl. Acad. Sci. U.S.A. 90, 5519–5523 (1993). - PMC - PubMed

Publication types

LinkOut - more resources