

Effect of molecular size on interstitial pharmacokinetics and tissue catabolism of antibodies
- PMID: 35867780
- PMCID: PMC9311319
- DOI: 10.1080/19420862.2022.2085535
Effect of molecular size on interstitial pharmacokinetics and tissue catabolism of antibodies
Abstract
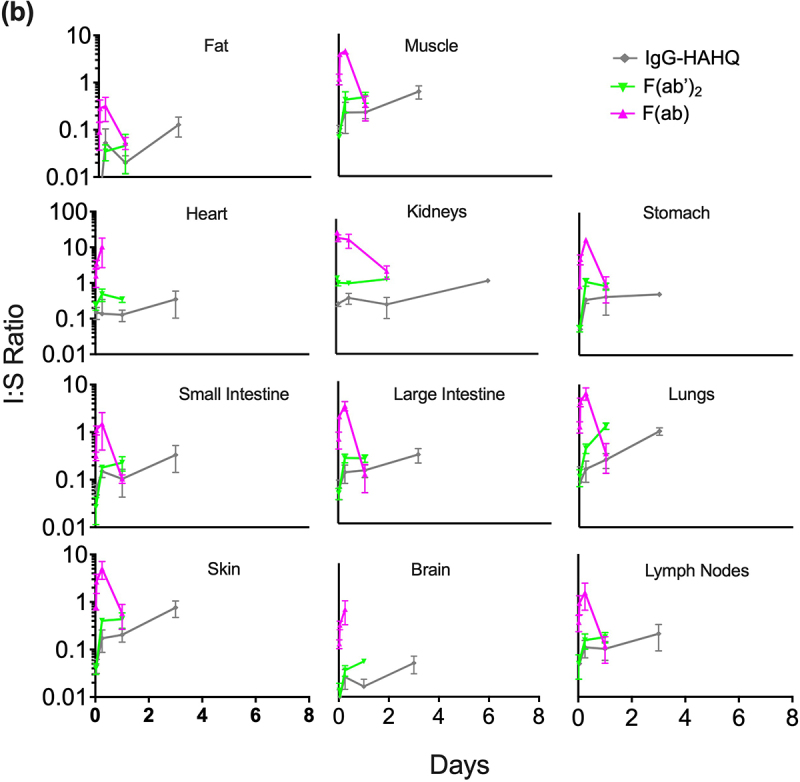
Advances in antibody engineering have enabled the construction of novel molecular formats in diverse shapes and sizes, providing new opportunities for biologic therapies and expanding the need to understand how various structural aspects affect their distribution properties. To assess the effect of antibody size on systemic pharmacokinetics (PK) and tissue distribution with or without neonatal Fc receptor (FcRn) binding, we evaluated a series of non-mouse-binding anti-glycoprotein D monoclonal antibody formats, including IgG [~150 kDa], one-armed IgG [~100 kDa], IgG-HAHQ (attenuated FcRn binding) [~150 kDa], F(ab')2 [~100 kDa], and F(ab) [~50 kDa]. Tissue-specific concentration-time profiles were corrected for blood content based on vascular volumes and normalized based on interstitial volumes to allow estimation of interstitial concentrations and interstitial:serum concentration ratios. Blood correction demonstrated that the contribution of circulating antibody on total uptake was greatest at early time points and for highly vascularized tissues. Tissue interstitial PK largely mirrored serum exposure profiles. Similar interstitial:serum ratios were obtained for the two FcRn-binding molecules, IgG and one-armed IgG, which reached pseudo-steady-state kinetics in most tissues. For non-FcRn-binding molecules, interstitial:serum ratios changed over time, suggesting that these molecules did not reach steady-state kinetics during the study. Furthermore, concentration-time profiles of both intact and catabolized molecule were measured by a dual tracer approach, enabling quantification of tissue catabolism and demonstrating that catabolism levels were highest for IgG-HAHQ. Overall, these data sets provide insight into factors affecting preclinical distribution and may be useful in estimating interstitial concentrations and/or catabolism in human tissues.
Keywords: Monoclonal antibody (mAb); distribution; interstitial; neonatal Fc receptor (FcRn); pharmacokinetics; size; tissue.
Conflict of interest statement
All authors were employees of Genentech, a member of the Roche Group, at the time they contributed to the experiments in this manuscript.
Figures


Similar articles
-
Are endosomal trafficking parameters better targets for improving mAb pharmacokinetics than FcRn binding affinity?Mol Immunol. 2013 Dec;56(4):660-74. doi: 10.1016/j.molimm.2013.05.008. Epub 2013 Aug 2. Mol Immunol. 2013. PMID: 23917469 Review.
-
Changes in complementarity-determining regions significantly alter IgG binding to the neonatal Fc receptor (FcRn) and pharmacokinetics.MAbs. 2018 Jan;10(1):81-94. doi: 10.1080/19420862.2017.1389355. Epub 2017 Nov 3. MAbs. 2018. PMID: 28991504 Free PMC article.
-
Quantitative cumulative biodistribution of antibodies in mice: effect of modulating binding affinity to the neonatal Fc receptor.MAbs. 2014 May-Jun;6(3):689-96. doi: 10.4161/mabs.28254. Epub 2014 Feb 26. MAbs. 2014. PMID: 24572100 Free PMC article.
-
Physiologically-based pharmacokinetic (PBPK) model to predict IgG tissue kinetics in wild-type and FcRn-knockout mice.J Pharmacokinet Pharmacodyn. 2007 Oct;34(5):687-709. doi: 10.1007/s10928-007-9065-1. Epub 2007 Jul 18. J Pharmacokinet Pharmacodyn. 2007. PMID: 17636457
-
Neonatal Fc receptor (FcRn): a novel target for therapeutic antibodies and antibody engineering.J Drug Target. 2014 May;22(4):269-78. doi: 10.3109/1061186X.2013.875030. Epub 2014 Jan 9. J Drug Target. 2014. PMID: 24404896 Review.
Cited by
-
Flycodes enable simultaneous preclinical analysis for dozens of antibodies in single cassette-dosed mice.Proc Natl Acad Sci U S A. 2025 Mar 25;122(12):e2426481122. doi: 10.1073/pnas.2426481122. Epub 2025 Mar 17. Proc Natl Acad Sci U S A. 2025. PMID: 40096612
-
A Bispecific Modeling Framework Enables the Prediction of Efficacy, Toxicity, and Optimal Molecular Design of Bispecific Antibodies Targeting MerTK.AAPS J. 2024 Jan 2;26(1):11. doi: 10.1208/s12248-023-00881-8. AAPS J. 2024. PMID: 38167740
-
Unveiling CD59-Antibody Interactions to Design Paratope-Mimicking Peptides for Complement Modulation.Int J Mol Sci. 2023 May 10;24(10):8561. doi: 10.3390/ijms24108561. Int J Mol Sci. 2023. PMID: 37239905 Free PMC article.
-
A minimal physiologically based pharmacokinetic model to study the combined effect of antibody size, charge, and binding affinity to FcRn/antigen on antibody pharmacokinetics.J Pharmacokinet Pharmacodyn. 2024 Oct;51(5):477-492. doi: 10.1007/s10928-023-09899-z. Epub 2024 Feb 24. J Pharmacokinet Pharmacodyn. 2024. PMID: 38400996 Free PMC article.
-
A novel approach to quantitate biodistribution and transduction of adeno-associated virus gene therapy using radiolabeled AAV vectors in mice.Mol Ther Methods Clin Dev. 2024 Aug 19;32(3):101326. doi: 10.1016/j.omtm.2024.101326. eCollection 2024 Sep 12. Mol Ther Methods Clin Dev. 2024. PMID: 39286334 Free PMC article.
References
MeSH terms
Substances
LinkOut - more resources
Full Text Sources
Research Materials