. 2022 Jul 22;8(29):eabm2411.
doi: 10.1126/sciadv.abm2411. Epub 2022 Jul 22.

Spatiotemporal gating of Stat nuclear influx by Drosophila Npas4 in collective cell migration

Affiliations

Spatiotemporal gating of Stat nuclear influx by Drosophila Npas4 in collective cell migration

Jhen-Wei Wu et al. Sci Adv. .

Abstract

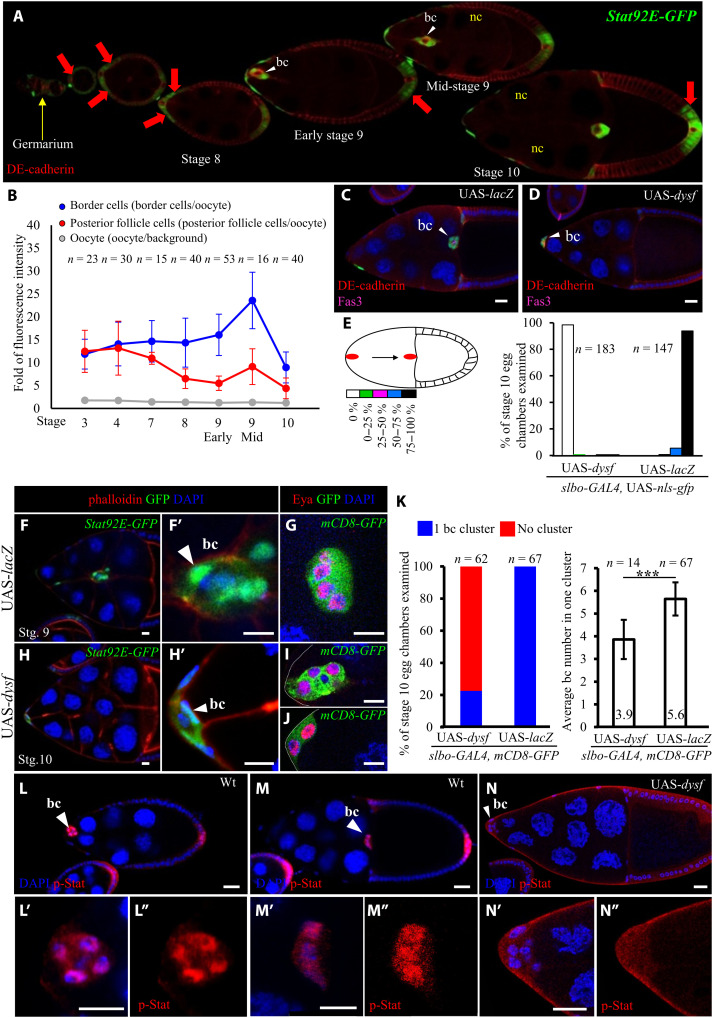
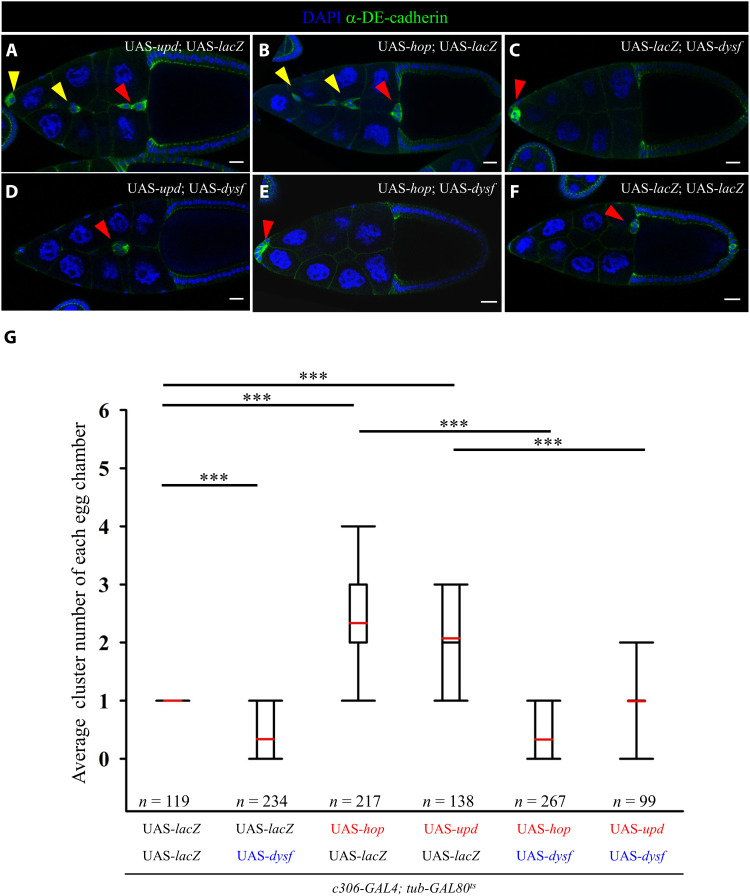
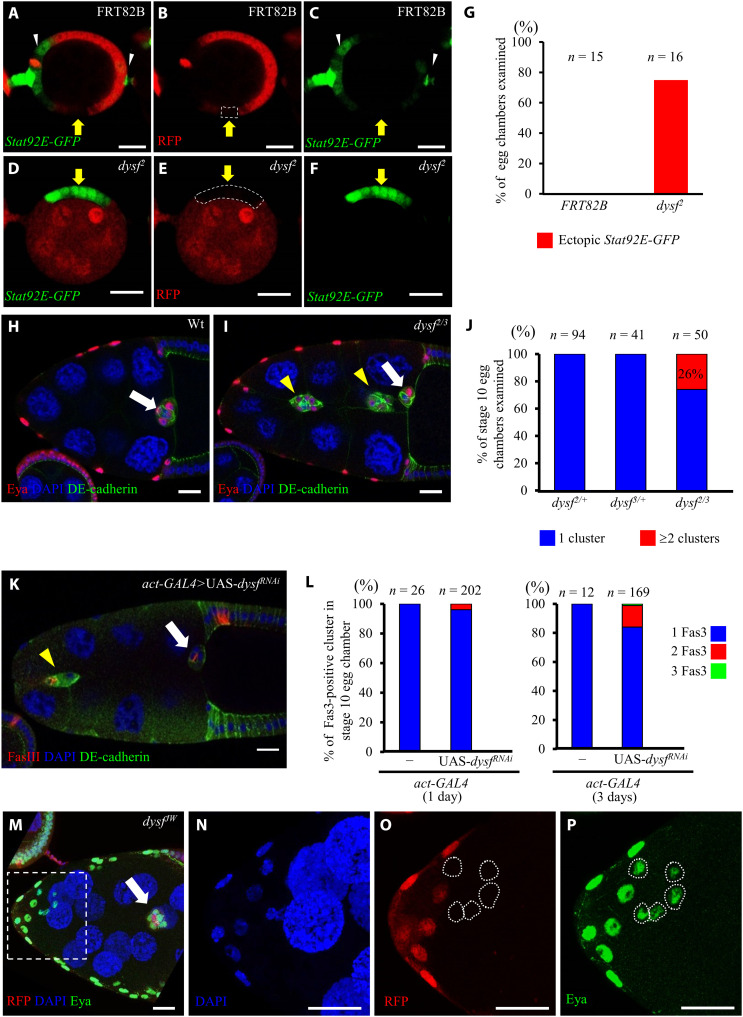
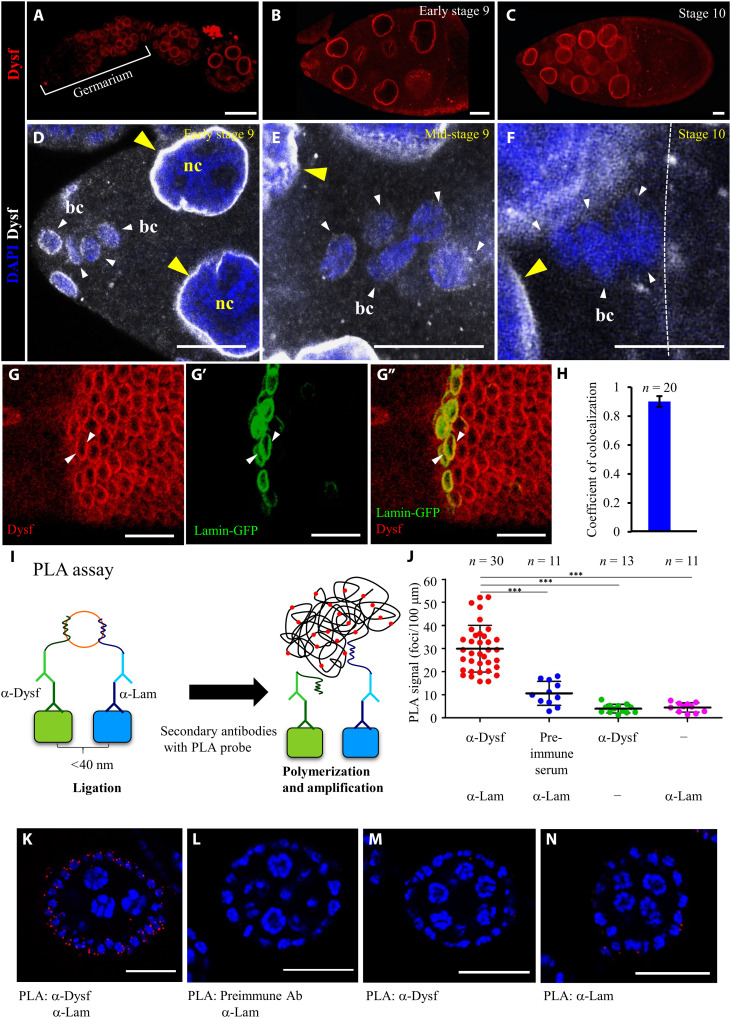
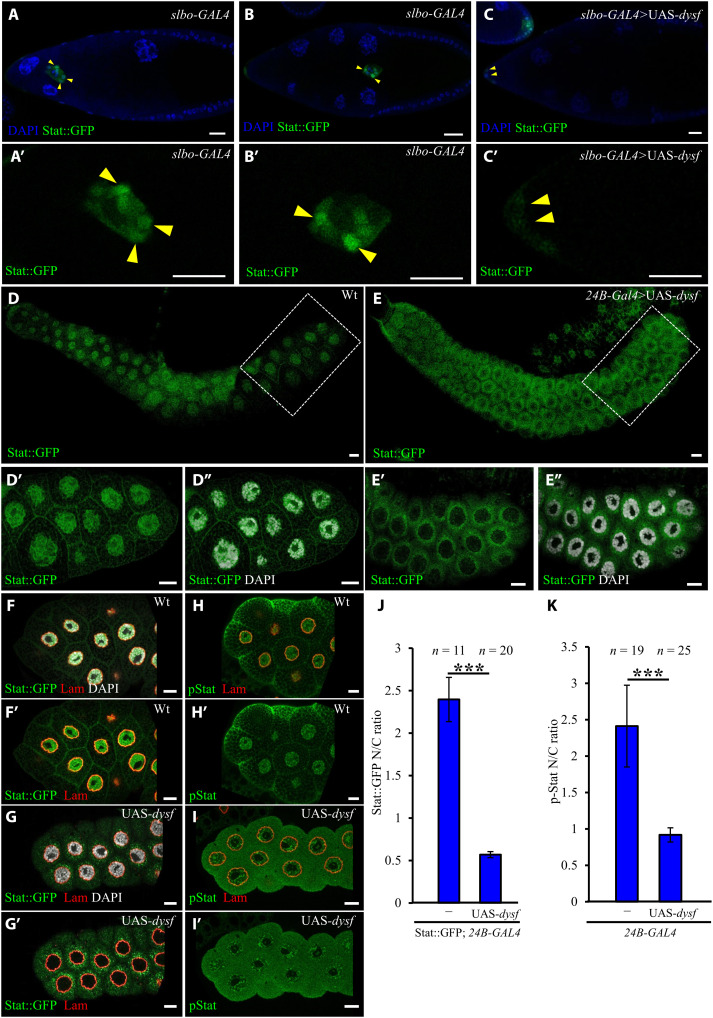
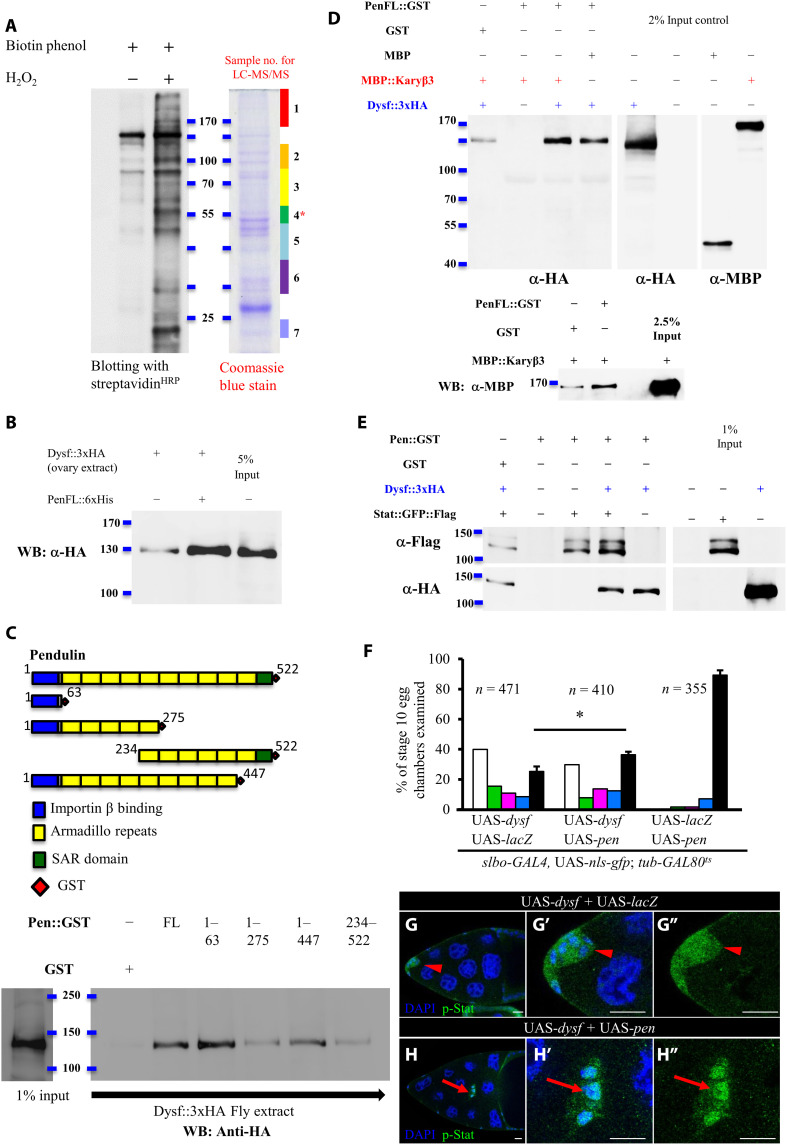
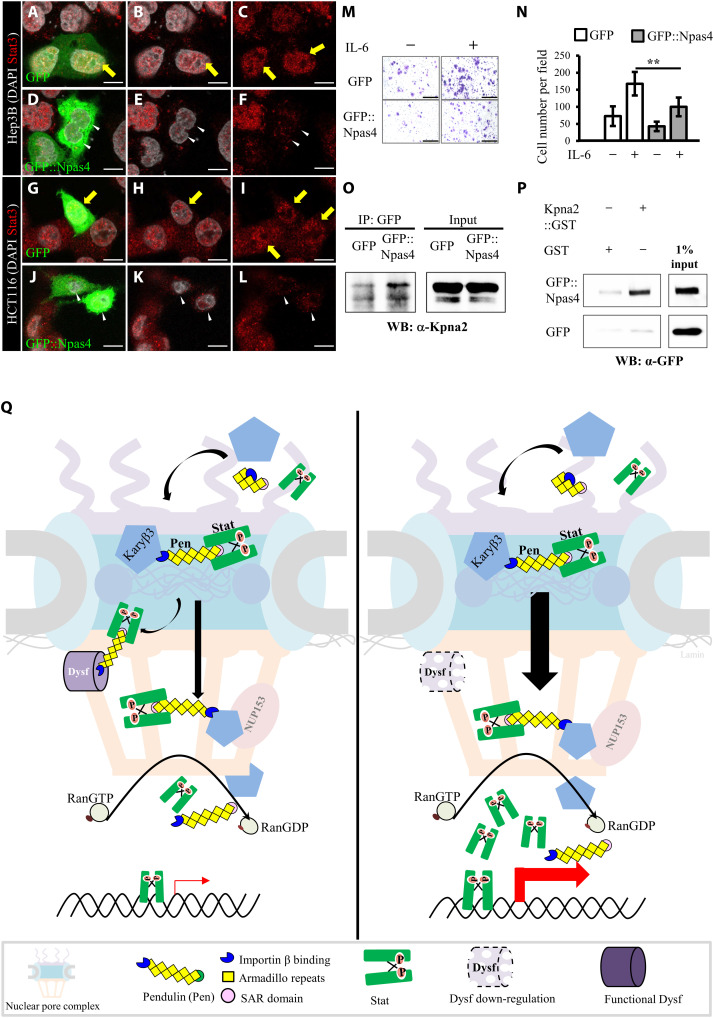
Collective migration is important to embryonic development and cancer metastasis, but migratory and nonmigratory cell fate discrimination by differential activity of signal pathways remains elusive. In Drosophila oogenesis, Jak/Stat signaling patterns the epithelial cell fates in early egg chambers but later renders motility to clustered border cells. How Jak/Stat signal spatiotemporally switches static epithelia to motile cells is largely unknown. We report that a nuclear protein, Dysfusion, resides on the inner nuclear membrane and interacts with importin α/β and Nup153 to modulate Jak/Stat signal by attenuating Stat nuclear import. Dysfusion is ubiquitously expressed in oogenesis but specifically down-regulated in border cells when migrating. Increase of nuclear Stat by Dysfusion down-regulation triggers invasive cell behavior and maintains persistent motility. Mammalian homolog of Dysfusion (NPAS4) also negatively regulates the nuclear accumulation of STAT3 and cancer cell migration. Thus, our finding demonstrates that Dysfusion-dependent gating mechanism is conserved and may serve as a therapeutic target for Stat-mediated cancer metastasis.


Figures

Fig. 1.
Fig. 1.. Dysf represses Jak/Stat signaling during Drosophila oogenesis.
Confocal micrographs of Drosophila egg chambers showing border cells (bc; arrowheads) migrating through nurse cells (nc). Anti–DE-cadherin staining [red in (A), (C), and (D)] labels cell margins, and DAPI (4′,6-diamidino-2-phenylindole; blue) marks nuclei. All UAS transgenes were driven by slbo-GAL4. (A) The Stat92E-GFP reporter (green) reveals Stat activity during Drosophila oogenesis from the germarium (yellow arrow) to egg chambers (red arrow). (B) Fluorescence intensity of Stat92E-GFP in Drosophila oogenesis. (C and D) Dysf overexpression impairs border cell migration. Fasciclin 3 (Fas3; magenta) staining labels polar cells. (E) Quantification of migration defect caused by dysf overexpression. The migration path is divided into five sections to quantify the extent of border cell migration. (F and H) Dysf overexpression reduced border cell number in the cluster. Stat92E-GFP signal marks border cells (white arrowheads), and phalloidin staining (red) labels cell margins. (G, I, and J) slbo-GAL4>UAS-mCD8gfp marks the cluster morphology, and anti-Eya labels anterior follicle cells. (K) Quantification of Dysf effect on border cells. (L and M) Anti–p-Stat staining (red) displays nuclear accumulation in border cells. Wt, wild type. (N) Dysf overexpression reduced p-Stat accumulation in border cell nuclei. n represents the number of egg chambers examined; ***P < 0.001, two-tailed t test. Error bars indicate SD. Scale bars, 20 μm.
Fig. 2.
Fig. 2.. Dysf suppresses the hyperactive Jak/Stat phenotype in border cells.
(A to F) Confocal micrographs showing border cell clusters (red arrowheads) in stage 10 egg chambers of the indicated genotypes. Anti–DE-cadherin staining (green) and DAPI (blue) mark cell margins and nuclei, respectively. Overexpression of upd or hop induces extra border cell clusters (A and B, yellow arrowheads). Egg chambers coexpressing dysf with upd or hop have one border cell cluster displaying migration delay (D and E), similar to the phenotype arising from dysf expression (C). Double UAS-lacZ serves as the control (F). (G) Quantitative assessment of the number of migrating clusters with indicated genotypes. n represents the total number of egg chambers examined; ***P < 0.001, two-tailed t test. The box plot shows the medians (black lines), means (red lines), the 25th and 75th range (boxes), and the 5th and 95th percentiles (whiskers). Scale bars, 20 μm.
Fig. 3.
Fig. 3.. Down-regulation of dysf results in recruitment of extra border cells.
(A to C) Immunofluorescence micrographs showing Stat92E-GFP (green) expression patterns in egg chambers. White arrowheads indicate egg chamber terminals. (D to F) The dysf2 mutant clone [red fluorescence protein (RFP)–negative; dotted circle] presents ectopic Stat92E-GFP signal (yellow arrows) relative to control clones [yellow arrows in (A) to (C)]. (G) Quantification of ectopic Stat92E-GFP in indicated genotypes. (H and I) dysf2/3 displays multiple border cell clusters (yellow arrowheads). (J) Quantification of extra border cells in dysf2/3. (K) Knocking down dysf induced extra border cell clusters (yellow arrowheads). Anti-FasIII labels polar cells. (L) Quantification of ectopic cluster formation by dysf RNAi knockdown. Colors indicate the border cell cluster number. (M to P) Three-dimensional projection exhibits freely migrating border cells (white arrow) under dysfJW mutation (RFP-negative; white outline). All white arrows indicate border cells reaching the oocyte border. Enlargements of the boxed region are shown in (N) to (P). Anti-Eya stains follicle cells and border cells [red in (H) and (I); green in (M) and (P)]. DE-cadherin staining (green) labels cell margins (H, I, and K). DAPI (blue) marks all nuclei. Scale bars, 20 μm.
Fig. 4.
Fig. 4.. The nuclear membrane of border cells displays a gradual decline in Dysf expression.
(A to G) Immunofluorescence micrographs showing anti-Dysf staining during Drosophila oogenesis [red in (A) to (C), (G), and (G″); white in (D) to (F)]. Arrowheads indicate nuclear membrane staining of Dysf in border cells (white) and nurse cells (yellow) in early stage 9 (D), mid-stage 9 (E), and stage 10 (F) egg chambers. The dotted white line denotes the oocyte border. (G to G″) Colocalization of anti-Dysf staining (red) and Lamin-GFP (green) signals on nuclear membrane in main-body follicles (arrowheads). (H) Colocalization coefficient for Dysf and Lamin-GFP. n indicates the number of nuclei examined. (I) Schematic illustrating detection of the Dysf-Lamin interaction by proximity ligation assay (PLA). (J) Quantifications of PLA signals using the indicated antibodies. The line boundaries show the SD of signal distributions, with the midline marking the average. (K to N) Confocal micrographs of egg chambers showing PLA reactions (red) with indicated antibodies. DAPI (blue) labels nuclei. n represents total sample size; ***P < 0.001, two-tailed t test. Error bars indicate SD. Scale bars, 25 μm (A to F) and 20 μm (G and K to N).
Fig. 5.
Fig. 5.. Suppression of Stat nuclear import upon Dysf overexpression.
(A to C) Confocal images of GFP-tagged Stat distribution (green) in stage 9 or 10 egg chambers stained with DAPI (blue) to mark nuclei. Border cells indicated by arrowheads are shown below at higher magnification (A′ to C′). Stat::GFP expression (green) (D to G) and anti–p-Stat staining (H and I) in the salivary glands of the indicated genotypes, as revealed by immunofluorescence staining, and boxed regions are enlarged and displayed below. DAPI labels nuclei (white), and anti-Lamin (red) staining defines the boundary between the nucleus and cytoplasm. Quantitative assessment of the impact of Dysf on Stat nuclear localization by examining the nucleus:cytoplasm ratio of Stat::GFP (J) or anti–p-Stat (K) fluorescence signal. n indicates the number of salivary glands examined; ***P < 0.001, two-tailed t test. Error bars indicate SD. Scale bars, 20 μm.
Fig. 6.
Fig. 6.. Dysf-Pen interaction regulates Stat nuclear import.
(A) Biotinylated proteins were pulled down by streptavidin beads and detected by streptavidinHRP. SDS–polyacrylamide gel electrophoresis (PAGE) gels subjected to LC-MS/MS analysis were stained with Coomassie blue. (B) Pull-down assay validated the interaction between Dysf and Pen. (C) Schematic showing full-length and truncated Pen proteins with known domains. GST pull-down assay (bottom) demonstrated interaction of Dysf with Pen variant proteins. (D and E) GST pull-down assay revealed the impacts of Karyβ3 (D) or Stat (E) on Dysf-Pen association. (F) Quantification of border cell migration defects in indicated genotypes. Coexpression of pen partially rescues dysf-induced migration defect. (G and H) Fluorescence micrographs of stage 10 egg chambers stained with anti–p-Stat (green) and DAPI (blue). Arrowheads indicate an even distribution of p-Stat under the condition of Dysf overexpression (G to G″). Arrows highlight nuclear accumulation of p-Stat in cells coexpressing dysf and pen (H to H″). n is the total number of egg chambers examined; *P < 0.05, two-tailed t test. Error bars indicate SD. Scale bars, 20 μm.
Fig. 7.
Fig. 7.. The human homolog of Dysf, Npas4, impairs Stat3 nuclear localization and cancer cell migration.
Confocal images of cancer cells stained with anti-Stat3 antibodies (red) and DAPI (white). After IL-6 stimulation, control cells transfected with GFP (green) revealed an accumulation of Stat3 in nuclei [yellow arrows in (A) to (C) and (G) to (I)]. Transfection of GFP::Npas4 (green) led to a lack of Stat3 signal in nuclei [white arrowheads in (D) to (F) and (J) to (L)]. (M) Crystal violet–stained (purple) Hep3B cells that crossed the transwell chamber membrane. (N) Quantification of our transwell migration assay (**P < 0.01, two-tailed t test; error bars indicate SEM). (O) Coimmunoprecipitation analysis demonstrated Npas4-Kpna2 interaction. (P) GST pull-down assay confirmed Npas4-Kpna2 interaction. (Q) Model of how Dysf gates nuclear import of Stat. Dysf protein resides on the inner nuclear membrane and binds to Pen via its IBB domain. Left: By stage 9, Dysf-Pen interaction reduces nuclear translocation of Stat. Right: In border cells, the gradual decrease of Dysf releases the constraint on Stat nuclear influx, inducing higher signaling activity and leading to cluster formation that maintains persistent migration. Nup153 serves as an additional gatekeeper modulating nuclear shuttling of Stat in border cells. Scale bars, 10 μm (A to L) and 500 μm (M).

Similar articles

Cited by

References

    1. Stuelten C. H., Parent C. A., Montell D. J., Cell motility in cancer invasion and metastasis: Insights from simple model organisms. Nat. Rev. Cancer 18, 296–312 (2018). - PMC - PubMed
    1. Welch D. R., Hurst D. R., Defining the hallmarks of metastasis. Cancer Res. 79, 3011–3027 (2019). - PMC - PubMed
    1. Guglielmi V., Sakuma S., D’Angelo M. A., Nuclear pore complexes in development and tissue homeostasis. Development 147, (2020). - PMC - PubMed
    1. Hogarth C., Itman C., Jans D. A., Loveland K. L., Regulated nucleocytoplasmic transport in spermatogenesis: A driver of cellular differentiation? Bioessays 27, 1011–1025 (2005). - PubMed
    1. Raices M., Bukata L., Sakuma S., Borlido J., Hernandez L. S., Hart D. O., D’Angelo M. A., Nuclear pores regulate muscle development and maintenance by assembling a localized Mef2C complex. Dev. Cell 41, 540–554.e7 (2017). - PMC - PubMed

MeSH terms

Substances

LinkOut - more resources