. 2022 Jul 22;7(73):eabo2787.
doi: 10.1126/sciimmunol.abo2787. Epub 2022 Jul 22.

TREM2 macrophages induced by human lipids drive inflammation in acne lesions

Affiliations

TREM2 macrophages induced by human lipids drive inflammation in acne lesions

Tran H Do et al. Sci Immunol. .

Abstract

Acne affects 1 in 10 people globally, often resulting in disfigurement. The disease involves excess production of lipids, particularly squalene, increased growth of Cutibacterium acnes, and a host inflammatory response with foamy macrophages. By combining single-cell and spatial RNA sequencing as well as ultrahigh-resolution Seq-Scope analyses of early acne lesions on back skin, we identified TREM2 macrophages expressing lipid metabolism and proinflammatory gene programs in proximity to hair follicle epithelium expressing squalene epoxidase. We established that the addition of squalene induced differentiation of TREM2 macrophages in vitro, which were unable to kill C. acnes. The addition of squalene to macrophages inhibited induction of oxidative enzymes and scavenged oxygen free radicals, providing an explanation for the efficacy of topical benzoyl peroxide in the clinical treatment of acne. The present work has elucidated the mechanisms by which TREM2 macrophages and unsaturated lipids, similar to their involvement in atherosclerosis, may contribute to the pathogenesis of acne.


Conflict of interest statement

Competing interests: Authors declare no competing interests.

Figures

Fig. 1.
Fig. 1.. Cell Types Recovered in Lesional and Non-lesional Acne
a. UMAP plot for 62,168 cells from acne patients colored by cell type. b. UMAP plot for 62,168 cells colored by lesional types with 32,966 cells from lesional skin and 29,202 cells from non-lesional skin. Lesional cells are shown in red while non-lesional cells are shown in blue. c. Stacked bar-plot showing the donor and lesion type composition for each of the cell types. Lesional cells are shown in red while non-lesional cells are shown in blue. d. UMAP plot for 4,370 myeloid cells from acne patients colored by cell types. e. UMAP plot for 4,370 myeloid cells colored by lesional types with 3,152 myeloid cells from lesional skin and 1,218 myeloid cells from non-lesional skin. Lesional cells are shown in red while non-lesional cells are shown in blue. f. Stacked bar-plot showing the donor and lesion type composition for each of the cell types. Lesional cells are shown in red while non-lesional cells are shown in blue. g. UMAP plot for 8,271 KCs from acne patients colored by cell types. h. UMAP plot for 8,271 keratinocytes colored by lesional types with 4,473 keratinocytes from lesional skin and 3,798 keratinocytes from non-lesional skin. Lesional cells are shown in red while non-lesional cells are shown in blue. i. Stacked bar-plot showing the donor and lesion type composition for each of the cell types. Lesional cells are shown in red while non-lesional cells are shown in blue.
Fig. 2
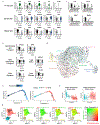
Fig. 2. Characterization of TREM2 Macrophages
a. Violin plots showing the normalized expression levels for genes in macrophage sub-clusters. b. Violin plots showing normalized expression of categories of lipid processing genes based on gene ontology categories. c. Jitter plots showing normalized expression of macrophage sub-clusters separated by lesional versus non-lesional cells. d. Velocity field projected onto the UMAP plot of myeloid cells using the velocity_embedding_stream function. All scVelo functions were used with default parameters. Cells colored based on cell type as represented in Fig. 1d. e. Pseudotime trajectory generated by Monocle2 of TREM2 and M2-like macrophage subcluster. (Left) A total of 1,975 cells were imported from Seurat data are colored according to the pseudotime dark blue to light blue. (Right) Trajectory showing the distribution of cells colored based on cell type. f. Scatter plot showing the correlation between TREM2 and M2-like macrophage pseudotimes and module scores calculated using transcriptional profiles from CD163+ Macrophage and TREM2 Macrophage as described in Peters, J.M. et. al bioRxiv scRNA-seq studies of lung. The color of the dots represents the subcluster identity of the cells. g. (Far Left) UMAP plot for 1,975 cells of TREM2 and M2-like macrophage. (Right) Co-expression of inflammatory genes (CCL18, IL18, S100A8, S100A9) in red and TREM2 score (APOE, CTSB, TREM2, CD68, GPNMB, LPL, SPP1, LGALS3, TYROBP) via AddModuleScore function in Seurat in green with co-expression in yellow via Seurat FeaturePlot function with blend=T and blend.threshold = 0.5.
Fig. 3.
Fig. 3.. KCs in the hair follicles present in acne lesions is capable of squalene synthesis
a. Violin plots showing the normalized expression levels of FDFT1 (squalene synthase) and SQLE (squalene epoxidase) for keratinocyte sub-clusters. b. Representative immunohistochemistry staining of FDFT1, SQLE, TREM2 encoded protein (n=3) showing hair follicle (black arrow), sebocytes (yellow arrow), and TREM2+ cells (red arrow). Acne skin samples were obtained from papules of acne patients and controls were from healthy skin on the scalp. Scale bar = 100 μm. c. (Top Left) H & E staining of the acne biopsy used for spatial sequencing. (Top Right) Scatter pie plot showing the cell type composition of the acne spatial-seq sample. Each spot is represented as a pie chart showing the relative proportion of the cell types. (Bottom Left) Spatial plot showing the expression of hair follicle score, which is the sum of KRT6C, KRT6B, KRT17 expression. (Bottom Right) Spatial plot showing the expression of SQLE and TREM2 score, which is the sum of APOE, CTSB, TREM2, CD68, GPNMB, LPL, SPP1, LGALS3, TYROBP expression. d. (Left) H&E staining of the acne biopsy used for Seq-Scope analysis. (Middle) Spatial plot used to visualize cell types clusters of 5mm-sided square grids with an average of 145 genes and 167 transcripts across 3,558 grids in an acne lesion. (Right) Boxed region showing the magnified spatial plot with 1um intervals between grids. e. Spatial plot showing overlay of KRT5 in blue, APOE in red, and KRT16 in green with 2um intervals between grids. f. Representative immunofluorescence staining in lesional acne skin biopsy samples for expression of TREM2 in red, C. acnes in green, and colocalization in yellow (n=4 acne, n=2 normal skin). Scale bar = 20 μm.
Fig. 4.
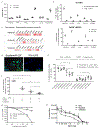
Fig. 4.. Squalene Induce TREM2 Expression in Macrophages in vitro and blocks oxidative killing of C. acnes.
a. Geometric mean fluorescence intensity (MFI) of TREM2 expression with the different stimuli with and without M-CSF (n=3). Results are shown as mean ± SEM. P-values were calculated using unpaired Student’s t-test of the cytokine-treated sample compared to the media sample (with or without MCSF). ns = not significant, * = p-value < 0.05, ** = p-value < 0.01. b. (Top) Real-time PCR of fold change of relative gene expression to GAPDH on in vitro macrophages (n=3). Results are shown as mean ± SEM. (Bottom) scRNA-seq average percent of cell expressing lipid genes for donor with more than 10 cells expressing the marker genes in acne lesion. Results are shown as mean ± SEM. c. Gene expression of the top 10 signature genes for TREM2 macrophages, M1-like macrophages and M2-like macrophages from acne lesions in all cells from the in vitro derived macrophages. d. Immunocytochemical staining of in vitro stimulated macrophages. DAPI is in blue and BODIPY is in green. Scale bar = 20 μm. e. Macrophages were stimulated with IFN-γ + LPS with and without squalene for 24 hours or MCSF with and without squalene for 48 hours. Macrophages were then activated with different C. acnes strains for 24 hours. Antimicrobial activity was calculated by subtracting 24-hour CFU (colony counting unit) count with 1-hour CFU count and divide by CFU at 24-hour to determine the percentage of killing of each C. acnes strain. Results are shown as mean ± SEM. P-values were calculated using unpaired Student’s t-test of the antimicrobial activity against phylotype IA1 C. acnes strains compared to the antimicrobial activity against phylotype II C. acnes strains. * = p-value < 0.05, ** = p-value < 0.01. f. Macrophages were stimulated with IFN-γ + LPS with and without squalene for 24 hours or MCSF with and without squalene for 48 hours. Macrophages were then activated with C. acnes (HL005PA1) for 24 hours. Antimicrobial activity was calculated by subtracting 24-hour CFU (colony counting unit) count with 1-hour CFU count and divide by CFU at 24-hour to determine the percentage of killing. Results are shown as mean ± SEM (n=7). P-values were calculated using unpaired Student’s t-test of the antimicrobial activity of IFN-γ + LPS or M-CSF macrophages against C. acnes strains compared to the antimicrobial activity of IFN-γ + LPS with squalene or M-CSF with squalene against C. acnes. * = p-value < 0.05, ** = p-value < 0.01. g. C. acnes were stimulated with diethylenetriamine NONOate (DETA NONOate), alkyl peroxide tertiary-butyl hydroperoxide (TBHP), and hydrogen peroxide (H2O2-) at varying concentration for 2 hours. CFUs were plotted for each concentration (n=3). P-values were calculated using unpaired Student’s t-test of the C. acnes CFU of each treatment (DETA NONOate or TBHP) compared to the C. acnes CFU of H2O2. * = p-value < 0.05, ** = p-value < 0.01. h. C. acnes were stimulated with alkyl peroxide tertiary-butyl hydroperoxide (TBHP) at varying concentration with media, N-acetyl cysteine (NAC), or squalene for 2 hours. CFUs were plotted for each concentration (n=3). P-values were calculated using unpaired Student’s t-test of the C. acnes CFU of each treatment (NAC or squalene) compared to the C. acnes CFU of untreated. * = p-value < 0.05, ** = p-value < 0.01.
Fig. 5.
Fig. 5.. Graphical Summary of Acne Inflammation with Squalene Upregulating TREM2 expression on Macrophages.
Our data showed that squalene, found abundant in acne lesions, upregulates the expression of TREM2 on macrophages. TREM2 expression enhances the phagocytic capacity of the macrophages to uptake lipids and bacteria, but do not have significant antimicrobial functions due to the ability of squalene to scavenge ROS (reactive oxygen species) as well as the downregulate enzymes in generation of reactive oxygen species and their response. Although squalene inhibits TREM2 macrophages antimicrobial activity, TREM2 macrophages contribute to inflammation by upregulating expression of pro-inflammatory chemokines, cytokines, MMPs, and S100 proteins to recruit and activate immune cells.

References

    1. Hay RJ et al., The global burden of skin disease in 2010: an analysis of the prevalence and impact of skin conditions. J. Invest. Dermatol 134, 1527–1534 (2014). - PubMed
    1. Fried RG, Acne vulgaris: The psychosocial and psychological burden of llness. The Dermatologist 21, 28–32 (2013).
    1. Zaraa I et al., Severity of acne and its impact on quality of life. Skinmed 11, 148–153 (2013). - PubMed
    1. Mooney T, Preventing psychological distress in patients with acne. Nurs. Stand 28, 42–48 (2014). - PubMed
    1. Aktan S, Ozmen E, Sanli B, Anxiety, depression, and nature of acne vulgaris in adolescents. Int. J. Dermatol 39, 354–357 (2000). - PubMed

Publication types