. 2022 Jul 22;7(73):eabl4102.
doi: 10.1126/sciimmunol.abl4102. Epub 2022 Jul 22.

A clade C HIV-1 vaccine protects against heterologous SHIV infection by modulating IgG glycosylation and T helper response in macaques

Affiliations

A clade C HIV-1 vaccine protects against heterologous SHIV infection by modulating IgG glycosylation and T helper response in macaques

Anusmita Sahoo et al. Sci Immunol. .

Abstract

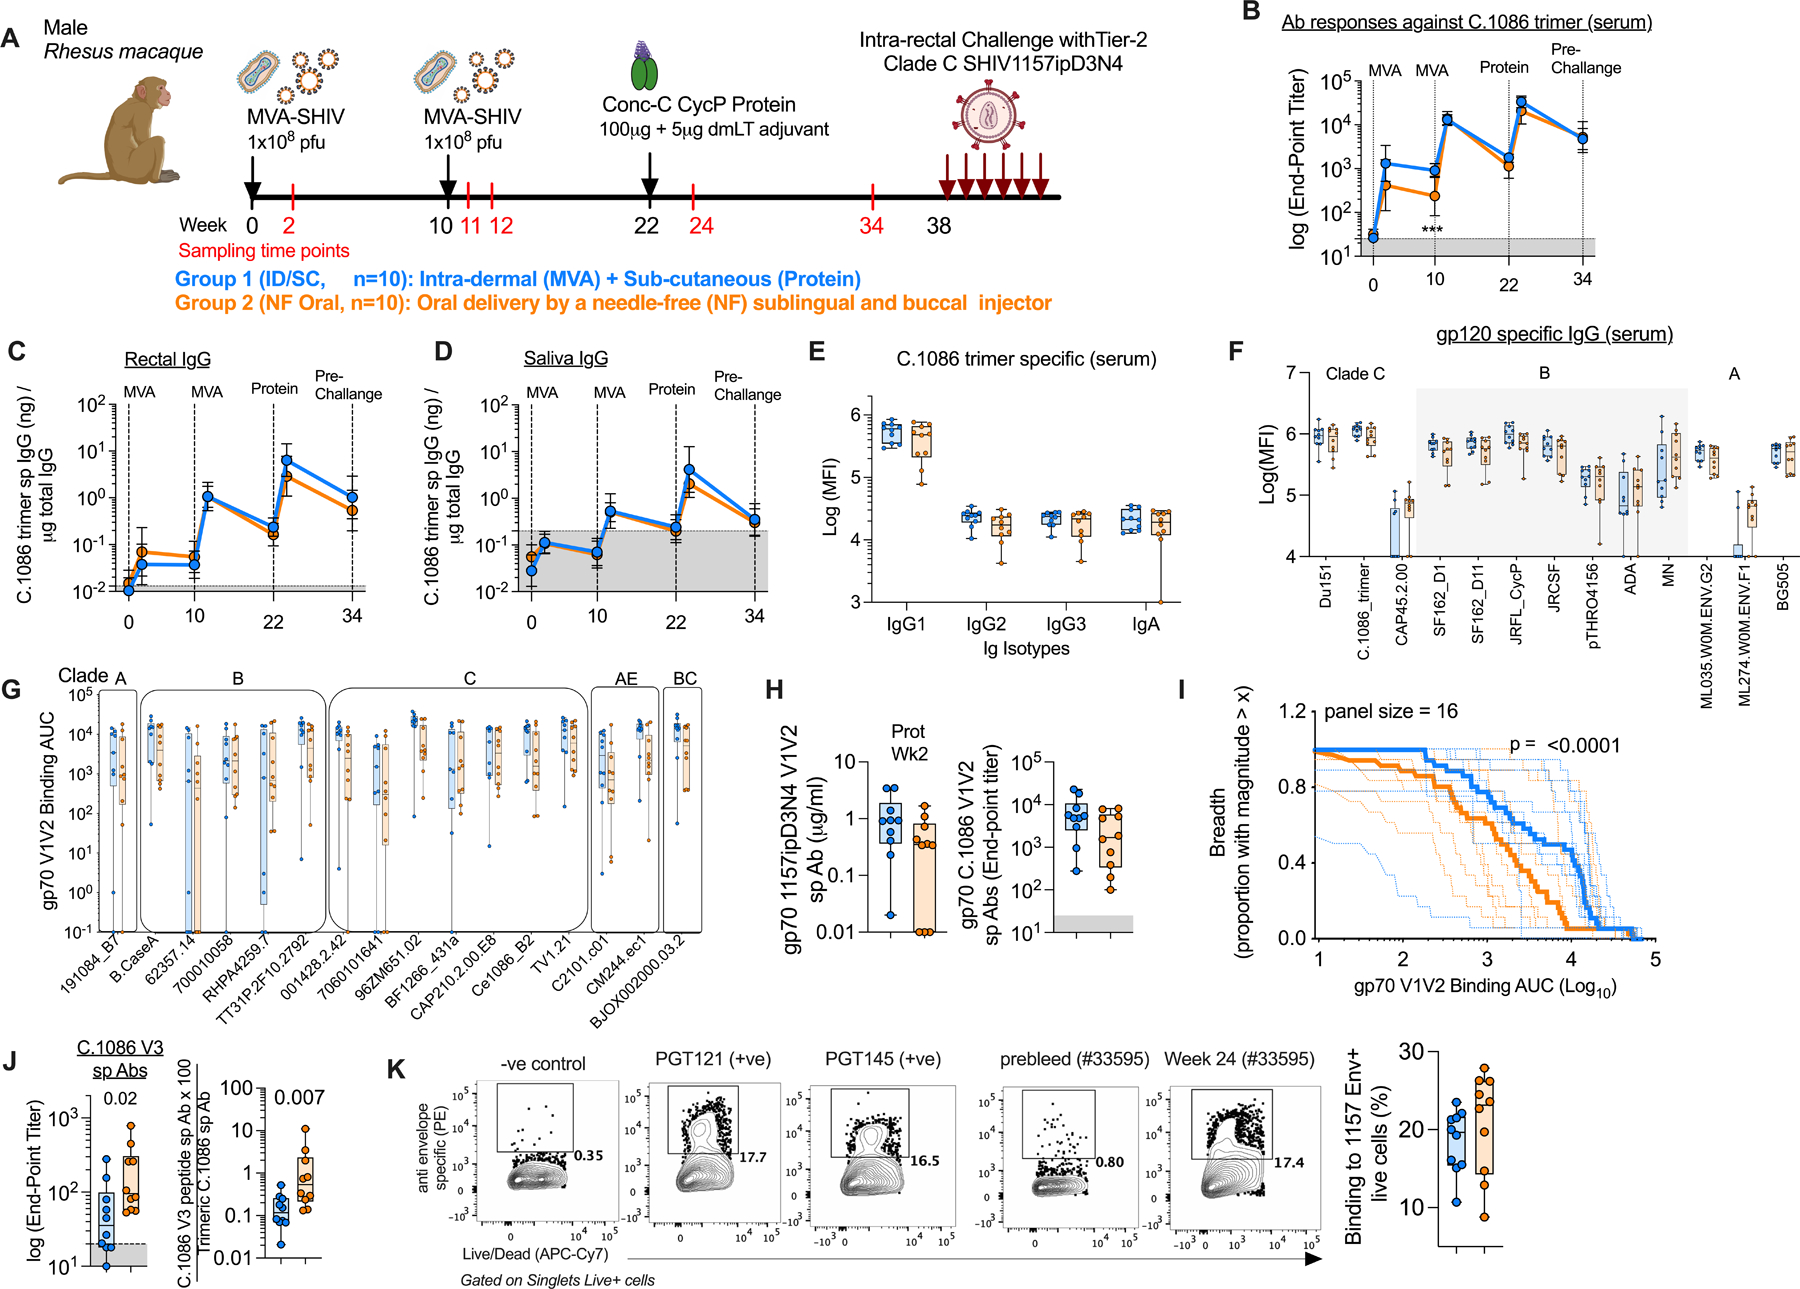
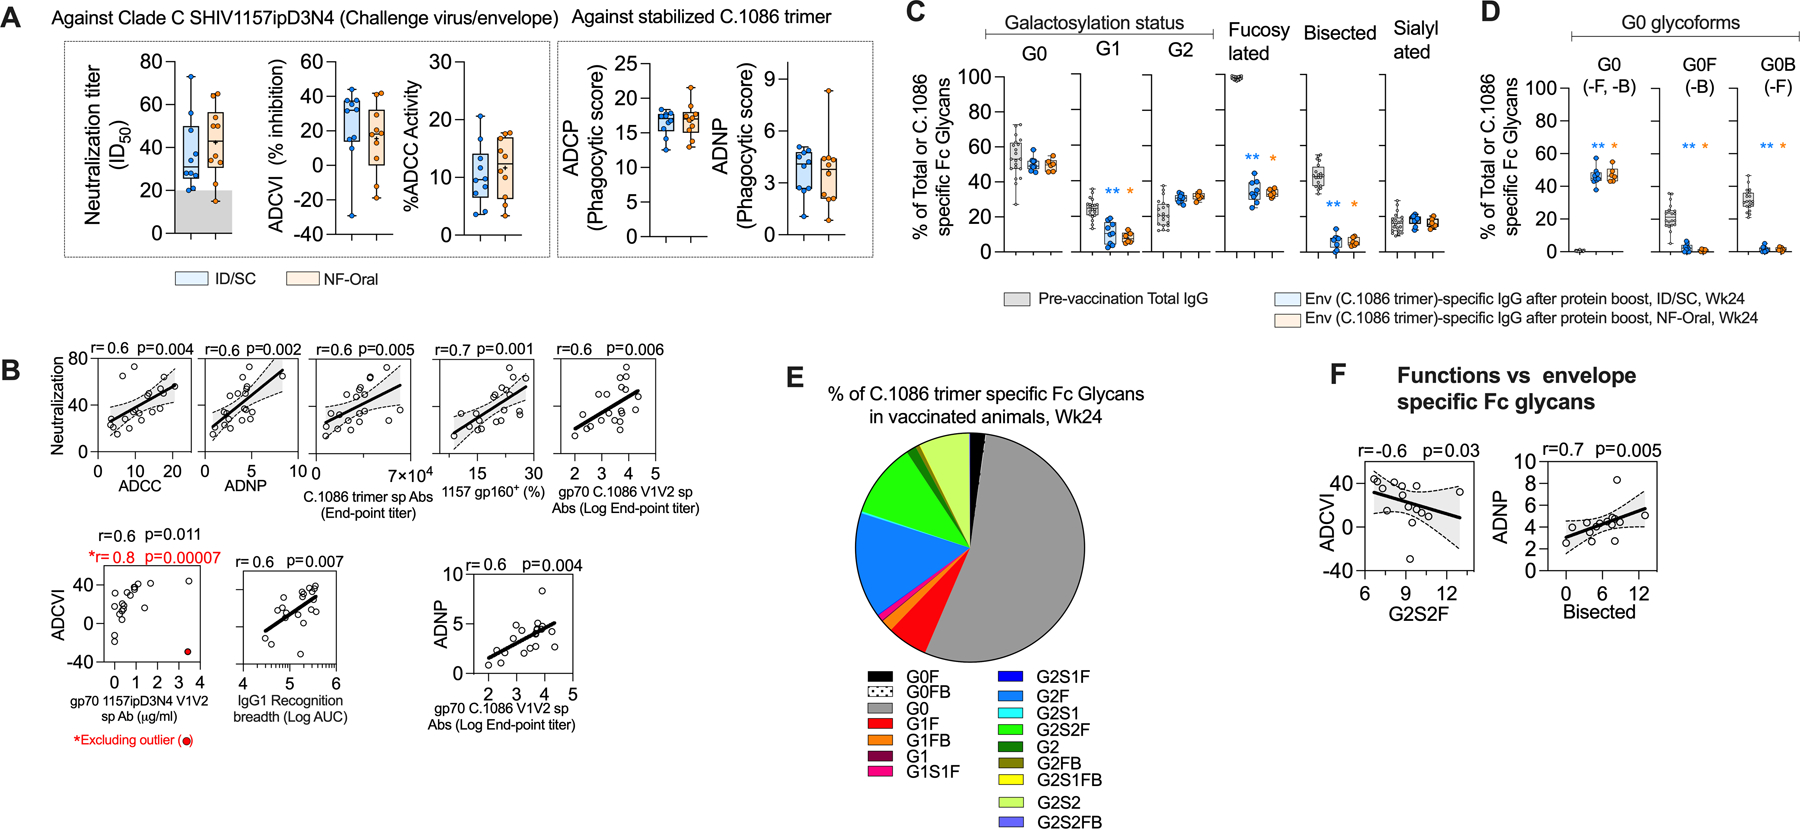
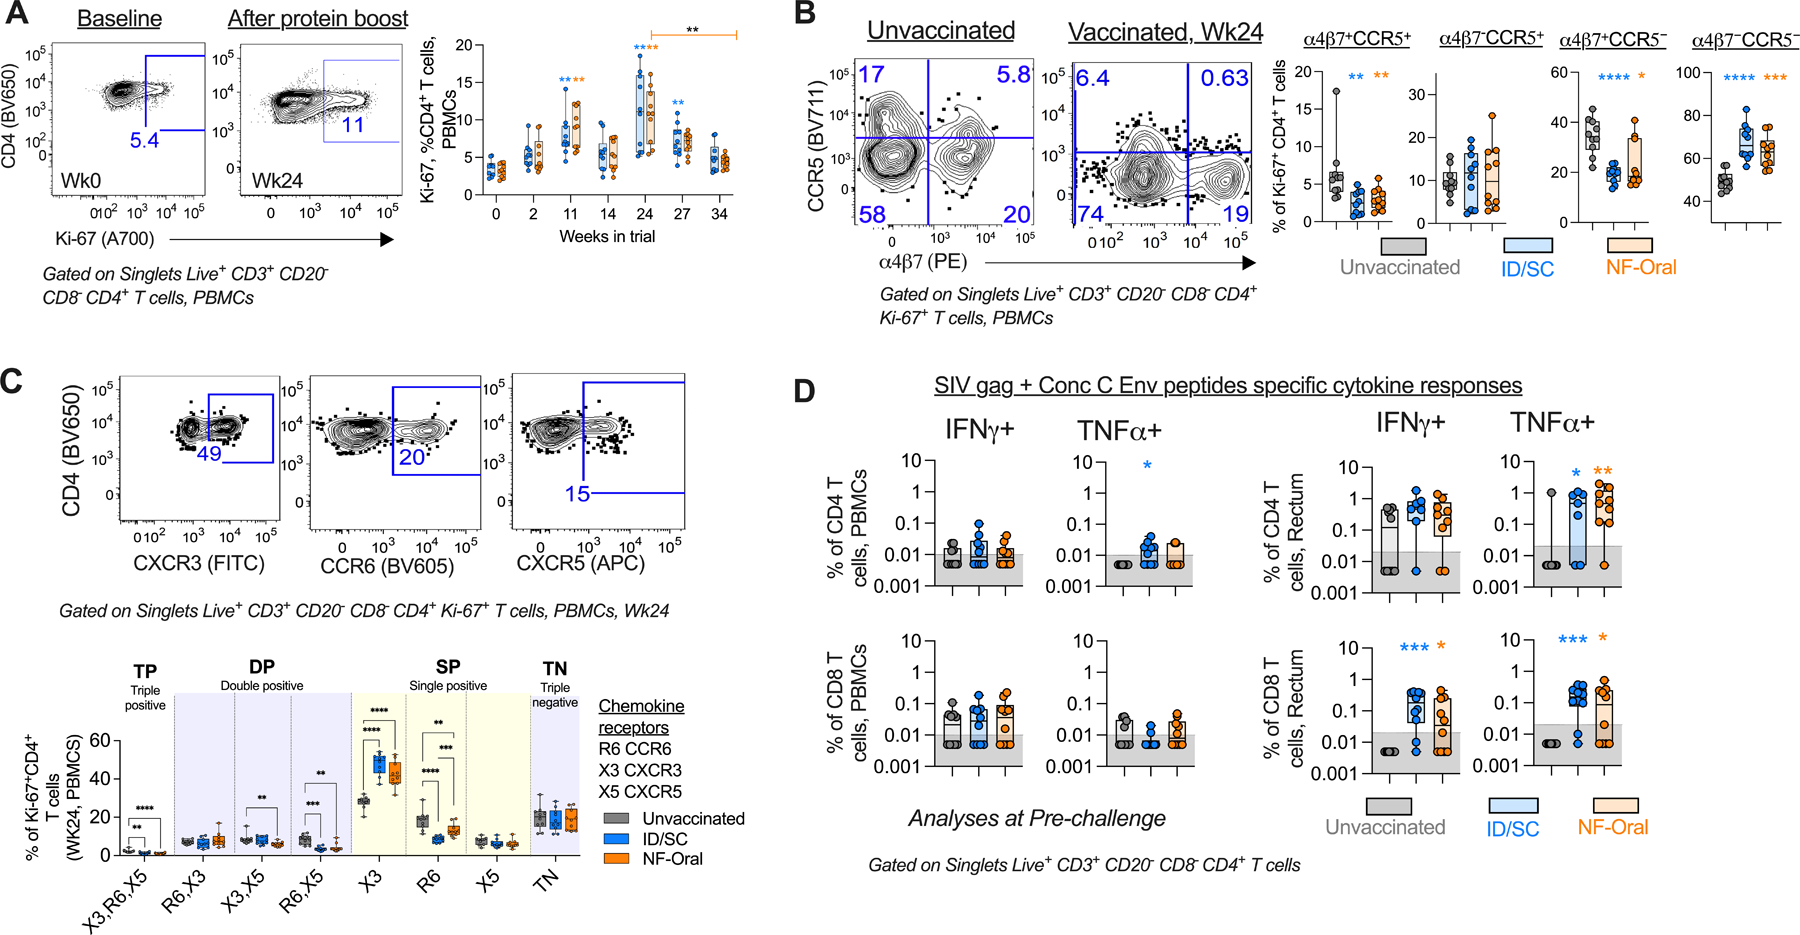
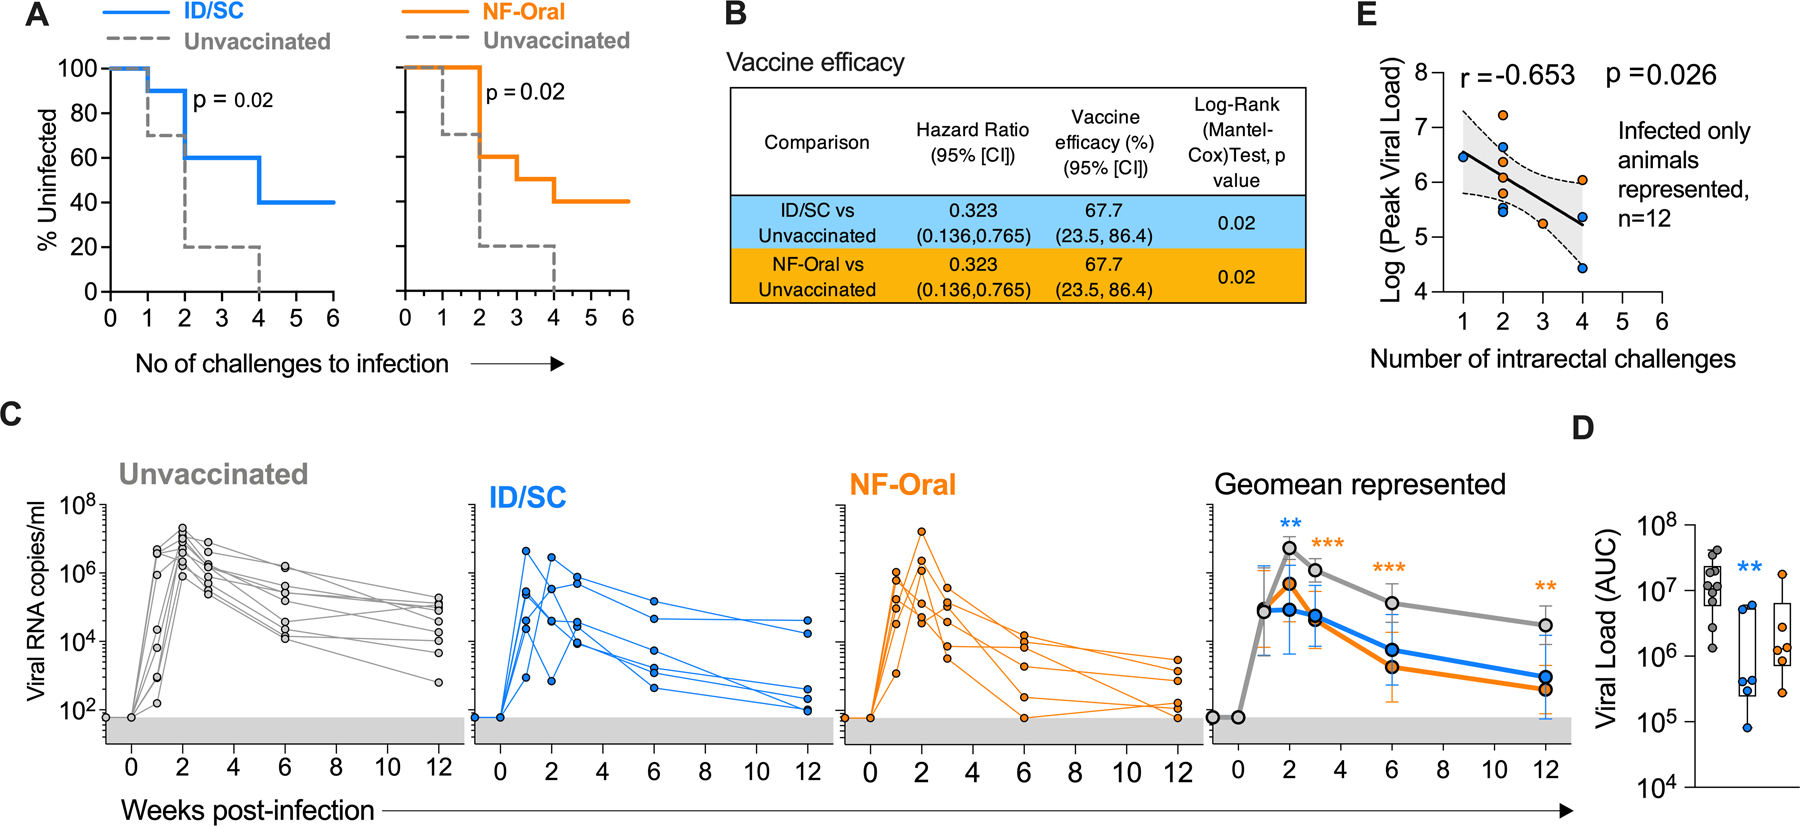
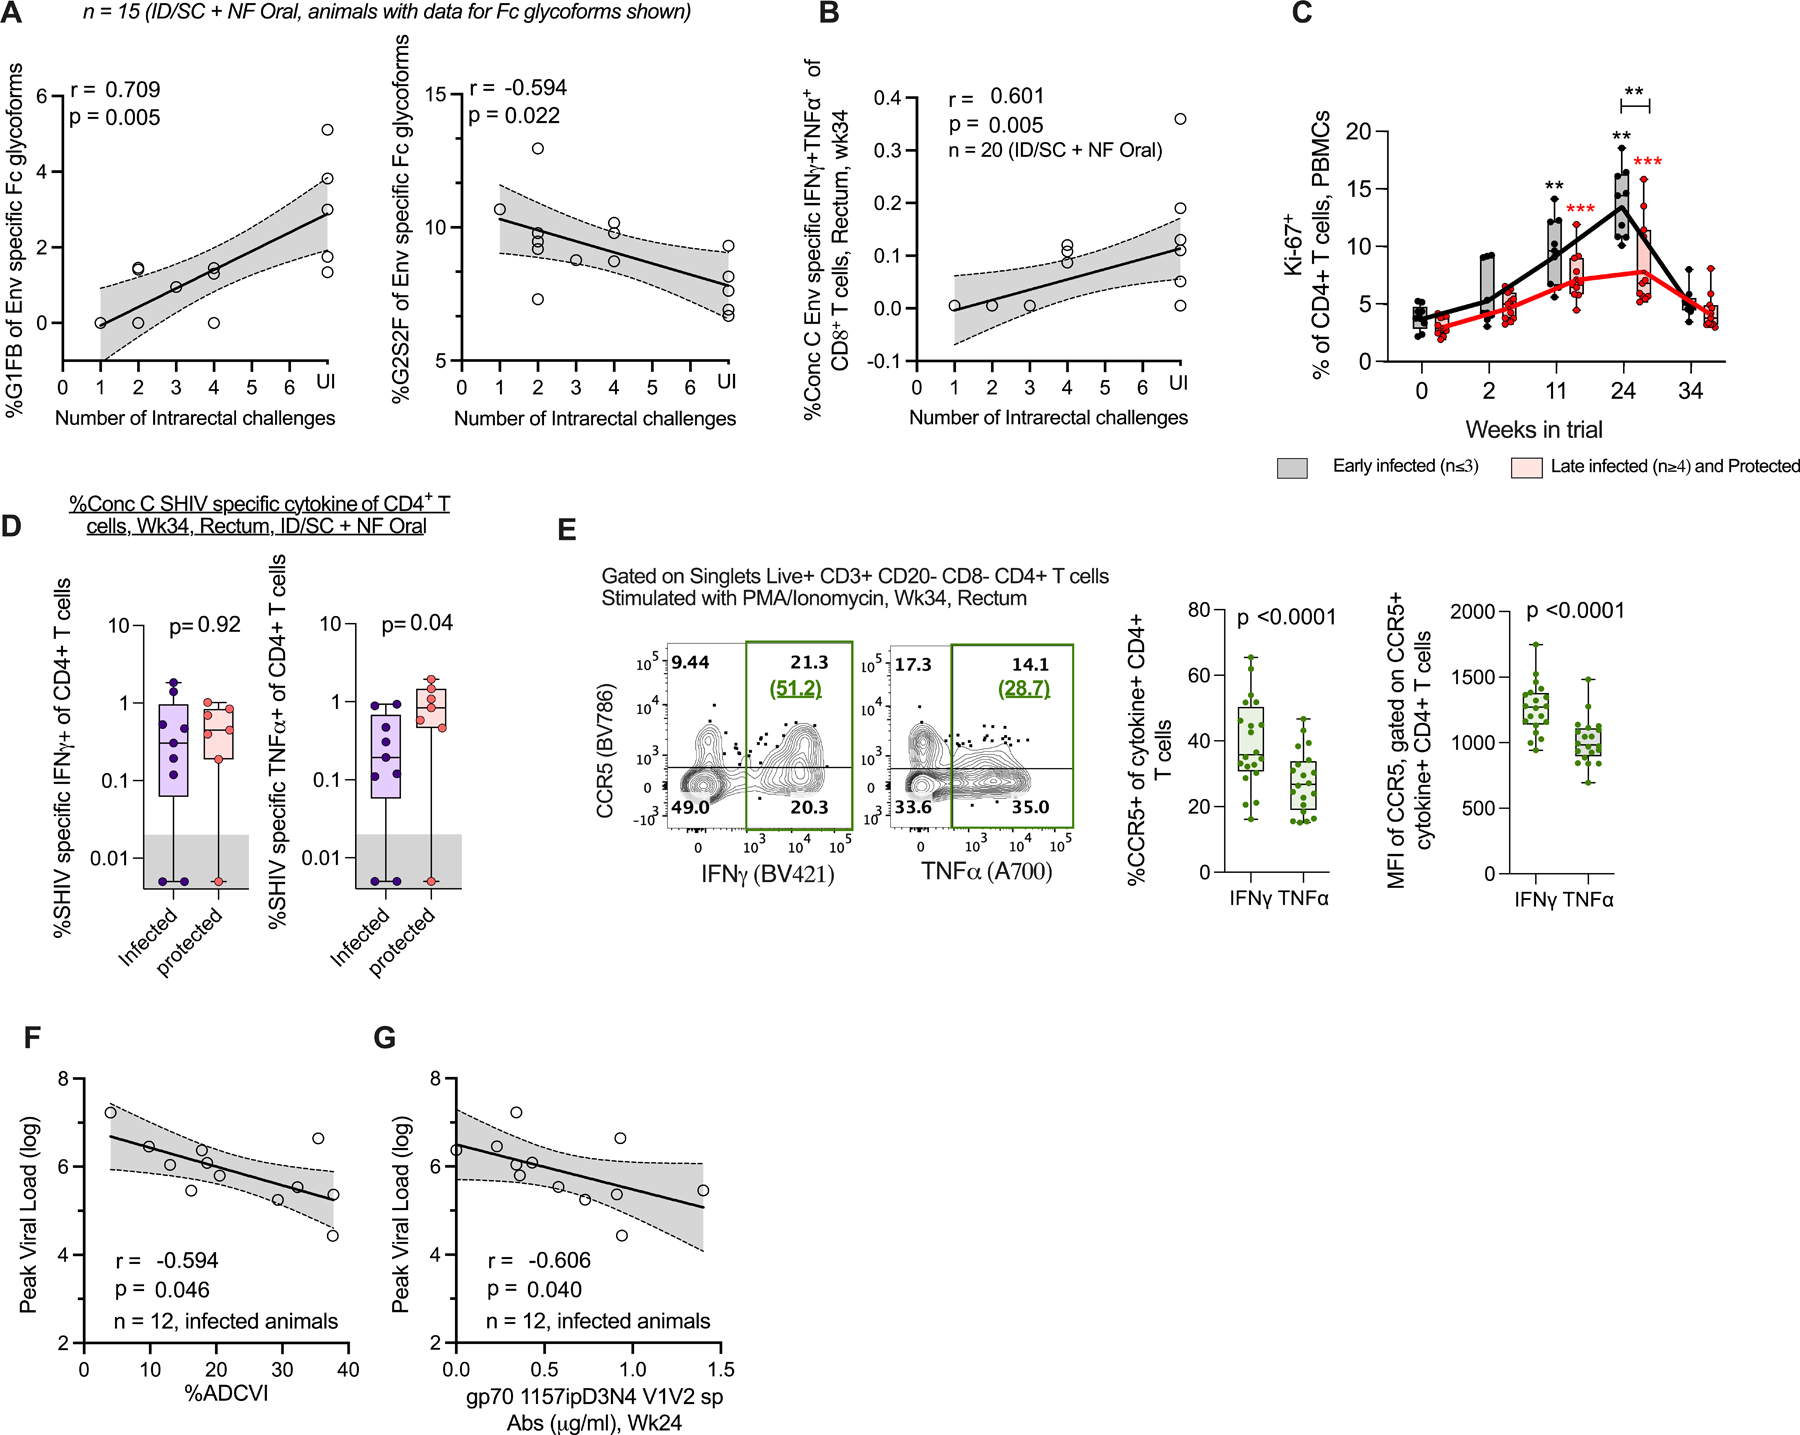
The rising global HIV-1 burden urgently requires vaccines capable of providing heterologous protection. Here, we developed a clade C HIV-1 vaccine consisting of priming with modified vaccinia Ankara (MVA) and boosting with cyclically permuted trimeric gp120 (CycP-gp120) protein, delivered either orally using a needle-free injector or through parenteral injection. We tested protective efficacy of the vaccine against intrarectal challenges with a pathogenic heterologous clade C SHIV infection in rhesus macaques. Both routes of vaccination induced a strong envelope-specific IgG in serum and rectal secretions directed against V1V2 scaffolds from a global panel of viruses with polyfunctional activities. Envelope-specific IgG showed lower fucosylation compared with total IgG at baseline, and most of the vaccine-induced proliferating blood CD4+ T cells did not express CCR5 and α4β7, markers associated with HIV target cells. After SHIV challenge, both routes of vaccination conferred significant and equivalent protection, with 40% of animals remaining uninfected at the end of six weekly repeated challenges with an estimated efficacy of 68% per exposure. Induction of envelope-specific IgG correlated positively with G1FB glycosylation, and G2S2F glycosylation correlated negatively with protection. Vaccine-induced TNF-α+ IFN-γ+ CD8+ T cells and TNF-α+ CD4+ T cells expressing low levels of CCR5 in the rectum at prechallenge were associated with decreased risk of SHIV acquisition. These results demonstrate that the clade C MVA/CycP-gp120 vaccine provides heterologous protection against a tier2 SHIV rectal challenge by inducing a polyfunctional antibody response with distinct Fc glycosylation profile, as well as cytotoxic CD8 T cell response and CCR5-negative T helper response in the rectum.


Conflict of interest statement

Competing interests

R.R.A, A.J and R.V are co-inventors of MVA/CycP-gp120 vaccine technology. Emory university filed a patent on this technology. Other authors declare no competing interests.

Figures

Fig. 1.
Fig. 1.. Design and characterization of Clade C CycP envelope immunogens.
(A) Schematic representation of the Clade C gp120 and CycP gp120s designed in the study. (B) Size-exclusion chromatography (SEC) profiles of 293F expressed, Galanthus nivalis Lectin (GNL) affinity purified gp120 variants. Trimeric peak (arrow) elution volume (ml) indicated, trimer proportion (% AUC) for each protein mentioned below its legend. (C) Blue native PAGE (BN-PAGE) of purified proteins with molecular weight standard. (D) 2D-class averages (4×4 images) of the proteins (purified after SEC) monitored by negative stain electron-microscopy. Representative class in each dataset that resembles a trimeric particle has been circled (red). (E) KD (nM) of CycP gp120 and gp120 designs against various env specific antibodies measured by Bio-layer Interferometry (BLI). Kinetic parameters calculated by globally fitting the raw data to a 1:1 binding model. Mean of KD values calculated from more than two independent experiments indicated. (F) BLI binding responses of Conc-C CycP gp120 to HIV-1 env specific bnAbs. Raw traces (dotted), fit traces (solid).
Fig. 2.
Fig. 2.. Clade C MVA/CycP gp120 vaccination induces a strong antibody response in serum and rectal secretions, and broad envelope, gp70-V1V2 scaffold specific serum responses.
(A) Schematic overview of the MVA-SHIV/conc-C CycP gp120 vaccine efficacy study in rhesus macaques. The group color codes are followed across all panels. (B-D) Longitudinal antibody binding responses (geometric mean, error bars SD) in (B) serum, (C) rectal secretions, (D) salivary secretions measured against C.1086 trimer. (E) C.1086 trimer specific binding responses by IgG subclasses and IgA in serum. (F) Serum binding IgGs specific to a panel of diverse HIV-1 gp120 envs, including C.1086 gp140 trimer. (G, H) Serum antibody binding responses measured against (G) a panel of V1V2-scaffolds from 16 cross-clade HIV-1 isolates, and (H left) 1157ipD3N4 and (H right) C.1086 V1V2 loops scaffolded onto gp70 protein. (I) V1V2 Breadth magnitude curves of all immunized animals (dotted line) with median response of each group (bold line) indicated. Unpaired two-tailed Kolmogorov Smirnov test to see statistical difference between ID/SC and NF Oral groups. (J) Serum binding antibody responses against V3 peptide (left) and normalized to total C.1086 trimer specific responses (right). (K) Left Representative flow plots showing binding of serum collected before vaccination (pre-bleed) and two weeks after protein boost (1:100 dilution) to live transiently transfected 293T cells expressing membrane anchored 1157ipD3N4 gp160. Binding signal of vaccinated serum to MLV transfected cells was used as a negative (−ve) control to define the binding signal gate. Env specific bnAbs (PGT121, PGT145) were used as positive (+ve) controls. Right Frequency of 1157ipD3N4 envelope+ (Env+) cells measured for each vaccinated animal. (E-F) Minimum-to-maximum whisker box plots with box extending from 25th to 75th percentile and line indicating the median. (E-K) Serum collected two weeks after protein boost was used for analyses. (B-D, J, H) Shaded gray area represents background signal based on responses in pre-bleed serum. (E, F) Data plotted were subtracted from responses obtained from naïve rhesus macaque serum, (G, K) pre-bleed. All values plotted are the average of at-least two independent experiments. Statistical comparisons between groups were conducted by Mann-Whitney U test and Bonferroni correction was used to adjust for multiple comparisons. Significant findings were indicated by *p < 0.05, **p< 0.01, ***p<0.001, ****p<0.0001. ID/SC Intradermal/subcutaneous, NF Needle-free, MVA-SHIV Modified Vaccinia Ankara expressing SIV mac239 Gag/Pol and HIV-1 C.1086 gp150 Env as VLP (virus like particle). In all cases, data was monitored for n=10 animals in each vaccine arm.
Fig. 3.
Fig. 3.. Functional and biophysical characterization of serum antibody responses.
(A) Functional activities associated with the serum (collected two weeks after protein boost or week 24) from vaccinated animals, including neutralization, antibody-dependent cell-mediated virus inhibition (ADCVI), antibody-dependent cellular cytotoxicity (ADCC), antibody-dependent cellular phagocytosis (ADCP, monocyte mediated), antibody-dependent neutrophil phagocytosis (ADNP) activities. Neutralization was measured against SHIV 1157ipD3N4 Env G13.10 pseudotyped virus, ID50 serum dilution for 50% neutralization, titer< 20 (or background, shaded gray) shown at 15 for data representation. ADCVI and ADCC functions were measured against SHIV1157ipD3N4 (challenge virus envelope), while ADCP and ADNP activities were measured specific to C.1086 trimer. (B) Correlations between antigen-specific effector functions and antigen-specific antibodies in serum at Wk24. 95% confidence interval shaded gray. All significant findings are reported after adjusting for multiple comparisons by Bonferroni correction. Spearman’s correlation coefficient r and two-sided p value indicated, n=20. (C-E) Distribution of C.1086 trimer specific IgG Fc specific (C) total galactosylated (G0 agalactosylated, G1 mono-galactosylated, G2 di-galactosylated), total fucosylated, total bisecting GlcNAc and total sialylated glycoforms across the immunization groups; (D) all G0 bearing glycoforms; (E) all glycoforms monitored in the study (G0 agalactosylated, G1 mono-galactosylated, G2 di-galactosylated, F fucosylated, B bisecting GlcNAc, S1 mono-sialylated, S2 di-sialylated, nomenclature as described by Mahan et al., 2015 (80), responses from both groups (n=15) shown due to similar distribution profile of the glycoforms across the vaccination groups, see fig. S4D). In (C, D), total IgG Fc glycoform of pre-vaccination serum has also been shown in gray to indicate its baseline level, n=20. Wilcoxon matched-pairs signed rank two-tailed test for statistical comparison between two time-points within vaccinated groups i.e. Fc glycoform specific to total IgG sampled pre-vaccination and Fc glycoform related to Env-specific IgG sampled after protein boost, Wk24. Bonferroni correction used to adjust for multiple comparisons, significant findings were indicated by *p < 0.05, **p< 0.01, ***p<0.001, ****p<0.0001. p values group wise color coded and indicated above group specific data show comparison relative to group specific pre-vaccination data. (F) Relationship between different effector functions and Env-specific Fc glycoforms. 95% confidence interval shaded gray. Spearman’s correlation coefficient r and two-sided p value indicated, n=15. (C-F) All plots corresponding to Env-specific Fc glycoforms contain data from 15 vaccinated animals, serum collected at Wk24. Data was not available for 5 animals due to low concentration of Env-specific IgG in the serum samples. (A, C, D) All Responses measured in ID/SC group are colored blue, and NF-Oral group colored orange in all panels. Box and whiskers plots where box extend from 25th to 75th percentile, median indicated by line, minimum and maximum values indicated by whiskers. All values plotted are the average of at-least two independent experiments. ID/SC Intradermal/subcutaneous, NF-Oral Needle-free Oral vaccine groups. In all cases, data was monitored for n=10 animals in each vaccine arm, unless otherwise indicated.
Fig. 4.
Fig. 4.. Characterization of T cell responses after vaccination.
(A) Right, Temporal profile of circulating Ki-67+ CD4+ T cells (geomean in solid lines); Left, representative flow cytometry staining for a vaccinated animal. Wilcoxon matched-pairs signed rank test, two-tailed for statistical comparison within vaccinated groups. (B) Right, Scatter plot showing altered distribution of the fraction of circulating Ki-67+CD4+ T cells expressing α4β7/CCR5 chemokine receptors; important for permitting HIV-1 pathogenesis, at the peak proliferation phase of cells after vaccination (wk24) relative to unvaccinated control; Left, Representative flow staining. (C) Top, Representative flow staining showing gates used to monitor the co-expression of chemokine receptors on Ki-67+ CD4+ T cells and Bottom their comparative analyses using a Boolean function in FlowJo v9.9.6. One way ANOVA for statistical comparisons followed by Mann-Whitney U test for statistical comparison between groups. (D) Vaccine specific (SIV gag + Consensus C Env peptide pool) cytokine responses measured for CD4+ and CD8+ T cells present in blood and rectal tissue at pre-challenge (Wk34 or 4 weeks prior to intra-rectal SHIV challenge), n=10 in each vaccine arm and n=10 unvaccinated animals. For cytokine responses measured for rectal CD4+ T cells, n=7 ID/SC and n=9 NF-Oral due to data not available for animals with low CD4 T cell counts (<1000, threshold). Cells stimulated with PMA/Ionomycin and blank (non-stimulated) served as positive and negative controls respectively to define gates. Mann-Whitney U test for all statistical comparison between groups. All statistical analyses have been corrected for multiple comparisons using Bonferroni correction, except TNFα+ rectal CD4 T cell responses for ID/SC vs unvaccinated comparison. All comparisons found to be significant after correcting for multiple testing are indicated by *p < 0.05, **p< 0.01, ***p<0.001, ****p<0.0001. All Responses measured for ID/SC group indicated in blue, and NF-Oral group in orange. Box and whiskers plots where box extend from 25th to 75th percentile, median indicated by line, minimum and maximum values indicated by whiskers. (A) p values group wise color coded and indicated above group specific data indicate comparison relative to group specific pre-bleed response, or (B-D) responses measured relative to unvaccinated control animals, unless otherwise indicated. ID/SC Intradermal/subcutaneous, NF-Oral Needle-free Oral vaccine groups. In all cases, data was monitored for n=10 animals in each vaccine arm and n=10 unvaccinated animals, unless otherwise indicated.
Fig. 5.
Fig. 5.. MVA-HIV/cycP-gp120 vaccination protects rhesus macaques from mucosal Clade C SHIV challenge and controls viral replication irrespective of the immunization route.
(A) Acquisition of SHIV infection in ID/SC (n=10), NF-Oral (n=10) vaccinated and unvaccinated (n=10) animals (Kaplan-Meier curves and Log-rank (Mantel-Cox) test), intra-rectally challenged with tier2 pathogenic Clade C SHIV1157ipD3N4. (B) Vaccine efficacy of the two vaccinated groups vs control animals calculated as described previously (81). (C) Kinetics of plasma viral loads in unvaccinated (n=10, infected), vaccinated ID/SC (n=6, infected) and NF-Oral (n=6, infected) animals. Geomean ± 95%CI shown in the right-most graph. (D) Vaccination results in reduction in viral load (measured as AUC) relative to unvaccinated controls. Box and whiskers plots where box extend from 25th to 75th percentile, median indicated by line, minimum and maximum values indicated by whiskers. (C, D) Mann-Whitney U test for statistical comparison between groups followed by Bonferroni correction for multiple comparisons; significant p values after correcting for multiple comparisons indicated by *p < 0.05, **p< 0.01, ***p<0.001, ****p<0.0001. p values group color coded indicate comparison relative to controls. (E) Peak viral load monitored after infection inversely correlated with number of challenges for infection for all vaccinated infected animals (n=12), 95% confidence band shaded gray. Spearman’s correlation coefficient r and two-sided p-value indicated. ID/SC Intradermal/subcutaneous, NF-Oral Needle-free Oral vaccine groups.
Fig. 6.
Fig. 6.. Vaccine specific humoral and T cell responses are associated with protection and reduced viral replication after mucosal SHIV challenge
(A) C.1086 trimer Env-specific IgG Fc glycoforms G1FB and G2S2F correlate with reduced and enhanced risk of SHIV infection, respectively. The plots contain data from n=15 vaccinated animals. Data was not available for 5 animals due to low concentration of Env-specific IgG in the serum samples. UI Uninfected. (B) Consensus C Env-specific IFNγ+TNFα+ CD8+ T cell responses measured at pre-challenge in rectum for all vaccinated animals (n=20, some data points overlap in the plot) associate with reduced risk of infection. UI Uninfected. (C) Kinetics of circulating Ki-67+ CD4+ T cells for vaccinated animals stratified into early infection acquirers (≤3 challenges, n=9) and late acquirers or protected (≥4 challenges or completely protected, n=11). Solid lines indicate geo-mean. Prior to vaccination or wk0, Peak effector response after MVA-1, MVA-2, protein boost i.e. WK2, Wk11 and Wk24, respectively, Pre-challenge wk34 or 4 weeks before virus exposure. Wilcoxon matched-pairs signed rank two-tailed test for statistical comparison within the groups, and Mann-Whitney U test for comparisons between groups. Comparisons found significant after correcting for multiple testing by Bonferroni correction indicated by *p < 0.05, **p< 0.01, ***p<0.001, ****p<0.0001. p values group wise color coded and indicated above group specific data indicate comparison relative to group specific pre-vaccination response, or otherwise indicated. (D) Protected vaccinated animals have (left) similar levels of Consensus C SHIV-specific IFNγ+, and (right) higher levels of TNFα+ CD4+ T cell responses at pre-challenge in rectum relative to infected vaccinees, Data for animals with rectal CD4 T cell counts > 1000 (threshold) shown, n=9 infected, n= 7 protected,. Unpaired two-tailed t-test for statistical comparison between groups. (E) CD4+ T cells in rectum producing TNFα after in-vitro stimulation with PMA/Ionomycin express significantly lower CCR5 (both as (middle) fraction and (right) mean fluorescence intensity per cell, MFI) relative to IFNγ+ producing CD4+ T cells, n=20 vaccinated animals. Wilcoxon matched-pairs signed rank test, two-tailed for statistical comparison between groups. Representative plot shown in left with %CCR5+ of cytokine+ CD4+ T cells indicated in green parenthesis. (F,G) Correlation between peak viral load and challenge virus-specific (F) ADCVI activity, (G) gp70 V1V2-antibodies for all infected vaccinated animals, n=12. In (A, B, F) Spearman’s correlation coefficient r and two-sided p-value indicated, 95% confidence band shaded gray. In (C-E) Box and whiskers plots where box extend from 25th to 75th percentile, median indicated by line, minimum and maximum values indicated by whiskers. P values reported in A, B, F, G are not adjusted for multiple comparisons. The un-adjusted and adjusted p-values for the immune parameters used to report correlations with protection and peak viral load are shown in table S3. ID/SC Intradermal/subcutaneous, NF-Oral Needle-free Oral vaccine groups.

Similar articles

Cited by

References

    1. Yates NL, Liao HX, Fong Y, deCamp A, Vandergrift NA, Williams WT, Alam SM, Ferrari G, Yang ZY, Seaton KE, Berman PW, Alpert MD, Evans DT, O’Connell RJ, Francis D, Sinangil F, Lee C, Nitayaphan S, Rerks-Ngarm S, Kaewkungwal J, Pitisuttithum P, Tartaglia J, Pinter A, Zolla-Pazner S, Gilbert PB, Nabel GJ, Michael NL, Kim JH, Montefiori DC, Haynes BF, Tomaras GD, Vaccine-induced Env V1-V2 IgG3 correlates with lower HIV-1 infection risk and declines soon after vaccination. Sci Transl Med 6, 228ra239 (2014). - PMC - PubMed
    1. Haynes BF, Gilbert PB, McElrath MJ, Zolla-Pazner S, Tomaras GD, Alam SM, Evans DT, Montefiori DC, Karnasuta C, Sutthent R, Liao HX, DeVico AL, Lewis GK, Williams C, Pinter A, Fong Y, Janes H, DeCamp A, Huang Y, Rao M, Billings E, Karasavvas N, Robb ML, Ngauy V, de Souza MS, Paris R, Ferrari G, Bailer RT, Soderberg KA, Andrews C, Berman PW, Frahm N, De Rosa SC, Alpert MD, Yates NL, Shen X, Koup RA, Pitisuttithum P, Kaewkungwal J, Nitayaphan S, Rerks-Ngarm S, Michael NL, Kim JH, Immune-correlates analysis of an HIV-1 vaccine efficacy trial. N Engl J Med 366, 1275–1286 (2012). - PMC - PubMed
    1. Rerks-Ngarm S, Pitisuttithum P, Nitayaphan S, Kaewkungwal J, Chiu J, Paris R, Premsri N, Namwat C, de Souza M, Adams E, Benenson M, Gurunathan S, Tartaglia J, McNeil JG, Francis DP, Stablein D, Birx DL, Chunsuttiwat S, Khamboonruang C, Thongcharoen P, Robb ML, Michael NL, Kunasol P, Kim JH, Investigators M-T, Vaccination with ALVAC and AIDSVAX to prevent HIV-1 infection in Thailand. N Engl J Med 361, 2209–2220 (2009). - PubMed
    1. Zolla-Pazner S, deCamp A, Gilbert PB, Williams C, Yates NL, Williams WT, Howington R, Fong Y, Morris DE, Soderberg KA, Irene C, Reichman C, Pinter A, Parks R, Pitisuttithum P, Kaewkungwal J, Rerks-Ngarm S, Nitayaphan S, Andrews C, O’Connell RJ, Yang ZY, Nabel GJ, Kim JH, Michael NL, Montefiori DC, Liao HX, Haynes BF, Tomaras GD, Vaccine-induced IgG antibodies to V1V2 regions of multiple HIV-1 subtypes correlate with decreased risk of HIV-1 infection. PLoS One 9, e87572 (2014). - PMC - PubMed
    1. Zolla-Pazner S, Alvarez R, Kong XP, Weiss S, Vaccine-induced V1V2-specific antibodies control and or protect against infection with HIV, SIV and SHIV. Curr Opin HIV AIDS 14, 309–317 (2019). - PMC - PubMed

Publication types