Case Reports
. 2022 Jul 22;7(73):eabq3277.
doi: 10.1126/sciimmunol.abq3277. Epub 2022 Jul 22.

Human T-bet governs the generation of a distinct subset of CD11chighCD21low B cells

Affiliations
Case Reports

Human T-bet governs the generation of a distinct subset of CD11chighCD21low B cells

Rui Yang et al. Sci Immunol. .

Abstract

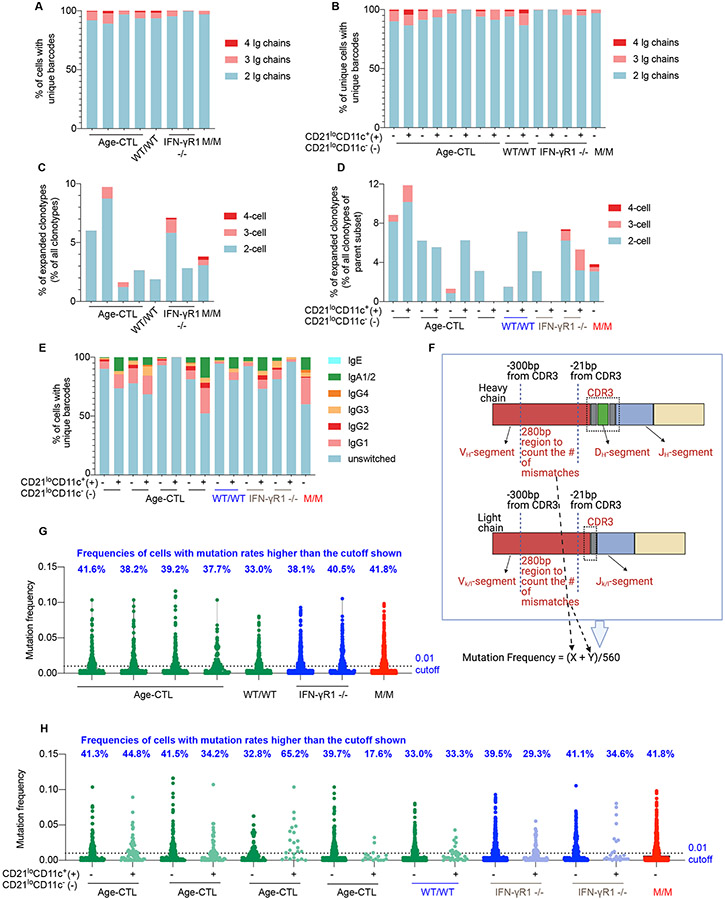
High-level expression of the transcription factor T-bet characterizes a phenotypically distinct murine B cell population known as "age-associated B cells" (ABCs). T-bet-deficient mice have reduced ABCs and impaired humoral immunity. We describe a patient with inherited T-bet deficiency and largely normal humoral immunity including intact somatic hypermutation, affinity maturation and memory B cell formation in vivo, and B cell differentiation into Ig-producing plasmablasts in vitro. Nevertheless, the patient exhibited skewed class switching to IgG1, IgG4, and IgE, along with reduced IgG2, both in vivo and in vitro. Moreover, T-bet was required for the in vivo and in vitro development of a distinct subset of human B cells characterized by reduced expression of CD21 and the concomitantly high expression of CD19, CD20, CD11c, FCRL5, and T-bet, a phenotype that shares many features with murine ABCs. Mechanistically, human T-bet governed CD21loCD11chi B cell differentiation by controlling the chromatin accessibility of lineage-defining genes in these cells: FAS, IL21R, SEC61B, DUSP4, DAPP1, SOX5, CD79B, and CXCR4. Thus, human T-bet is largely redundant for long-lived protective humoral immunity but is essential for the development of a distinct subset of human CD11chiCD21lo B cells.


Figures

Figure 1.
Figure 1.. In vivo development and in vitro function of B cells from a patient with inherited human T-bet deficiency.
(A) Percentages of B cells among live lymphocytes gated from PBMCs of healthy donors (CTL), age-matched healthy donors (Age-CTL) or a patient (P or M/M) with inherited complete T-bet deficiency. (B) Percentages of naïve, memory and transitional B-cell subsets among B cells as in (A). (C) Percentages of IgG+ or IgA+ B cells among the memory B cells of CTL, age-matched CTL or P, measured by conventional flow cytometry (FACS). (D) Levels of total IgG, IgG1, IgG2, IgG3, IgG4, and IgE in plasma samples from P (M/M) and their normal range in the age-matched group (3 – 6 years of age). (E) Overview of the IGH repertoire for P (top row) and control donors aged 24 months (middle row) and 66 years (bottom row). Each column displays clones from a different isotype subclass. Each point is a B-cell clone, with point size scaled for clone size and colored according to the clone’s median SHM rate. Clones are positioned on the basis of V usage (x-axis) and CDR3 length (y-axis) with some jitter to prevent overplotting. (F) Points show the donor mean or median SHM for each IGH isotype, IGK and IGL repertoires; box plots summarize the median and interquartile ranges for all 6 donors. (G) Naïve B cells, isolated by FACS, from CTL or P were stimulated with CD40 ligand (CD40L) in the presence or absence of CpG2006 oligodeoxynucleotides (CpG) for 7 days. IgM levels in culture supernatants were determined by ELISA. (H - J) Naive B cells, as in (G), were stimulated with CD40L in the presence or absence of IL-21 for 7 days. Levels of IgM (H), IgG (I) or IgA (J) in culture supernatants were determined by ELISA. (K - M) Memory B cells, isolated by FACS, were stimulated with CD40L in the presence of CpG (K), IL-10 (L), and IL-21 (M) for 7 days. Levels of IgM, IgG and IgA in culture supernatants were determined by ELISA. (N and O) Memory B cells, isolated by FACS, were stimulated with CD40L in the presence IL-21. Levels of IgG1 (N), IgG2, IgG3, and IgG4 (O) in culture supernatants were determined by ELISA. (P) Memory B cells, isolated by FACS, were stimulated with CD40L in the presence or absence of IL-4 and IL-21. Levels of IgE in culture supernatants were determined by ELISA. In Fig. 1A, B, D, G - P bars represent the mean and the standard deviation. Dots represent individual samples for CTL or Age-CTL and technical replicates for M/M. Two-way ANOVA was used in (G – M and P). Mann-Whitney test was used in (N). Student t-test was used in (O). In (G - P), *p<0.05, **p<0.01, ***p<0.001, ****p<0.0001, and ns = not significant (or not marked).
Figure 2.
Figure 2.. CD21loCD11c+ B-cell levels are low in a patient with inherited T-bet deficiency.
(A) PBMCs from 20 adult controls (CTL), four age-matched controls (Age-CTL), two IFN-γR1-deficient patients (IFN-γR1 −/−), P's healthy brother (WT/WT), heterozygous mother (WT/M), and P (M/M) were analyzed with a 29-color flow cytometry panel focusing on B cells. Surface staining of CD21 and CD11c on CD19+CD20+ B cells from different individuals, as indicated, is shown. CD21loCD11c or CD21loCD11c+ B cells were gated from CD19+CD20+ B cells, and their surface expression of CD19 and intracellular expression of T-bet were plotted. (B) Percentages of CD21loCD11c and CD21loCD11c+ B cells, as in (A), are shown. (C) Mean fluorescence intensity of T-bet of CD21hiCD11c, CD21loCD11c, and CD21loCD11c+ B cells, as in (A), are shown. (D) PBMCs from 10 adult controls (CTL) and a patient with AR complete STAT1 deficiency (STAT1 −/−) were analyzed with the 29-color flow panel as in (A). Surface staining of CD21 and CD11c on CD19+CD20+ B cells from different individuals, as indicated. CD21loCD11c or CD21loCD11c+ B cells were gated from CD19+CD20+ B cells, and their surface expression of CD19 and intracellular expression of T-bet were plotted. (E) Percentages of CD21loCD11c and CD21loCD11c+ B cells, as in (D). (F) Mean fluorescence intensities (MFI) for CD11c expression on CD21loCD11c+ B cells gated as in (D), from CTL or the STAT1 −/− patient. (G - I) The expression levels of CD19 (G), CD20 (H), and FcRL5 (I) on CD21hiCD11c, CD21loCD11c, CD21loCD11c+T-betlo, and CD21loCD11c+T-bethi B cells, as indicated by MFI. In Fig. 2B, C, and E - I, bars represent the mean and the standard deviation. Dots represent individual samples. One-way ANOVA test was performed for (B). Mann-Whitney tests were performed to compare CD21loCD11c, CD21loCD11c+T-betlo, and CD21hiCD11c B cells with CD21loCD11c+T-bethi B cells (G - I). In (B, G - I), *p<0.05, **p<0.01, ***p<0.001, ****p<0.0001, and ns = not significant (or not marked).
Figure 3.
Figure 3.. Depletion of some unique subsets of CD21lo B cells in the patient with inherited T-bet deficiency.
(A) PBMCs from 30 healthy adults (CTL), four age-matched controls (Age-CTL), two IFN-γR1-deficient patients (IFN-γR1 −/−), P's healthy brother (WT/WT), P’s heterozygous mother (WT/M), and P (M/M) were analyzed with a 29-color flow cytometry panel focusing on B cells in two separate experiments. Batch correction was performed with the iMUBAC algorithm and FlowSOM unsupervised clustering was performed. These clusters from age-matched controls (Age-CTL), IFN-γR1-deficient patients (IFN-γR −/−), P (M/M), P's healthy brother (WT/WT), P’s mother (WT/M), and a STAT1-deficient patient (STAT1 −/−) are shown on UMAP graphs. Clusters increased or reduced in P are highlighted. (B) Frequency of cluster 25 among B cells. (C - E) Frequencies of clusters 9, 10, 13, 14, and combined among B cells. (F) PBMCs from P (M/M), adult controls (CTL), age-matched controls (Age-CTL) including P's healthy brother (WT/WT), and heterozygous mother (WT/M) were analyzed with a flow cytometry panel including IgM, IgG, IgA, IgD, and CD71 staining focusing on B cells. Their surface expression of IgM and IgG were plotted. (G) Surface expression of IgM and IgA, as in (F) were plotted. (H – K) Percentages of IgM+IgD+ (H), IgMIgG+ (I), IgMIgA+ (J), or T-bet+IgG+ (K) cells, as in (F), among indicated subsets of B cells were shown. CD21loCD11c+ sub represents CD21loCD11c+CD23CD24CD38T-bethi B cells. In Fig. 3B - E, 3H - K, bars represent the mean and the standard deviation. Dots represent individual samples for CTL or Age-CTL and technical replicates for M/M. One-way ANOVA with multiple comparison tests were performed to compare CD21hiCD11c, CD21loCD11c, CD21loCD11c+, and CD21loCD11c+CD23CD24CD38T-bethi (CD21loCD11c+ sub) B cells against each other in (H – K). In (H - K), *p<0.05, **p<0.01, ***p<0.001, ****p<0.0001, and ns = not significant (or not marked).
Figure 4.
Figure 4.. CITE-seq of CD21 B cells from a patient with inherited human T-bet deficiency.
(A) A schematic diagram of the experimental design. (B) PBMCs from the indicated individuals were labeled with hashtag Abs and oligonucleotide-conjugated anti-CD11c, anti-CD21, anti-CD95, anti-CXCR3, anti-FcRL5 Abs. CD3CD56CD20+CD21lo B cells were isolated by FACS. (C) CD3CD56CD20+CD21 B cells, as in (B), were subjected to CITE-seq. Cells from two Age-CTL, one IFN-γR1 −/− patient, and P, which had similar patterns of housekeeping gene expression, were subjected to dimensionality reduction by UMAP based on their transcriptome. (D) Four individual samples from the pool, as in (C), were split on the basis of their hashtags. (E) Frequencies of each cluster of CD21 B cells from two Age-CTLs, one IFN-γR1 −/− patient, and P, as in (C and D). (F) Cells expressing CD11c surface protein detected by CITE-seq (ADT_CD11c), and cells expressing ITGAX or TBX21 were highlighted in UMAP plots. (G) Cells expressing ENC1, ITGB2, and TNFRSF1B were highlighted in UMAP plots. (H) Protein levels for CD11c, CD21, CD95, CXCR3, and FcRL5, as determined by CITE-seq, grouped by transcriptome-defined clusters and sample groups. (I) Heat map showing the scaled expression levels of a selection of genes differentially regulated in cluster 3 B cells as in (C and D). In Fig. 4E, bars represent the mean and the standard deviation. Dots represent individual samples.
Figure 5.
Figure 5.. CSR and somatic hypermutation in T-bet-dependent CD.
(A) Single-cell VDJ sequencing was performed jointly with CITE-seq. Frequencies of CD21lo cells with more than one heavy or light chain are shown. (B) Frequencies of cells with more than one heavy or light chain within CD11c+ CD21lo B cells (+) or CD11c CD21lo (−) cells. (C) Frequencies of clonotypes common to at least 2 cells in each individual CD21lo sample. (D) Frequencies of clonotypes common to at least 2 cells within CD11c+ CD21lo B cells (+) or CD11c CD21lo (−) cells. (E) Frequencies of cells that were unswitched or class-switched to IgE (IGHE), IgA1 (IGHA1) or IgA2 (IGHA2, combined as IgA1/2), IgG1 (IGHG1), IgG2 (IGHG2), IgG3 (IGHG3), or IgG4 (IGHG4) among CD21lo cells. (F) Somatic hypermutation was analyzed as shown in this schematic diagram. Briefly, the numbers of mutations relative to the predicted germline sequence within a 280-nucleotide region (−21 to −300 bp from the start of CDR3 region) of each heavy and light chain were counted. The total number of mutations for both heavy and light chains for each given cell was divided by the total number of nucleotides counted, to calculate the mutation frequency. (G) Mutation frequency of each CD21lo B cell from the indicated individuals. The frequencies of cells with mutation rates greater than 1% are highlighted. (H) Mutation frequency of each CD11c+ CD21lo B cells (+) or CD11c CD21lo (−) B cells from the indicated individuals. The frequencies of cells with mutation rates greater than 1% are highlighted. In Fig. 5A - E, bars represent values of each individual sample. In Fig. 5G and H, dots represent values for individual cells.
Figure 6.
Figure 6.. T-bet functions in a B cell-intrinsic manner to induce the generation of T-bet+ B cells in vitro.
(A) Naïve B cells were purified from the peripheral blood of healthy donors (n=8) and cultured in vitro in medium alone (NS: non-stimulated), or with CpG2006, CpG2006 plus F(ab’)2 fragments of goat anti-IgM/G/A Ab (CpG/aIg), CpG/aIg and IFN-γ (CpG/aIg/IFNγ), or CpG/aIg and IL-27 (CpG/aIg/IL-27). After 3.5 days, B cells were harvested, stained for the surface expression of CD19, CD95, CXCR3 FCRL5, and then for the intracellular expression of T-bet. Expression of T-bet and CD19 in B cells under indicated conditions from a healthy donor was plotted. Expression of T-bet, CD19, CXCR3, FCRL5, CD11c, and CD95 were shown. (B - G) Viable cells were then analyzed, to determine the level of expression (geometric mean fluorescence intensity [gMFI]) as in (A). The expression (gMFI) of (B) T-bet, (C) CD19, (D) FCRL5, (E) CD95 and (G) CXCR3 on CD19+T-bet+ B cells, and the proportions of T-bet+ B cells co-expressing CXCR3 (F) were also determined. (H) Naïve B cells purified from healthy donors or patients with pathogenic variants of IFNGR1, IL27R, JAK1, IRAK4, STAT3 DN, STAT1 (both AR and DN), or TBX21 were cultured in vitro with anti-IgM/G/A Ab (CpG/aIg), CpG/aIg and IFN-γ (CpG/aIg/IFNγ), or CpG/aIg and IL-27 (CpG/aIg/IL-27) for 3.5 days. Expression of surface CXCR3 and intracellular expression of T-bet in B cells from indicated donors were plotted. (I and J) The proportions of CD19+T-bet+ B cells expressing (I) CXCR3 or (J) FCRL5 under anti-IgM/G/A Ab (CpG/aIg) or CpG/aIg and IFN-γ (CpG/aIg/IFNγ) conditions as in (H) were determined. (K) The proportions of CD19+T-bet+ B cells expressing CXCR3 under anti-IgM/G/A Ab (CpG/aIg) or CpG/aIg and IL-27 (CpG/aIg/IL-27) conditions as in (H) were determined. Fig. 6B - G, I - K show the mean ± standard error. Dots represent individual samples for CTL or Age-CTL and technical replicates for M/M. One-way ANOVA was used to compare each set of stimulation conditions with non-stimulated (NIL) conditions in (B – G). One-way ANOVA was used to compare control cells stimulated with anti-IgM/G/A Ab (CpG/aIg) with cells stimulated with CpG/aIg/IFNγ or CpG/aIg/IL-27 (I – K). *p<0.05, **p<0.01, ***p<0.001, ****p<0.0001, and ns = not significant (or not marked). ND: not done
Figure 7.
Figure 7.. A unique epigenetic landscape determined by T-bet programs B-cell differentiation in vitro.
(A) A heat map showing five loci at which chromatin accessibility differed between controls (CTL) and P (M/M) in the absence of stimulation and in response to aIg+CpG+IFN-γ and aIg+CpG+IL-27. (B) Chromatin accessibility of the CCL3L1 and CCL4L1 loci, at which the chromatin accessibilities of three regions differed between controls (CTL) and P (M/M) in the absence of stimulation and in response to aIg+CpG+IFN-γ and aIg+CpG+IL-27. (C) A heat map showing 902 T-bet-dependent loci, the chromatin accessibilities of which were differentially regulated in control cells, but not significantly different in the cells of P, in response to both aIg+CpG+IFN-γ and aIg+CpG+IL-27. (D) DNA motifs most significantly enriched in the 902 T-bet-dependent loci, the chromatin accessibilities of which were differentially regulated in control cells as in (C). (E and F) Chromatin accessibility of FAS (E) and DUSP4 loci (F), that were differentially regulated in response to aIg+CpG+IFN-γ and aIg+CpG+IL-27 in control B cells but not in T-bet-deficient B cells. (G) A heat map showing a selection of 51 loci from the list, as in (C), the chromatin accessibilities of which were differentially regulated in control cells, but not in T-bet-deficient cells, in response to both aIg+CpG+IFN-γ and aIg+CpG+IL-27.

Similar articles

Cited by

References

    1. Szabo SJ, Kim ST, Costa GL, Zhang X, Fathman CG, Glimcher LH, A novel transcription factor, T-bet, directs Th1 lineage commitment. Cell. 100, 655–669 (2000). - PubMed
    1. Szabo SJ, Sullivan BM, Stemmann C, Satoskar AR, Sleckman BP, Glimcher LH, Distinct effects of T-bet in TH1 lineage commitment and IFN-gamma production in CD4 and CD8 T cells. Science (80-. ). 295, 338–342 (2002). - PubMed
    1. Lazarevic V, Glimcher LH, Lord GM, T-bet: a bridge between innate and adaptive immunity. Nat Rev Immunol. 13, 777–789 (2013). - PMC - PubMed
    1. Hao Y, O’Neill P, Naradikian MS, Scholz JL, Cancro MP, A B-cell subset uniquely responsive to innate stimuli accumulates in aged mice. Blood. 118, 1294–1304 (2011). - PMC - PubMed
    1. Rubtsov AV, Rubtsova K, Fischer A, Meehan RT, Gillis JZ, Kappler JW, Marrack P, Toll-like receptor 7 (TLR7)-driven accumulation of a novel CD11c+ B-cell population is important for the development of autoimmunity. Blood (2011), doi:10.1182/blood-2011-01-331462. - DOI - PMC - PubMed

Publication types