

Interferon resistance of emerging SARS-CoV-2 variants
- PMID: 35867811
- PMCID: PMC9371743
- DOI: 10.1073/pnas.2203760119
Interferon resistance of emerging SARS-CoV-2 variants
Abstract
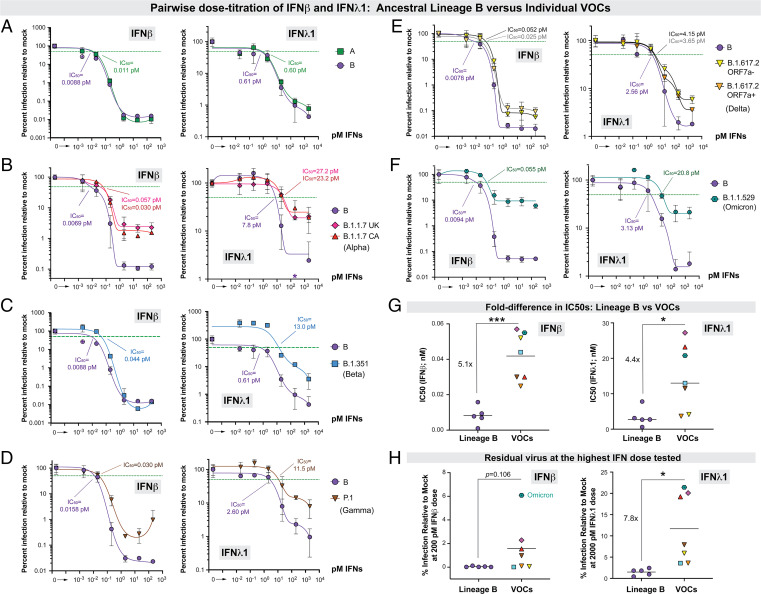
The emergence of SARS-CoV-2 variants with enhanced transmissibility, pathogenesis, and resistance to vaccines presents urgent challenges for curbing the COVID-19 pandemic. While Spike mutations that enhance virus infectivity or neutralizing antibody evasion may drive the emergence of these novel variants, studies documenting a critical role for interferon responses in the early control of SARS-CoV-2 infection, combined with the presence of viral genes that limit these responses, suggest that interferons may also influence SARS-CoV-2 evolution. Here, we compared the potency of 17 different human interferons against multiple viral lineages sampled during the course of the global outbreak, including ancestral and five major variants of concern that include the B.1.1.7 (alpha), B.1.351 (beta), P.1 (gamma), B.1.617.2 (delta), and B.1.1.529 (omicron) lineages. Our data reveal that relative to ancestral isolates, SARS-CoV-2 variants of concern exhibited increased interferon resistance, suggesting that evasion of innate immunity may be a significant, ongoing driving force for SARS-CoV-2 evolution. These findings have implications for the increased transmissibility and/or lethality of emerging variants and highlight the interferon subtypes that may be most successful in the treatment of early infections.
Keywords: COVID-19; SARS-CoV-2; innate immunity; interferons; variants of concern.
Conflict of interest statement
The authors declare no competing interest.
Figures


Update of
-
Interferon Resistance of Emerging SARS-CoV-2 Variants.bioRxiv [Preprint]. 2021 Dec 10:2021.03.20.436257. doi: 10.1101/2021.03.20.436257. bioRxiv. 2021. Update in: Proc Natl Acad Sci U S A. 2022 Aug 9;119(32):e2203760119. doi: 10.1073/pnas.2203760119. PMID: 33758840 Free PMC article. Updated. Preprint.
Similar articles
-
Interferon Resistance of Emerging SARS-CoV-2 Variants.bioRxiv [Preprint]. 2021 Dec 10:2021.03.20.436257. doi: 10.1101/2021.03.20.436257. bioRxiv. 2021. Update in: Proc Natl Acad Sci U S A. 2022 Aug 9;119(32):e2203760119. doi: 10.1073/pnas.2203760119. PMID: 33758840 Free PMC article. Updated. Preprint.
-
A Glycosylated RBD Protein Induces Enhanced Neutralizing Antibodies against Omicron and Other Variants with Improved Protection against SARS-CoV-2 Infection.J Virol. 2022 Sep 14;96(17):e0011822. doi: 10.1128/jvi.00118-22. Epub 2022 Aug 16. J Virol. 2022. PMID: 35972290 Free PMC article.
-
Emerging mutation patterns in SARS-CoV-2 variants.Biochem Biophys Res Commun. 2022 Jan 1;586:87-92. doi: 10.1016/j.bbrc.2021.11.059. Epub 2021 Nov 22. Biochem Biophys Res Commun. 2022. PMID: 34837837 Free PMC article.
-
SARS-CoV-2 Variants: Genetic Insights, Epidemiological Tracking, and Implications for Vaccine Strategies.Int J Mol Sci. 2025 Jan 31;26(3):1263. doi: 10.3390/ijms26031263. Int J Mol Sci. 2025. PMID: 39941026 Free PMC article. Review.
-
Interferon therapy in alpha and Delta variants of SARS-CoV-2: The dichotomy between laboratory success and clinical realities.Cytokine. 2025 Feb;186:156829. doi: 10.1016/j.cyto.2024.156829. Epub 2024 Dec 17. Cytokine. 2025. PMID: 39693873 Review.
Cited by
-
Sensitivity to Neutralizing Antibodies and Resistance to Type I Interferons in SARS-CoV-2 R.1 Lineage Variants, Canada.Emerg Infect Dis. 2023 Jul;29(7):1386-1396. doi: 10.3201/eid2907.230198. Epub 2023 Jun 12. Emerg Infect Dis. 2023. PMID: 37308158 Free PMC article.
-
A stem-loop RNA RIG-I agonist protects against acute and chronic SARS-CoV-2 infection in mice.J Exp Med. 2022 Jan 3;219(1):e20211818. doi: 10.1084/jem.20211818. Epub 2021 Nov 10. J Exp Med. 2022. PMID: 34757384 Free PMC article.
-
Melatonin: Regulation of Viral Phase Separation and Epitranscriptomics in Post-Acute Sequelae of COVID-19.Int J Mol Sci. 2022 Jul 23;23(15):8122. doi: 10.3390/ijms23158122. Int J Mol Sci. 2022. PMID: 35897696 Free PMC article. Review.
-
Anti-interferon armamentarium of human coronaviruses.Cell Mol Life Sci. 2025 Mar 13;82(1):116. doi: 10.1007/s00018-025-05605-z. Cell Mol Life Sci. 2025. PMID: 40074984 Free PMC article. Review.
-
Anti-SARS-CoV-2 Small Molecule Targeting of Oxysterol-Binding Protein (OSBP) Activates Cellular Antiviral Innate Immunity.ACS Infect Dis. 2025 May 9;11(5):1064-1077. doi: 10.1021/acsinfecdis.4c00631. Epub 2025 Apr 21. ACS Infect Dis. 2025. PMID: 40255103 Free PMC article.
References
-
- Pestka S., Krause C. D., Walter M. R., Interferons, interferon-like cytokines, and their receptors. Immunol. Rev. 202, 8–32 (2004). - PubMed
Publication types
MeSH terms
Substances
Supplementary concepts
Grants and funding
LinkOut - more resources
Full Text Sources
Other Literature Sources
Medical
Miscellaneous
