. 2022 Jul 22;18(7):e1009996.
doi: 10.1371/journal.pcbi.1009996. eCollection 2022 Jul.

Uncertainty quantification in cerebral circulation simulations focusing on the collateral flow: Surrogate model approach with machine learning

Affiliations

Uncertainty quantification in cerebral circulation simulations focusing on the collateral flow: Surrogate model approach with machine learning

Changyoung Yuhn et al. PLoS Comput Biol. .

Abstract

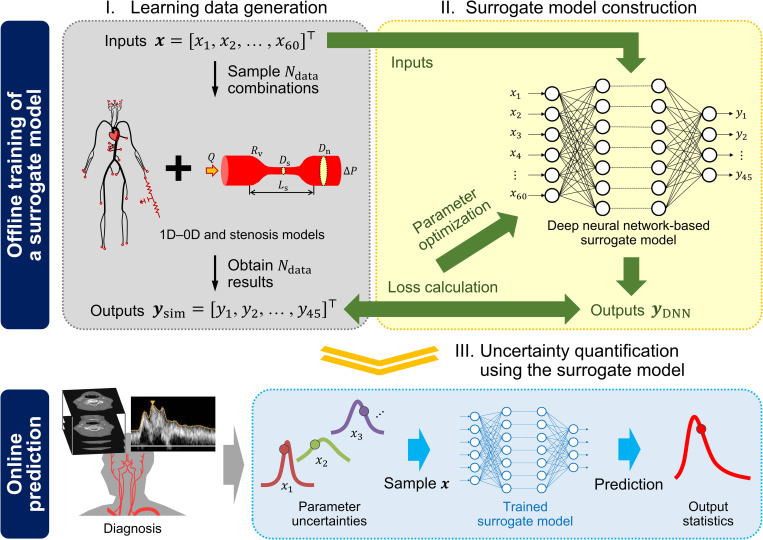
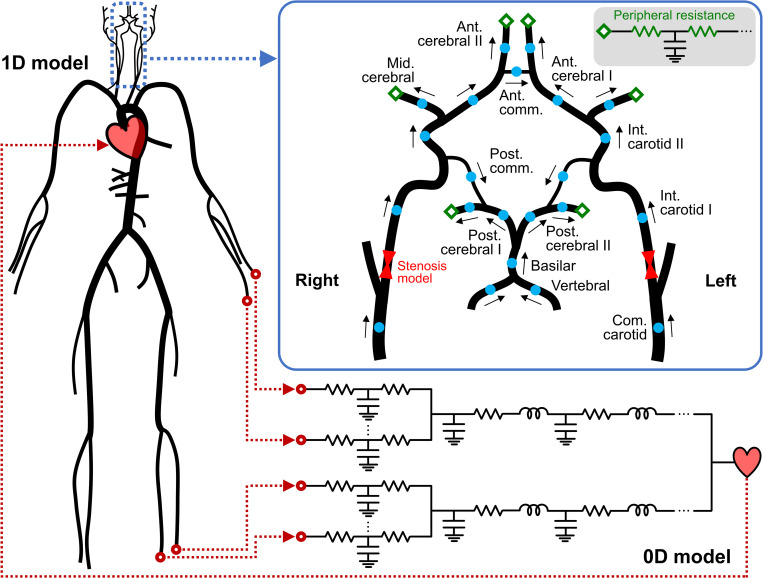
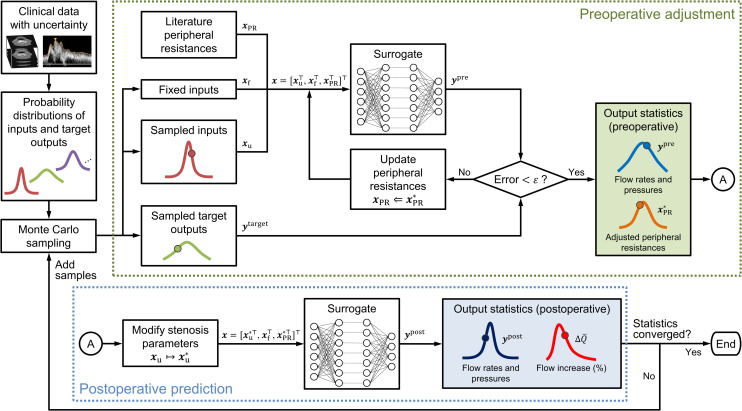
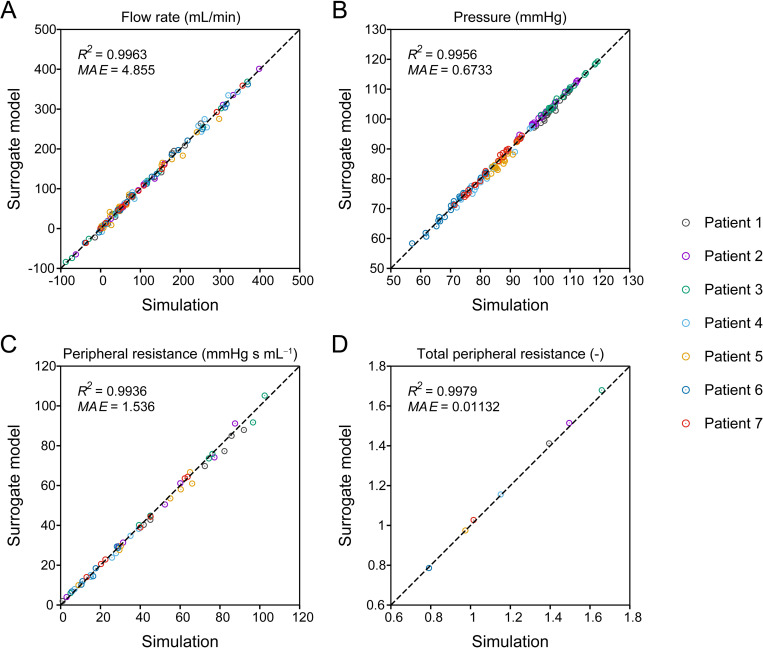
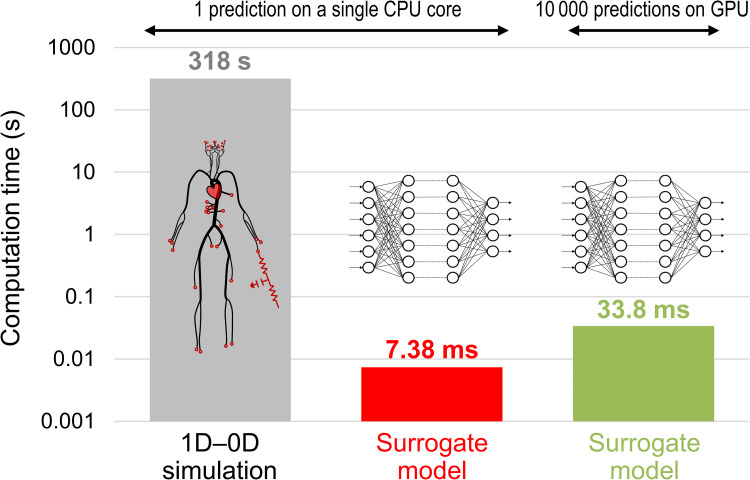
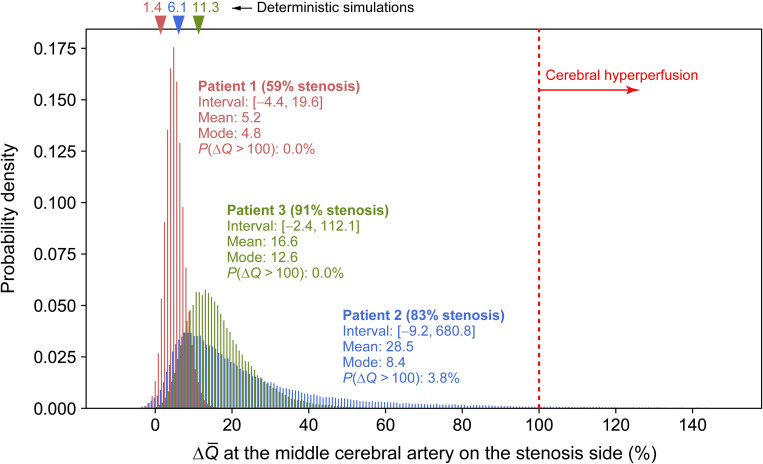
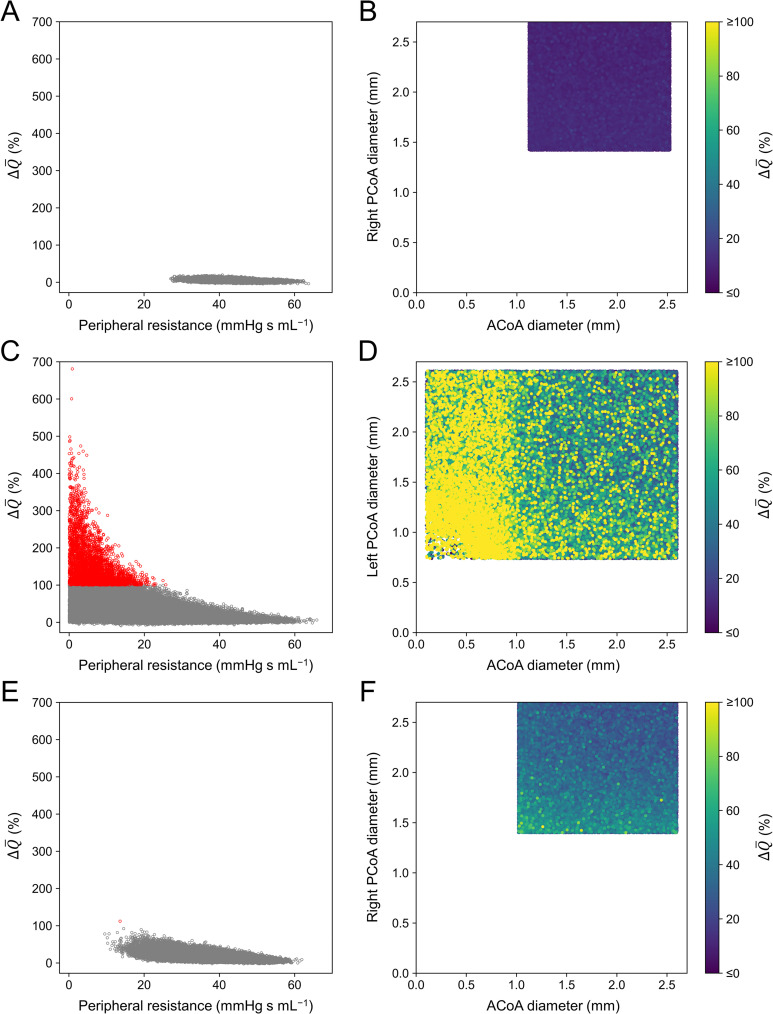
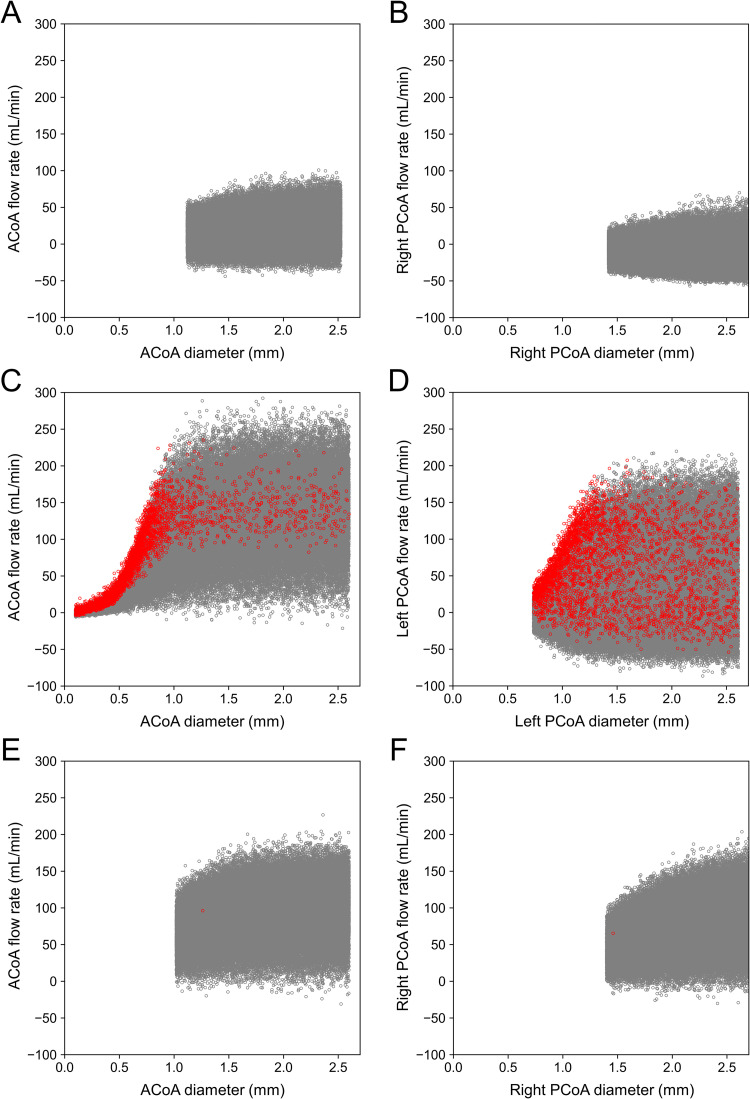
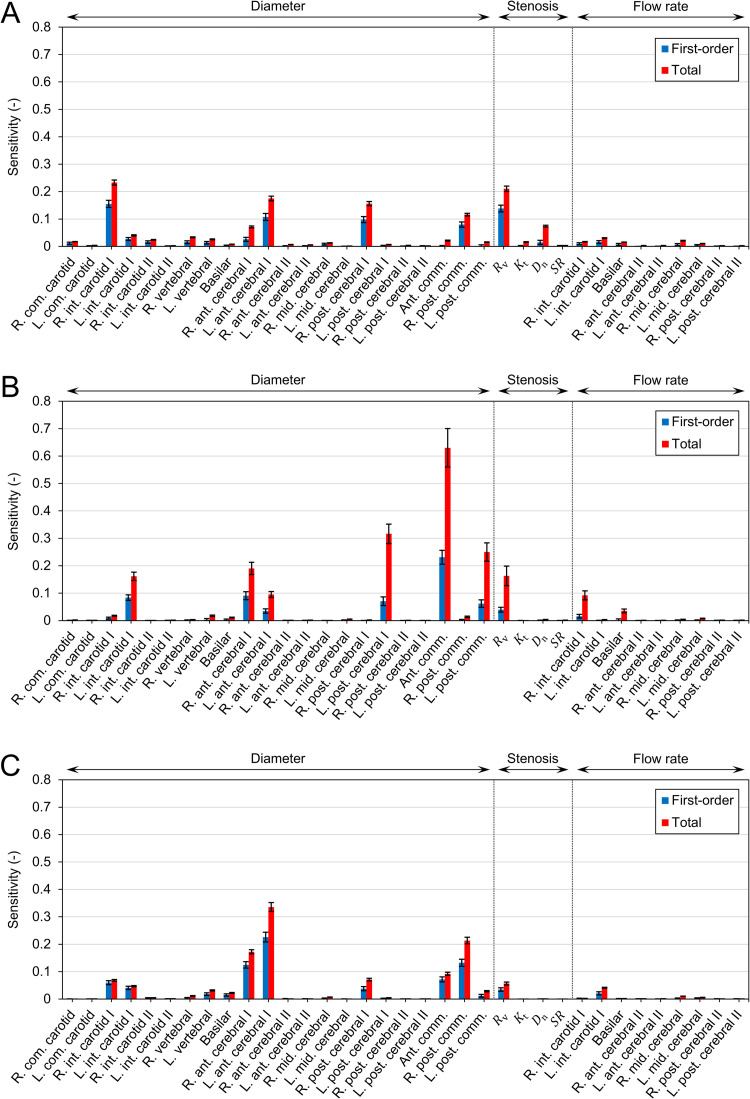
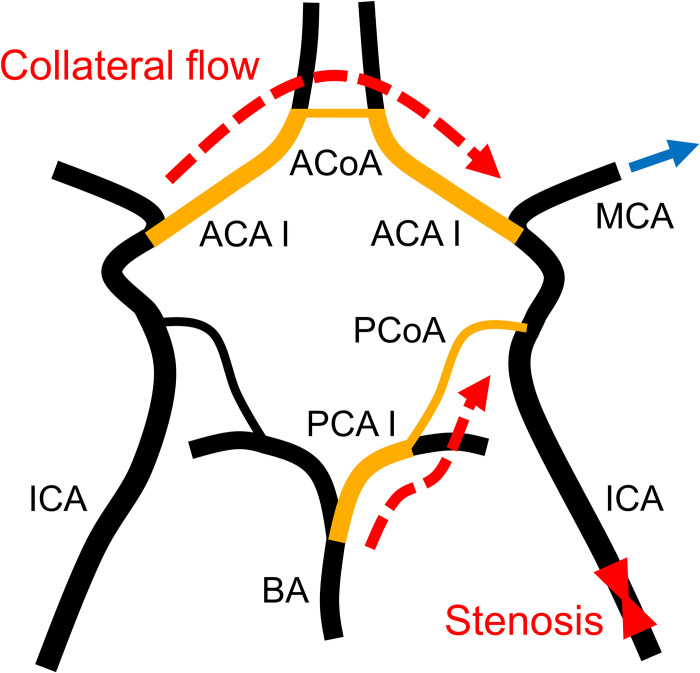
Collateral circulation in the circle of Willis (CoW), closely associated with disease mechanisms and treatment outcomes, can be effectively investigated using one-dimensional-zero-dimensional hemodynamic simulations. As the entire cardiovascular system is considered in the simulation, it captures the systemic effects of local arterial changes, thus reproducing collateral circulation that reflects biological phenomena. The simulation facilitates rapid assessment of clinically relevant hemodynamic quantities under patient-specific conditions by incorporating clinical data. During patient-specific simulations, the impact of clinical data uncertainty on the simulated quantities should be quantified to obtain reliable results. However, as uncertainty quantification (UQ) is time-consuming and computationally expensive, its implementation in time-sensitive clinical applications is considered impractical. Therefore, we constructed a surrogate model based on machine learning using simulation data. The model accurately predicts the flow rate and pressure in the CoW in a few milliseconds. This reduced computation time enables the UQ execution with 100 000 predictions in a few minutes on a single CPU core and in less than a minute on a GPU. We performed UQ to predict the risk of cerebral hyperperfusion (CH), a life-threatening condition that can occur after carotid artery stenosis surgery if collateral circulation fails to function appropriately. We predicted the statistics of the postoperative flow rate increase in the CoW, which is a measure of CH, considering the uncertainties of arterial diameters, stenosis parameters, and flow rates measured using the patients' clinical data. A sensitivity analysis was performed to clarify the impact of each uncertain parameter on the flow rate increase. Results indicated that CH occurred when two conditions were satisfied simultaneously: severe stenosis and when arteries of small diameter serve as the collateral pathway to the cerebral artery on the stenosis side. These findings elucidate the biological aspects of cerebral circulation in terms of the relationship between collateral flow and CH.


Conflict of interest statement

The authors have declared that no competing interests exist.

Figures

Fig 1
Fig 1. Overview of the proposed approach to perform uncertainty quantification.
We trained a deep neural network using the datasets obtained from one-dimensional–zero-dimensional (1D–0D) simulation. The datasets were generated by randomly sampling 60 inputs (column vector x∈ℝ60) describing the geometry of cerebral arteries and stenoses, and collecting the corresponding 45 simulation outputs (column vector ysim∈ℝ45) of time-averaged flow rates and pressures. After performing the data acquisition and model training in the offline phase, the surrogate model was used in the online phase to predict the outputs rapidly. This ensured a fast and efficient uncertainty quantification.
Fig 2
Fig 2. Schematic representation of the one-dimensional–zero-dimensional (1D–0D) model.
The 1D network comprises 83 arterial segments, including 22 segments (blue dots) composing the cerebral circulation. Cerebral arteries form a ring-like network, referred to as the circle of Willis, which supplies blood to the brain through the six outlets (green diamonds). The arrows indicate the direction of the flow defined as positive in the simulation. The inlet and outlet boundary conditions for the 1D network are obtained by coupling with the 0D closed-loop model, which represents the peripheral circulation and heart.
Fig 3
Fig 3. Computed tomography (CT) images of Patient 2.
(A) Transverse plane, (B) frontal plane, and (C) volume-rendered image. The ACoA was not recognized on CT images of this patient, suggesting hypoplasia of the ACoA. ACoA, anterior communicating artery; LACA, left anterior cerebral artery; RACA, right anterior cerebral artery.
Fig 4
Fig 4. Flowchart for uncertainty quantification using the Monte Carlo method.
For each Monte Carlo sample, peripheral resistances of the circle of Willis and the scaling factor for total peripheral resistance were adjusted (“preoperative adjustment”), followed by a virtual dilation of the stenosis to predict the cerebral circulation immediately after the surgery (“postoperative prediction”). The number of samples was increased sequentially until the statistics converged. The method can be applied to any probability density function; however, we assume a uniform distribution in this study. Additional details regarding the algorithm are provided in S2 Appendix.
Fig 5
Fig 5. Changes in the R2 score of the trained model.
(A) Changes with respect to the number of trainable parameters in the deep neural networks. The number of training samples was maintained constant at 120 000, and the R2 scores were evaluated using 40 000 test samples. Under- or over-parameterized indicate that the networks contain fewer or more trainable parameters than the number of training data, respectively. (B) Changes in the R2 score with respect to the number of samples used for training.
Fig 6
Fig 6. Comparison of one-dimensional–zero-dimensional (1D–0D) simulation and surrogate model predictions.
The (A) flow rate, (B) pressure, (C) adjusted peripheral resistance of the circle of Willis, and (D) adjusted scaling factor for total peripheral resistance in seven patient-specific cases are compared. The negative flow rate indicates that the flow direction is opposite to the arrows in Fig 2. The R2 scores and mean absolute errors (MAEs) of each quantity are depicted in the corresponding panels.
Fig 7
Fig 7. Comparison of the time required for prediction.
Computation times for a one-dimensional–zero-dimensional (1D–0D) simulation and surrogate model on one CPU core and a surrogate model on GPU are compared.
Fig 8
Fig 8. Probability density of the predicted value of postoperative flow increase (ΔQ¯).
Flow increase at the middle cerebral artery on the stenosis side is illustrated for Patients 1–3. Triangles indicate the values predicted by one-dimensional–zero-dimensional (1D–0D) simulation without considering uncertainties.
Fig 9
Fig 9. Postoperative flow increase (ΔQ¯) in Patients 1–3 relative to several factors.
Left column: scatter plot of ΔQ¯ at the middle cerebral artery on the stenosis side with respect to the adjusted preoperative peripheral resistance of this artery. Samples with ΔQ¯ > 100% are indicated in red. Right column: ΔQ¯ with respect to the diameters of the anterior communicating artery (ACoA) and posterior communicating artery (PCoA) that form the collateral pathway to the artery on the stenosis side. Samples with ΔQ¯ > 100% are depicted in yellow, regardless of their value. (A) (B) Patient 1; (C) (D) Patient 2; and (E) (F) Patient 3.
Fig 10
Fig 10. Scatter plots of preoperative flow rate versus diameter of the communicating arteries in Patients 1–3.
The results for the anterior communicating artery (ACoA) and posterior communicating artery (PCoA) that form the collateral pathway to the artery on the stenosis side are illustrated. The flow rate is indicated as a positive value if blood flows from the artery on the normal side to that on the stenosis side. Samples with ΔQ¯ > 100% are represented in red. (A) (B) Patient 1; (C) (D) Patient 2; and (E) (F) Patient 3.
Fig 11
Fig 11. Sensitivities of uncertain parameters to the postoperative flow increase (ΔQ¯).
The first-order (Sn) and total (ST,n) sensitivity indices are depicted as bars, and their 95% confidence intervals are represented by black lines. (A) Patient 1, (B) Patient 2, and (C) Patient 3.
Fig 12
Fig 12. Collateral flow to the middle cerebral artery downstream of the stenosis.
The middle cerebral artery receives blood supply from the contralateral and posterior inlets to compensate for the reduced blood flow caused by stenosis. ACA I, anterior cerebral artery I; ACoA, anterior communicating artery; BA, basilar artery; ICA, internal carotid artery; MCA, middle cerebral artery; PCA I, posterior cerebral artery I; PCoA, posterior communicating artery.

Similar articles

Cited by

References

    1. North American Symptomatic Carotid Endarterectomy Trial Collaborators. Beneficial effect of carotid endarterectomy in symptomatic patients with high-grade carotid stenosis. N Engl J Med. 1991; 325(7):445–453. doi: 10.1056/NEJM199108153250701 - DOI - PubMed
    1. Song P, Fang Z, Wang H, Cai Y, Rahimi K, Zhu Y, et al.. Global and regional prevalence, burden, and risk factors for carotid atherosclerosis: a systematic review, meta-analysis, and modelling study. Lancet Glob Health. 2020; 8(5):e721–e729. doi: 10.1016/S2214-109X(20)30117-0 - DOI - PubMed
    1. Olufsen MS, Peskin CS, Kim WY, Pedersen EM, Nadim A, Larsen J. Numerical simulation and experimental validation of blood flow in arteries with structured-tree outflow conditions. Ann Biomed Eng. 2000; 28(11):1281–1299. doi: 10.1114/1.1326031 - DOI - PubMed
    1. Smith NP, Pullan AJ, Hunter PJ. An anatomically based model of transient coronary blood flow in the heart. SIAM J Appl Math. 2002; 62(3):990–1018. 10.1137/S0036139999355199 - DOI
    1. Sherwin SJ, Franke V, Peiró J, Parker K. One-dimensional modelling of a vascular network in space-time variables. J Eng Math. 2003; 47(3):217–250. 10.1023/B:ENGI.0000007979.32871.e2 - DOI

Publication types