. 2022 Aug:82:104179.
doi: 10.1016/j.ebiom.2022.104179. Epub 2022 Jul 19.

Immune aging in multiple sclerosis is characterized by abnormal CD4 T cell activation and increased frequencies of cytotoxic CD4 T cells with advancing age

Affiliations

Immune aging in multiple sclerosis is characterized by abnormal CD4 T cell activation and increased frequencies of cytotoxic CD4 T cells with advancing age

Leah Zuroff et al. EBioMedicine. 2022 Aug.

Abstract

Background: Immunosenescence (ISC) describes age-related changes in immune-system composition and function. Multiple sclerosis (MS) is a lifelong inflammatory condition involving effector and regulatory T-cell imbalance, yet little is known about T-cell ISC in MS. We examined age-associated changes in circulating T cells in MS compared to normal controls (NC).

Methods: Forty untreated MS (Mean Age 43·3, Range 18-72) and 49 NC (Mean Age 48·6, Range 20-84) without inflammatory conditions were included in cross-sectional design. T-cell subsets were phenotypically and functionally characterized using validated multiparametric flow cytometry. Their aging trajectories, and differences between MS and NC, were determined using linear mixed-effects models.

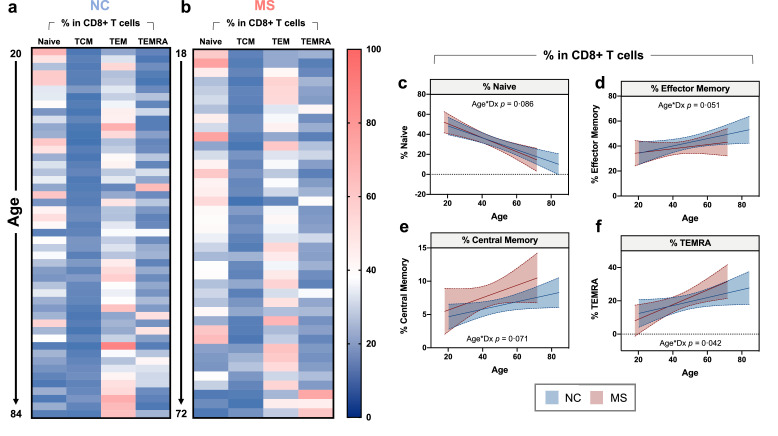
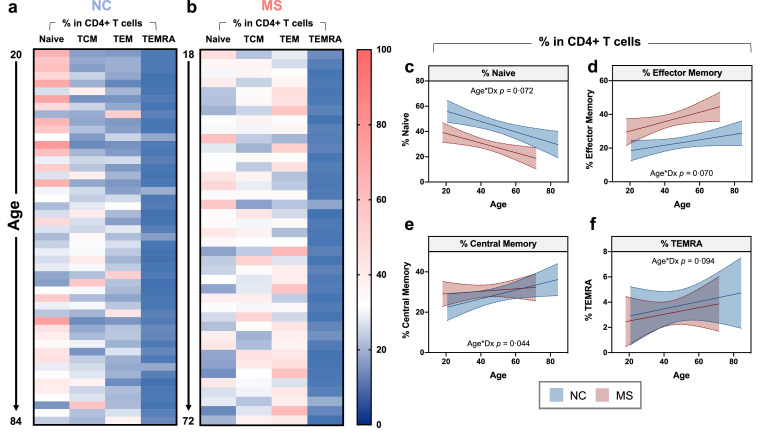
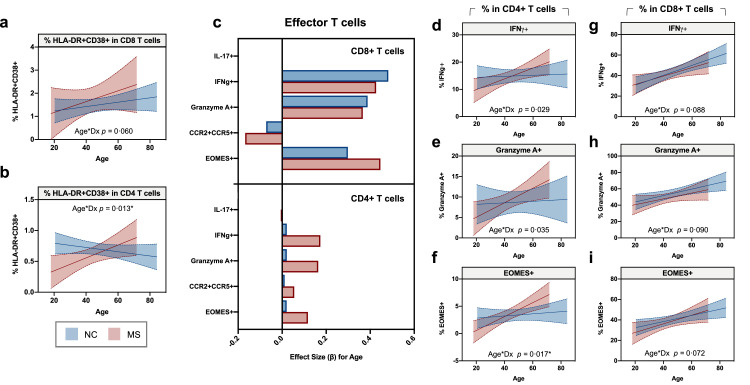
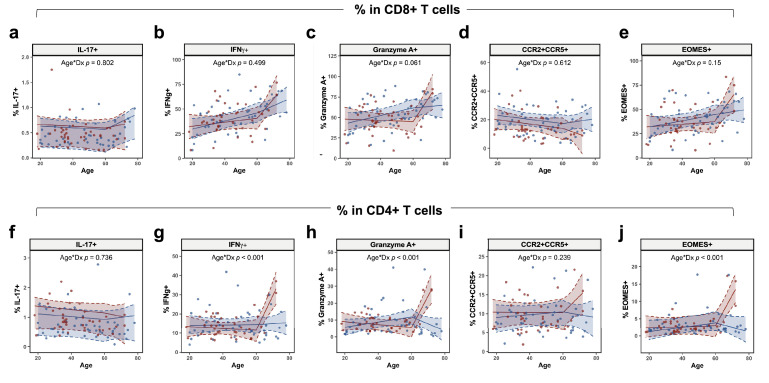
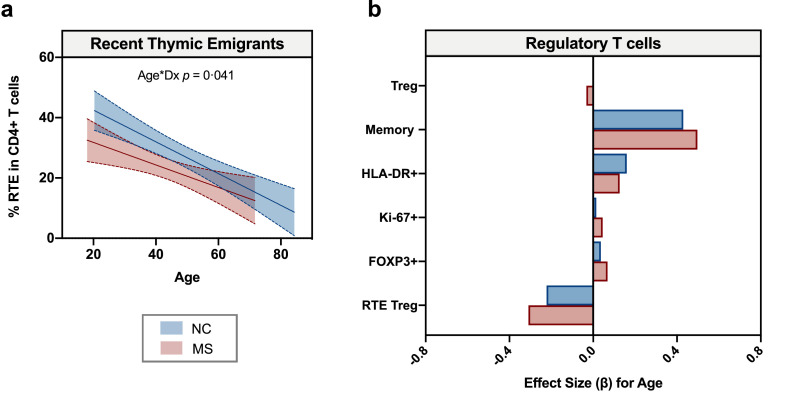
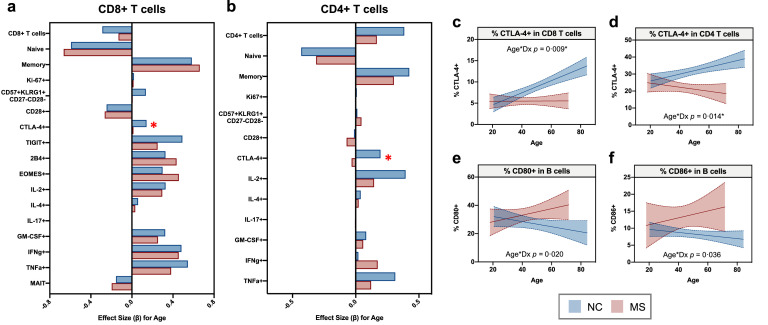
Findings: MS patients demonstrated early and persistent redistribution of naïve and memory CD4 T-cell compartments. While most CD4 and CD8 T-cell aging trajectories were similar between groups, MS patients exhibited abnormal age-associated increases of activated (HLA-DR+CD38+; (P = 0·013) and cytotoxic CD4 T cells, particularly in patients >60 (EOMES: P < 0·001). Aging MS patients also failed to upregulate CTLA-4 expression on both CD4 (P = 0·014) and CD8 (P = 0·009) T cells, coupled with abnormal age-associated increases in frequencies of B cells expressing costimulatory molecules.

Interpretation: While many aspects of T-cell aging in MS are conserved, the older MS patients harbour abnormally increased frequencies of CD4 T cells with activated and cytotoxic effector profiles. Age-related decreased expression of T-cell co-inhibitory receptor CTLA-4, and increased B-cell costimulatory molecule expression, may provide a mechanism that drives aberrant activation of effector CD4 T cells that have been implicated in progressive disease.

Funding: Stated in Acknowledgements section of manuscript.

Keywords: Aging; Immunosenescence; Multiple sclerosis; T lymphocytes.


Conflict of interest statement

Declaration of interests L.Z. received funding from the National Center for Advancing Sciences of the National Institutes of Health. T.F.T. has received personal fees from Sanofi-Genzyme, outside the submitted work. A.C.P. reports an iAward (Innovation award), a partnership between University of Pennsylvania and Sanofi, during the conduct of this study. RTS has received consulting fees from Octave Biosciences and American Medical Association. D.J. has received consulting fees and/or research support from: Biogen, Genentech, Novartis, EMD Serono, Banner Life Sciences, Bristol Myers Squibb, Horizon, Sanofi Genzyme. RNA has received consulting fees from Avrobio, Caraway, Ono Therapeutics, GlaxoSmithKline, Merck, and Sanofi/Genzyme. A.B.O. reports grants from EMDSerono, during the conduct of the study; grants and personal fees from Biogen Idec, grants and personal fees from Genentech/Roche, personal fees from GlaxoSmithKline, grants and personal fees from Merck/EMD Serono, personal fees from Medimmune, grants and personal fees from Novartis, personal fees from Celgene/Receptos, personal fees from Sanofi-Genzyme, personal fees from Atara Biotherapeutics, personal fees from Janssen/Actelion, outside the submitted work.

Figures

Figure 1
Figure 1
Age-related changes in major naïve and memory CD8 T cell subsets are comparable in MS and NC. (a, b) Heatmaps depict frequencies of naïve and memory CD8 T cell subsets in individual participants from (a) NC and (b) MS cohorts. Frequencies range from 0% (blue) to 100% (red). Individual participants are ordered along the y-axis from youngest (top) to oldest (bottom). Plots c-f are visual representations of the relationships between frequencies of CD8+ T cell subsets and age, with distinct linear regression curves shown for NC (blue curves) and MS patients (red curves) with their respective 95% confidence intervals. Plots demonstrate relationships between age and (c) naïve CD4 T cells, (d) effector memory (TEM) CD4 T cells, (e) central memory (TCM) CD4 T cells, and (f) effector memory CD4 T cells re-expressing CD45RA (TEMRA). All frequencies of naïve and memory T cell populations are reported within total CD8 T cells. The adjusted P-values reported are for the interaction term between age and MS diagnosis (Age*Dx) in the linear mixed model. Significant P-values indicate differential effects of age on subset frequency within NC and MS participants. No relationships were significant after correcting for multiple comparisons. (For interpretation of the references to color in this figure legend, the reader is referred to the web version of this article.)
Figure 2
Figure 2
Aging in MS is characterized by early and persistent differences in naïve and effector memory CD4 T cells compared to NC. (a, b) Heatmaps depict frequencies of naïve and memory CD4 T cell subsets in individual participants from (a) NC and (b) MS cohorts. Frequencies range from 0% (blue) to 100% (red). Individual participants are ordered along the y-axis from youngest (top) to oldest (bottom). Plots c-f are visual representations of the relationships between frequencies of CD4 T cell subsets and age, with distinct linear regression curves shown for NC (blue curves) and MS patients (red curves) with their respective 95% confidence intervals. Plots demonstrate relationships between age and (c) naïve CD4 T cells, (d) effector memory (TEM) CD4 T cells, (e) central memory (TCM) CD4 T cells, and (f) effector memory CD4 T cells re-expressing CD45RA (TEMRA). All frequencies of naïve and memory T cell populations are reported within total CD4 T cells. The adjusted P-values reported are for the interaction term between age and MS diagnosis (Age*Dx) in the linear mixed model. Significant P-values indicate differential effects of age on subset frequency within NC and MS subjects. *Denotes statistical significance after correcting for multiple comparisons. (For interpretation of the references to color in this figure legend, the reader is referred to the web version of this article.)
Figure 3
Figure 3
Changes in effector CD8 and CD4 T cells populations across the age span in NC and MS. Linear mixed effects models were performed to evaluate the relationship between age and frequencies of activated T cells as well as major MS-implicated effector CD8 and CD4 T cell subsets. Plots a and b demonstrate age-related trajectories of activated HLA-DR+CD38+ CD8 and CD4 T cells, respectively. Distinct linear regression curves are shown for NC (blue curves) and MS patients (red curves) with their respective 95% confidence intervals. (c) For MS-implicated effector subjects, bar chart plots the β-coefficients for the age term in each model for NC (blue bars) and MS patients (red bars), separately. Plots d-i demonstrate the different age-related trajectories of select effector T cell subsets, for which there was either a trend level or statistically significant difference between MS and NC participants. Distinct linear regression curves with respective 95% confidence intervals are shown for NC (blue curves) and MS patients (red curves). Effector subsets depicted are as follows: (d) IFNγ+ CD4 T cells, (e) Granzyme A+ CD4 T cells, (f) EOMES+ CD4 T cells, (g) IFNγ+ CD8 T cells, (h) Granzyme A+ CD8 T cells, and (i) EOMES+ CD8 T cells. All frequencies of effector T cell populations are reported within total CD4 and CD8 T cells. The adjusted P-values reported are for the interaction term between age and MS diagnosis (Age*Dx) in the linear mixed model. Significant P-values indicate differential effects of age on subset frequency within NC and MS participants. *Denotes statistical significance after correcting for multiple comparisons. (For interpretation of the references to color in this figure legend, the reader is referred to the web version of this article.)
Figure 4
Figure 4
Assessing non-linear age-related changes in effector CD8 and CD4 T cell subsets in NC and MS. A piecewise linear mixed effects model was fit to age, with a breakpoint at age 60 to assess for differences in age-associated T cell trajectories. Fixed effects included age, sex, diagnosis (NC or MS), as well as an interaction term age*diagnosis (Age*Dx), which indicates whether a diagnosis of MS affects the relationship between age and cell subset frequencies. Batch was treated as a random intercept. Plots show the model fits for effector CD8 (upper panel) and CD4 (lower panel) T cell subsets: (a) IL-17+ CD8 T cells, (b) IFNγ+ CD8 T cells, (c) Granzyme A+ CD8 T cells, (d) CCR2+CCR5+ CD8 T cells, (e) EOMES+ CD8 T cells, (f) IL-17+ CD4 T cells, (g) IFNγ+ CD4 T cells, (h) Granzyme A+ CD4 T cells, (i) CCR2+CCR5+ CD4 T cells, (j) EOMES+ CD4 T cells. Each plot includes distinct regression curves above and below the age breakpoint of 60 years with 95% confidence intervals for NC (blue curves) and MS patients (red curves). Individual subjects are represented by dots: NC in blue and MS in red. All frequencies of effector T cell populations are reported within total CD4 and CD8 T cells. The unadjusted P-values reported are for the interaction term between age and MS diagnosis (Age*Dx) in the mixed model. The individual data points, regression lines and statistics for models fit on control and MS cohorts are shown separately in Supplementary Figure 7. Significant P-values indicate differential effects of age on subset frequency within NC and MS participants. (For interpretation of the references to color in this figure legend, the reader is referred to the web version of this article.)
Figure 5
Figure 5
Age-related changes in recent thymic emigrants (RTE) and regulatory T cells (Treg). Linear mixed effects models were performed to evaluate the relationship between age and frequencies of RTEs within total CD4 T cells (a) as well as total Tregs and Treg subsets (b). Treg subset frequencies were calculated within total Treg population, while frequencies of Tregs were calculated within total CD4 T cells. Plot (a) demonstrates age-related trajectories for RTEs, with distinct linear regression curves shown for NC (blue curves) and MC patients (red curves) and their respective 95% confidence intervals. The adjusted P-value reported is for the interaction term are between age and MS diagnosis (Age*Dx). Bar chart in (b) plots the β-coefficients for the age term in each model for NC (blue bars) and MS patients (red bars), for Tregs subsets. There were no statistically significant differences in aging in NC and MS for any of the above subsets. (For interpretation of the references to color in this figure legend, the reader is referred to the web version of this article.)
Figure 6
Figure 6
Evaluating changes in additional CD8 and CD4 T cells subsets across the age span demonstrates different aging trajectories for CTLA-4-expressing CD8 and CD4 T cells that are accompanied by a relative increase in CD80+ B cells. Linear mixed effects models were performed to evaluate the relationship between frequencies of additional T cell subsets and age in NC and MS separately. Bar charts plot the β-coefficients for the age term in each model for NC (blue bars) and MS patients (red bars) within (a) CD8 T cells and (b) CD4 T cells. Red asterisks denote those T cell subsets for which there was a statistically significant difference in aging trajectories in MS vs NC after correcting for multiple comparisons. Plots b and d depict the relationship between age and CTLA-4+ CD8 and CD4 T cells, respectively. Age-related changes in frequencies of B cells expressing CD80 and CD86, which are ligands of CTLA-4, are shown in (e) and (f), respectively. Frequencies of CD80+ and CD86+ B cells were calculated as within total B cells. Distinct linear regression curves for NC (blue curves) and MS patients (red curves) are shown with their respective 95% confidence intervals. The adjusted P-values reported are for the interaction term between age and MS diagnosis (Age*Dx) in the linear mixed model. Significant P-values indicate differential effects of age on subset frequency within NC and MS subjects. *Denotes statistical significance after correcting for multiple comparisons. (For interpretation of the references to color in this figure legend, the reader is referred to the web version of this article.)

Similar articles

Cited by

References

    1. Thompson AJ, Banwell BL, Barkhof F, et al. Diagnosis of multiple sclerosis: 2017 revisions of the McDonald criteria. Lancet Neurol. 2018;17(2):162–173. - PubMed
    1. Reich DS, Lucchinetti CF, Calabresi PA. Multiple sclerosis. New Engl J Med. 2018;378(2):169–180. - PMC - PubMed
    1. Mittelbrunn M, Kroemer G. Hallmarks of T cell aging. Nat Immunol. 2021;22(6):687–698. - PubMed
    1. Fulop T, Larbi A, Dupuis G, et al. Immunosenescence and inflamm-aging as two sides of the same coin: friends or foes? Front Immunol. 2018;8:1960. - PMC - PubMed
    1. Franceschi C, BonafÈ M, Valensin S, et al. Inflamm-aging: an evolutionary perspective on immunosenescence. Ann Ny Acad Sci. 2000;908(1):244–254. - PubMed