. 2022 Aug 8;40(8):850-864.e9.
doi: 10.1016/j.ccell.2022.07.002. Epub 2022 Jul 21.

Integrative analysis of drug response and clinical outcome in acute myeloid leukemia

Daniel Bottomly  1 Nicola Long  2 Anna Reister Schultz  3 Stephen E Kurtz  2 Cristina E Tognon  2 Kara Johnson  2 Melissa Abel  3 Anupriya Agarwal  4 Sammantha Avaylon  2 Erik Benton  5 Aurora Blucher  1 Uma Borate  6 Theodore P Braun  2 Jordana Brown  3 Jade Bryant  3 Russell Burke  2 Amy Carlos  7 Bill H Chang  8 Hyun Jun Cho  9 Stephen Christy  2 Cody Coblentz  2 Aaron M Cohen  10 Amanda d'Almeida  3 Rachel Cook  2 Alexey Danilov  11 Kim-Hien T Dao  12 Michie Degnin  2 James Dibb  2 Christopher A Eide  2 Isabel English  2 Stuart Hagler  5 Heath Harrelson  5 Rachel Henson  7 Hibery Ho  2 Sunil K Joshi  2 Brian Junio  2 Andy Kaempf  13 Yoko Kosaka  9 Ted Laderas  14 Matt Lawhead  5 Hyunjung Lee  3 Jessica T Leonard  2 Chenwei Lin  7 Evan F Lind  9 Selina Qiuying Liu  2 Pierrette Lo  2 Marc M Loriaux  15 Samuel Luty  2 Julia E Maxson  16 Tara Macey  2 Jacqueline Martinez  2 Jessica Minnier  17 Andrea Monteblanco  2 Motomi Mori  18 Quinlan Morrow  3 Dylan Nelson  19 Justin Ramsdill  5 Angela Rofelty  3 Alexandra Rogers  2 Kyle A Romine  3 Peter Ryabinin  1 Jennifer N Saultz  2 David A Sampson  2 Samantha L Savage  2 Robert Schuff  20 Robert Searles  7 Rebecca L Smith  2 Stephen E Spurgeon  2 Tyler Sweeney  2 Ronan T Swords  2 Aashis Thapa  2 Karina Thiel-Klare  2 Elie Traer  2 Jake Wagner  2 Beth Wilmot  5 Joelle Wolf  2 Guanming Wu  10 Amy Yates  5 Haijiao Zhang  16 Christopher R Cogle  21 Robert H Collins  22 Michael W Deininger  23 Christopher S Hourigan  24 Craig T Jordan  25 Tara L Lin  26 Micaela E Martinez  27 Rachel R Pallapati  27 Daniel A Pollyea  25 Anthony D Pomicter  28 Justin M Watts  29 Scott J Weir  30 Brian J Druker  31 Shannon K McWeeney  32 Jeffrey W Tyner  33
Affiliations

Integrative analysis of drug response and clinical outcome in acute myeloid leukemia

Daniel Bottomly et al. Cancer Cell. .

Abstract

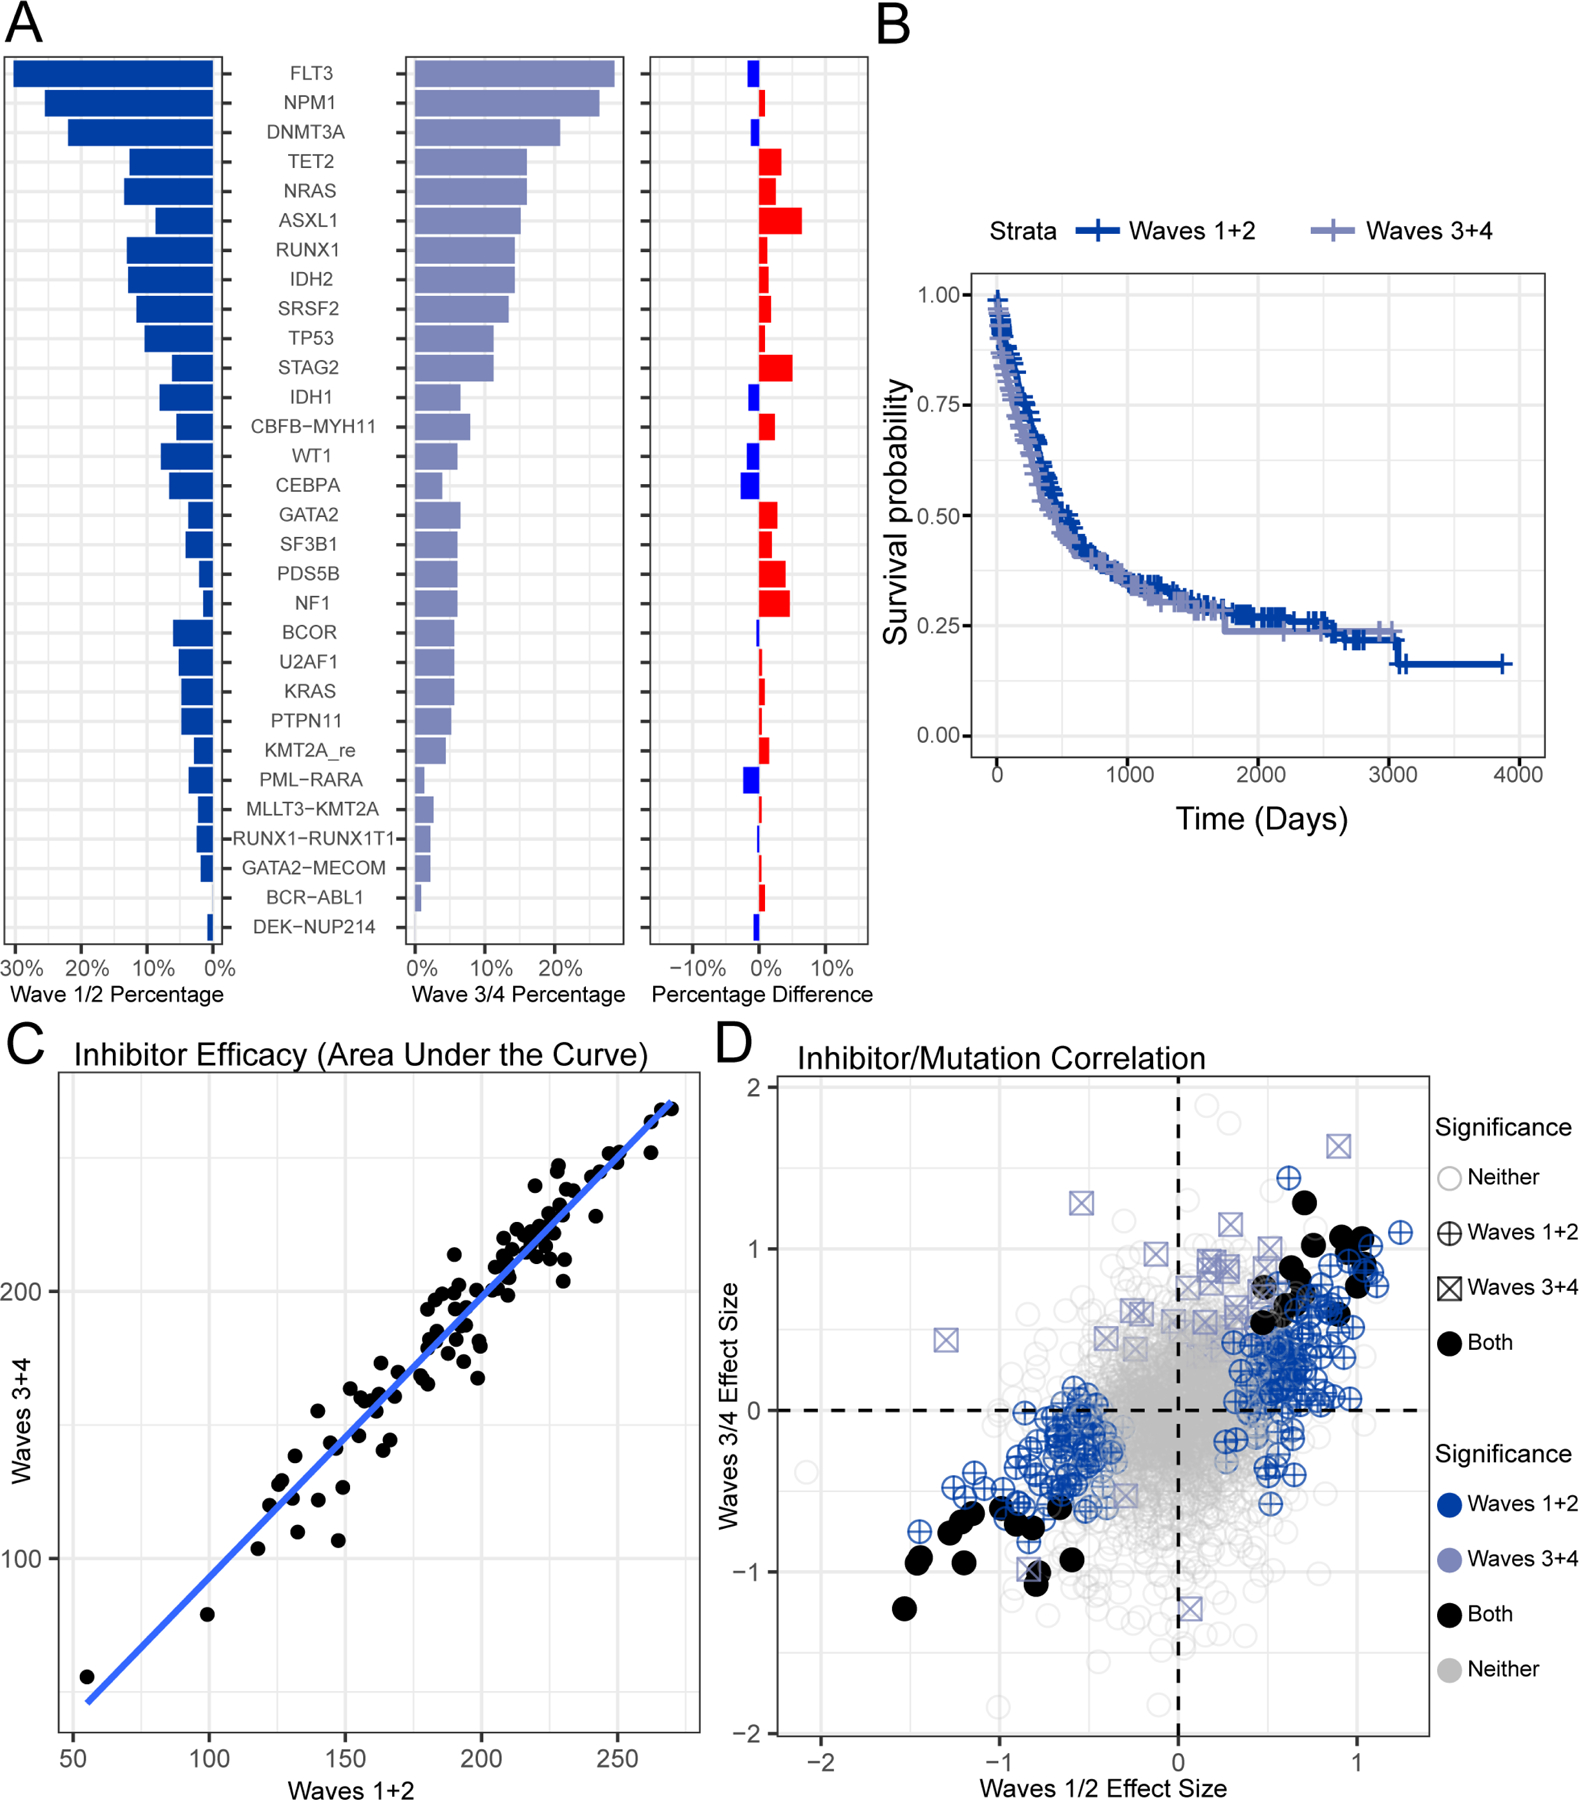
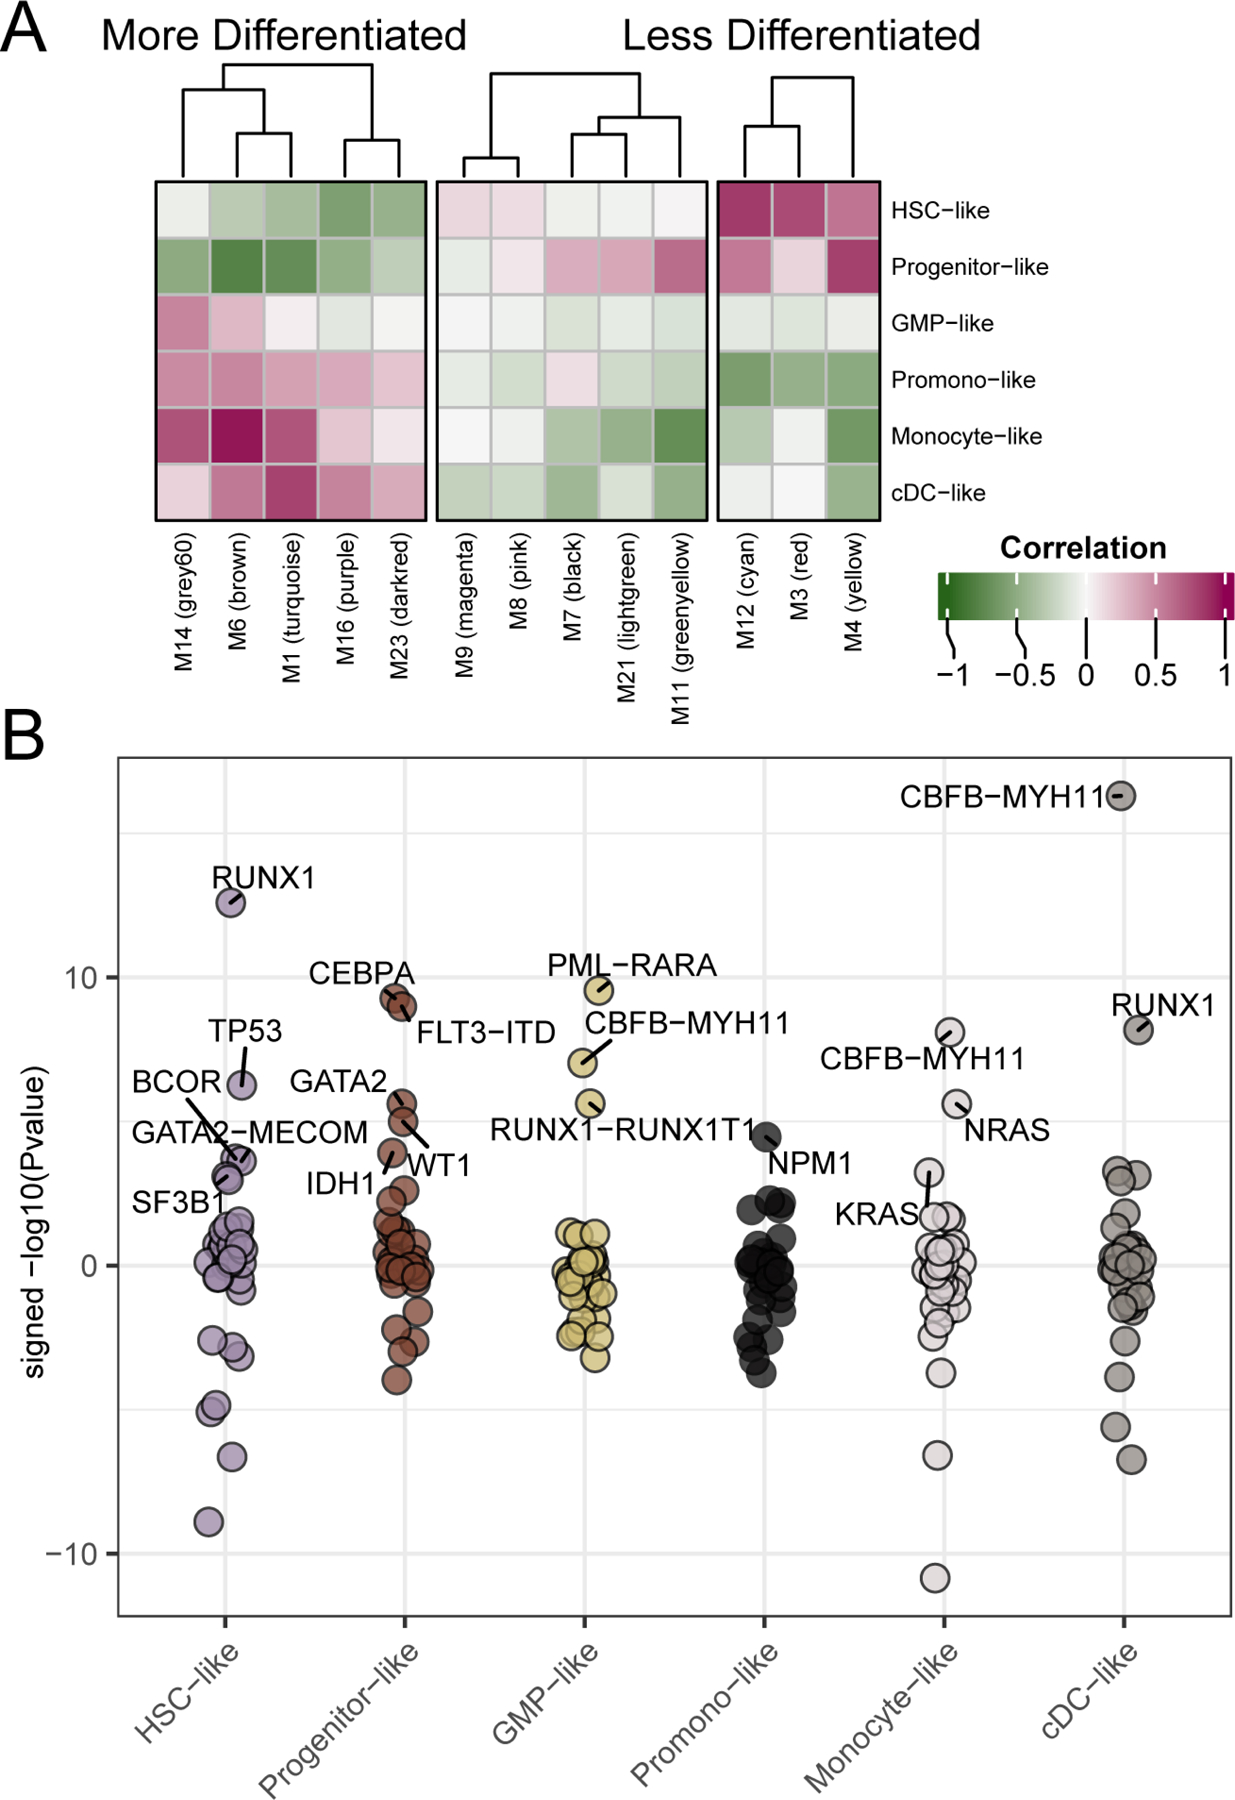
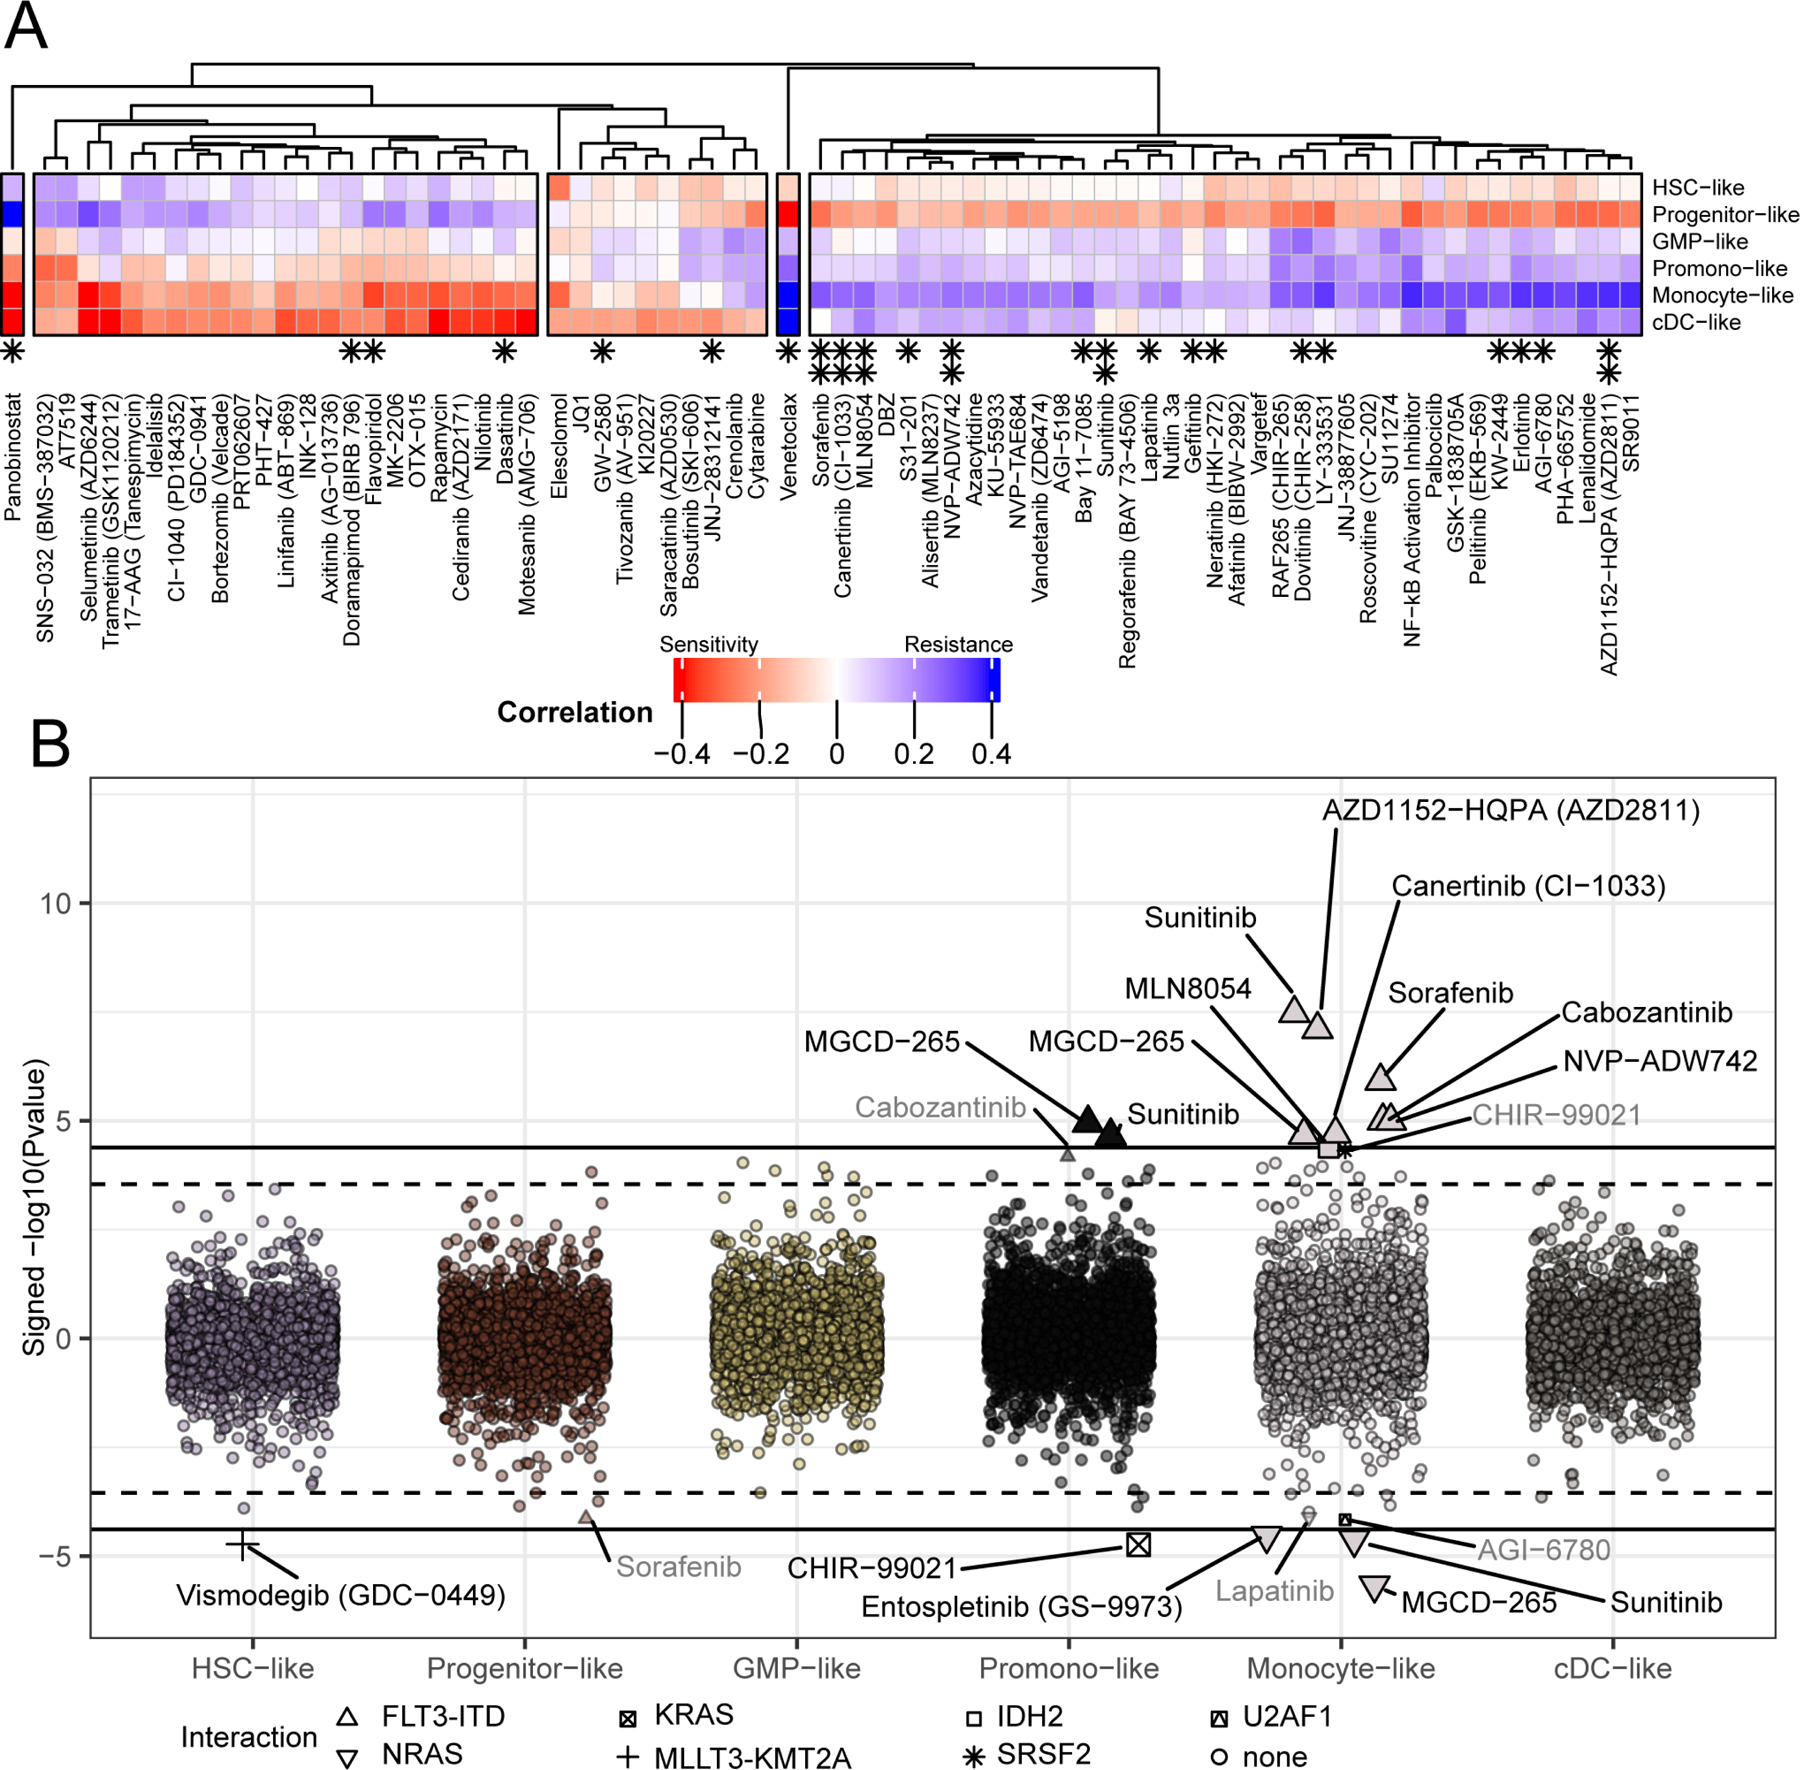
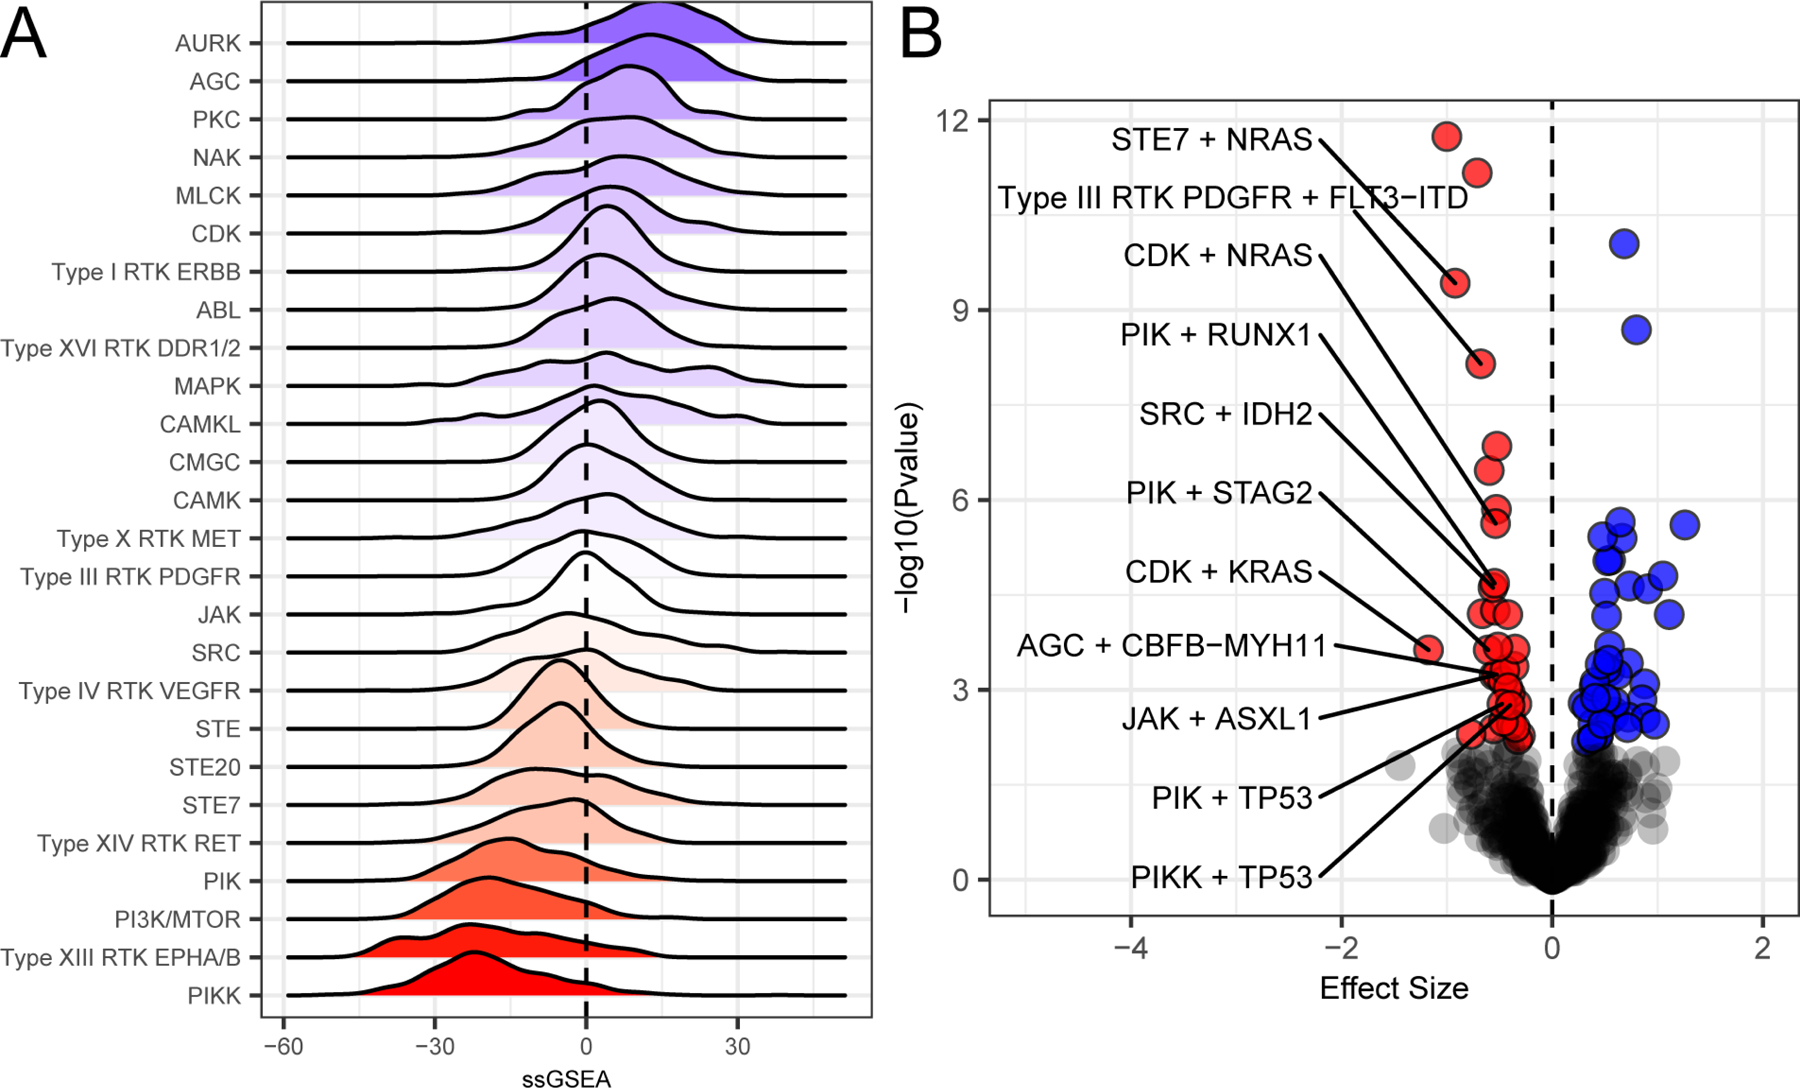
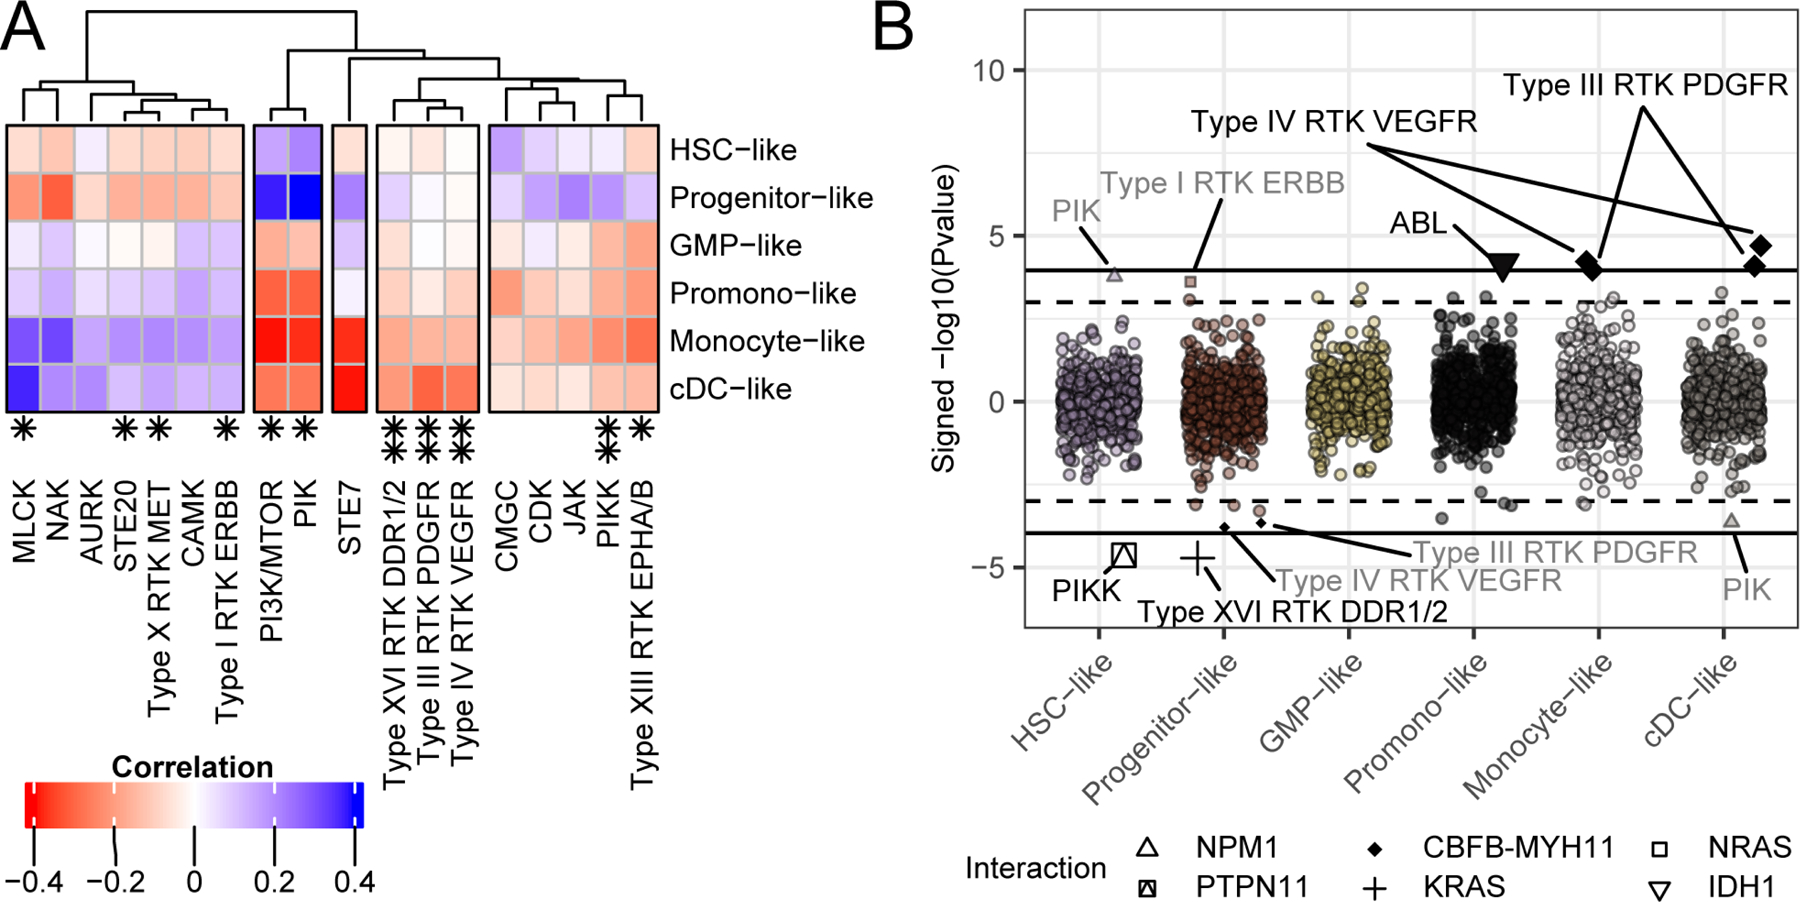
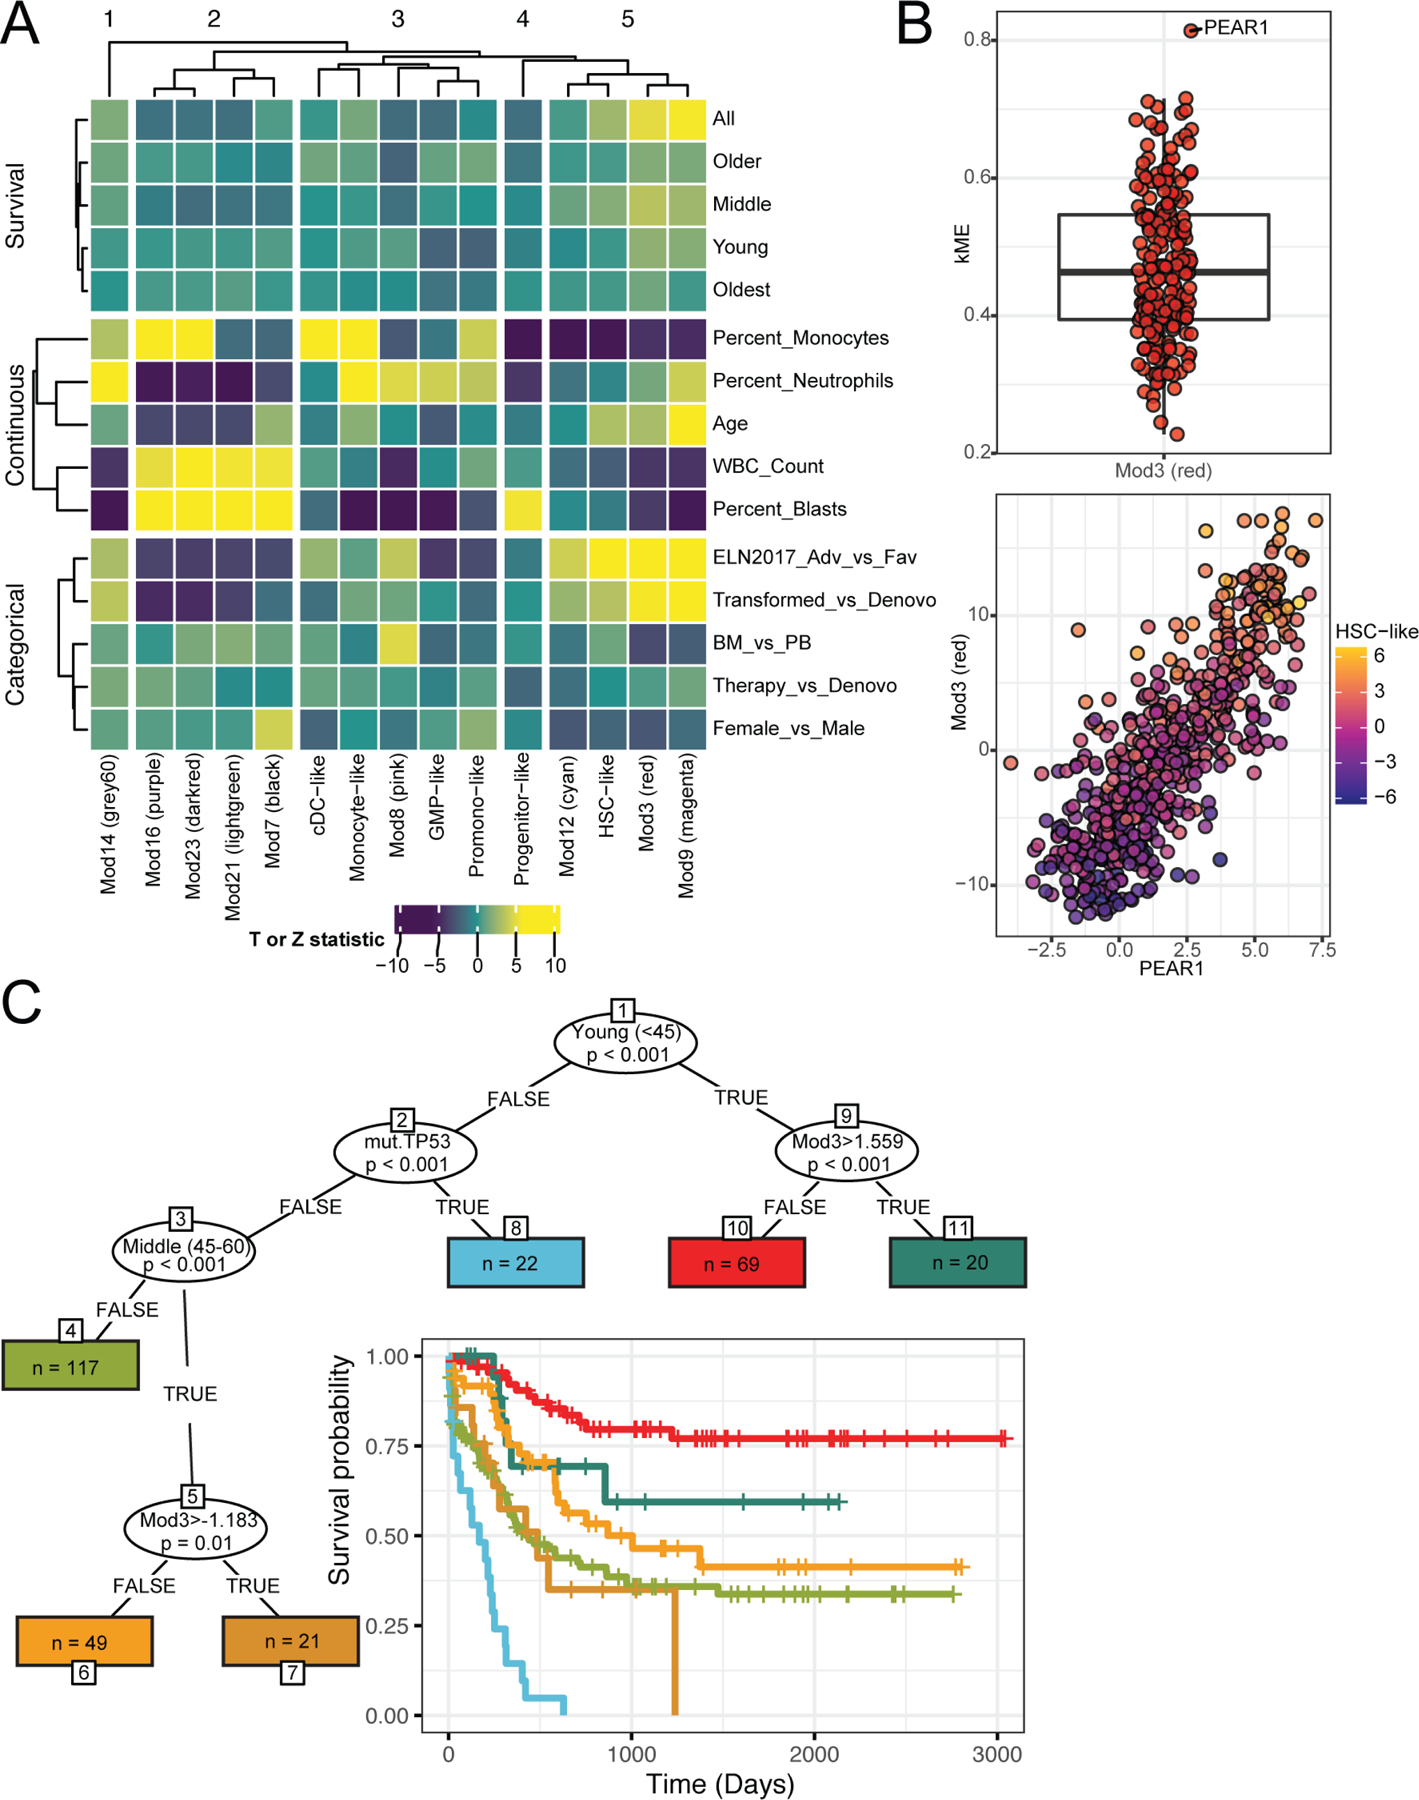
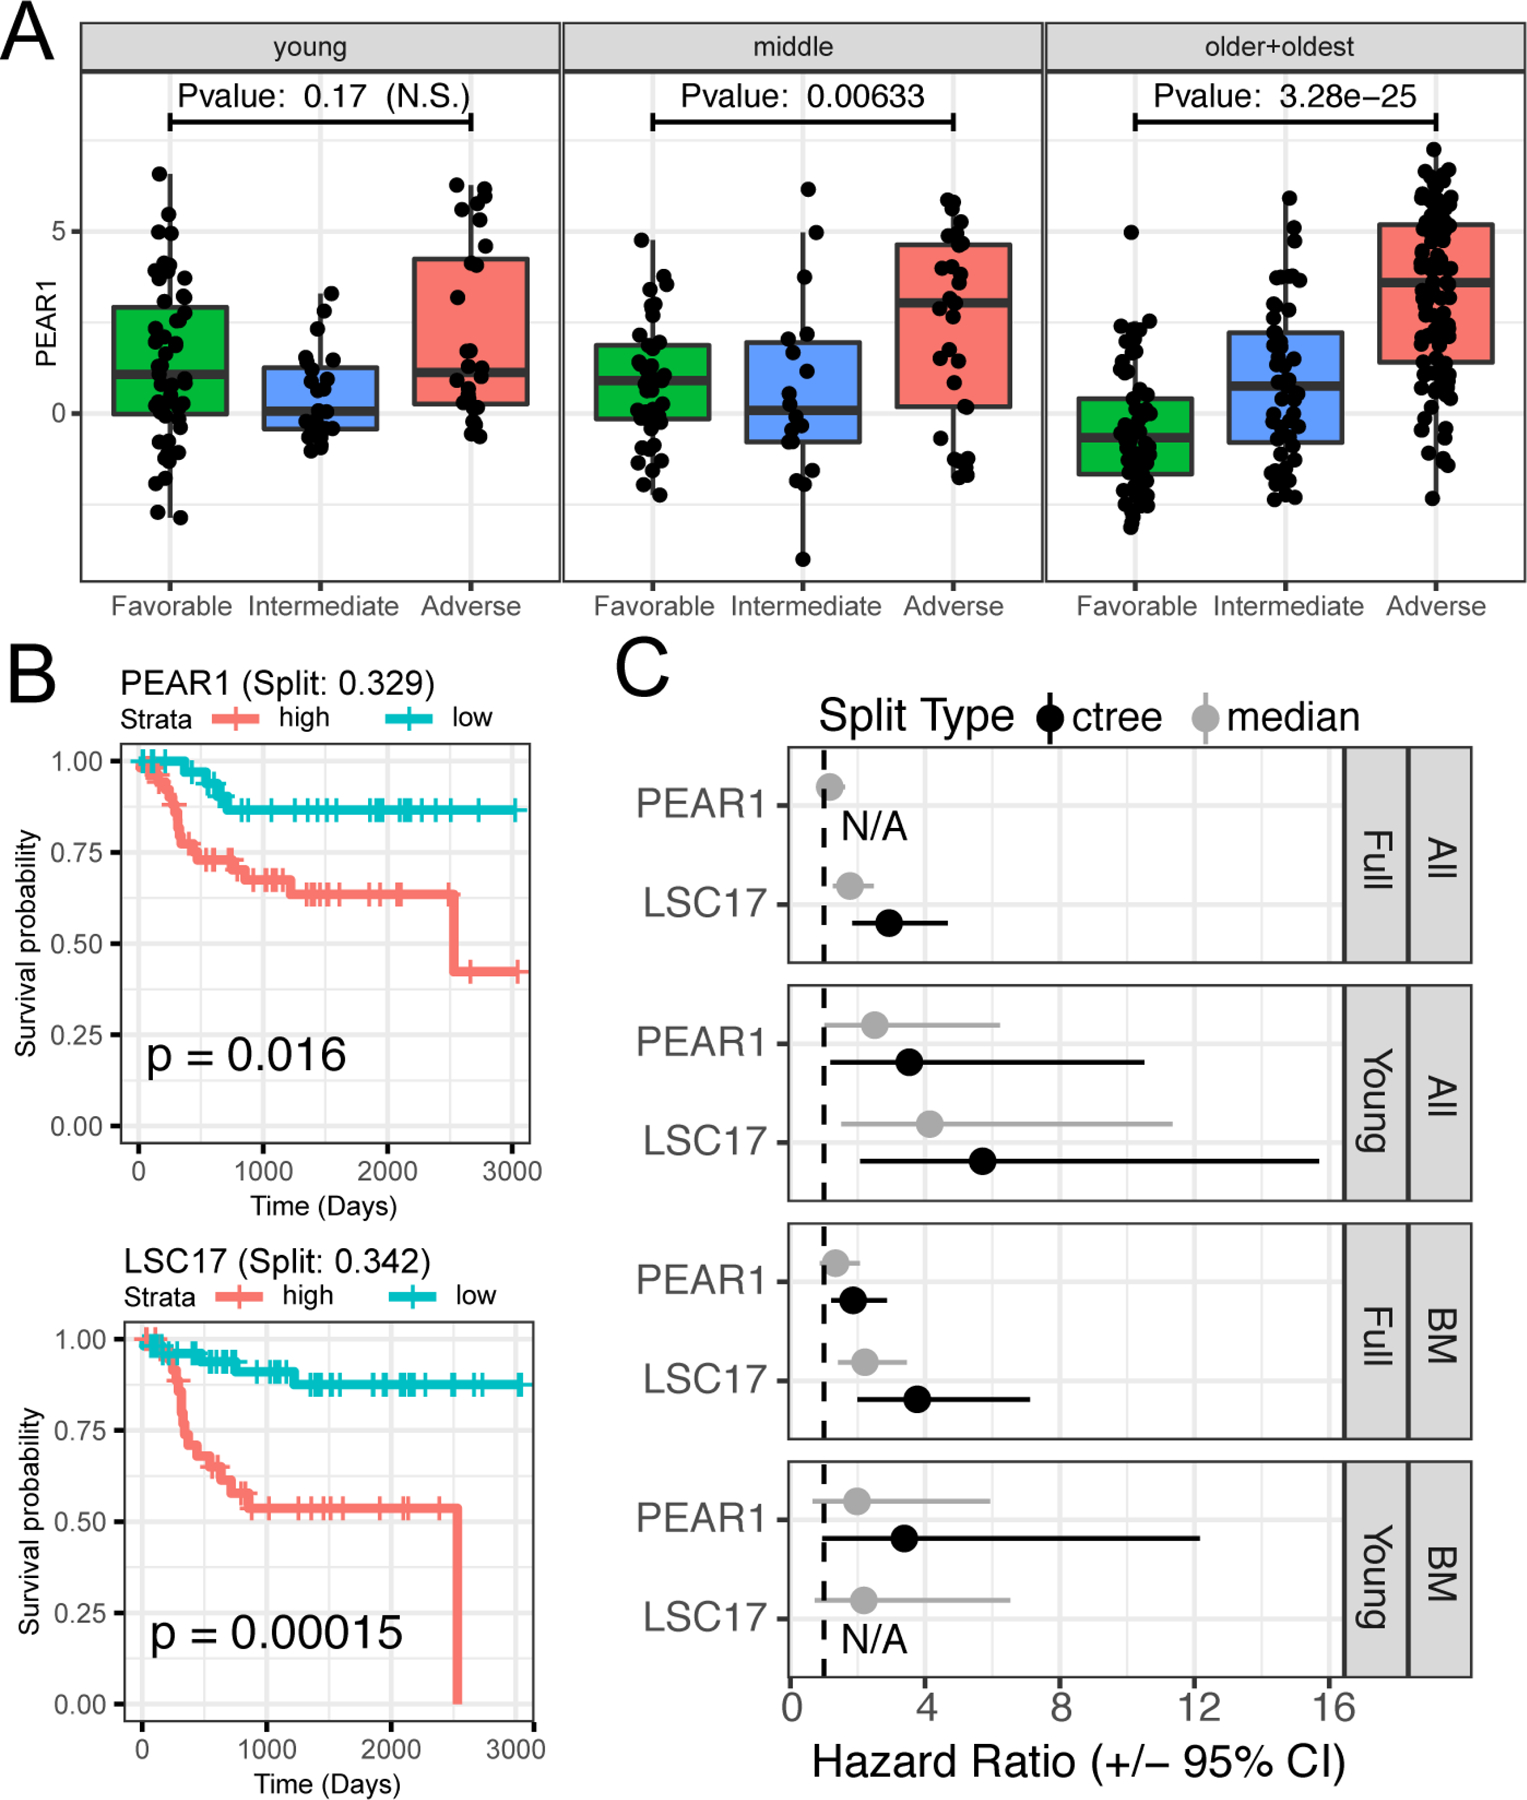
Acute myeloid leukemia (AML) is a cancer of myeloid-lineage cells with limited therapeutic options. We previously combined ex vivo drug sensitivity with genomic, transcriptomic, and clinical annotations for a large cohort of AML patients, which facilitated discovery of functional genomic correlates. Here, we present a dataset that has been harmonized with our initial report to yield a cumulative cohort of 805 patients (942 specimens). We show strong cross-cohort concordance and identify features of drug response. Further, deconvoluting transcriptomic data shows that drug sensitivity is governed broadly by AML cell differentiation state, sometimes conditionally affecting other correlates of response. Finally, modeling of clinical outcome reveals a single gene, PEAR1, to be among the strongest predictors of patient survival, especially for young patients. Collectively, this report expands a large functional genomic resource, offers avenues for mechanistic exploration and drug development, and reveals tools for predicting outcome in AML.

Keywords: JEDI; LSC17; MEGF12; cell state; eigengene; hematologic malignancy; leukemia stem cell; monocyte; targeted therapy.


Conflict of interest statement

Declaration of interests C.E.T. receives research support from Notable Labs and serves as a scientific liaison for AstraZeneca. J.E.M. receives research funding from Gilead Pharmaceutical and serves on a scientific advisory board for Ionis Pharmaceuticals. M.W.D. serves on the advisory boards and/or as a consultant for Novartis, Incyte, and BMS and receives research funding from BMS and Gilead. C.S.H. receives research funding from Sellas. T.L.L. consults for Jazz Pharmaceuticals and receives research funding from Tolero, Gilead, Prescient, Ono, Bio-Path, Mateon, Genentech/Roche, Trovagene, AbbVie, Pfizer, Celgene, Imago, Astellas, Karyopharm, Seattle Genetics, and Incyte. D.A.P. receives research funding from Pfizer and Agios and served on advisory boards for Pfizer, Celyad, Agios, Celgene, AbbVie, Argenx, Takeda, and Servier. B.J.D. serves on the advisory boards for Aileron Therapeutics, Aptose, Blueprint Medicines, Cepheid, EnLiven Therapeutics, Gilead, GRAIL, Iterion Therapeutics, Nemucore Medical Innovations, the Novartis CML Molecular Monitoring Steering Committee, Recludix Pharma, the RUNX1 Research Program, ALLCRON Pharma, VB Therapeutics, Vincerx Pharma, and the Board of Directors for Amgen, and receives research funding from EnLiven and Recludix. B.J.D. is principal investigator or co-investigator on Novartis, BMS, and Pfizer clinical trials. His institution, OHSU, has contracts with these companies to pay for patient costs, nurse and data manager salaries, and institutional overhead, but he does not derive salary, nor does his laboratory receive funds, from these contracts. J.W.T. has received research support from Acerta, Agios, Aptose, Array, AstraZeneca, Constellation, Genentech, Gilead, Incyte, Janssen, Kronos, Meryx, Petra, Schrodinger, Seattle Genetics, Syros, Takeda, and Tolero and serves on the advisory board for Recludix Pharma. The authors certify that all compounds tested in this study were chosen without input from any of our industry partners. A subset of findings from this manuscript have been included in a pending patent application.

Figures

Figure 1.
Figure 1.. Genomic features and outcomes for the Beat AML cohorts are concordant.
(A) The percentage of patients with a somatic mutation or gene fusion is shown for Waves 1+2 and Waves 3+4 cohorts and percentage difference is shown (average difference is 1.037%). (B) Overall survival is shown for Waves 1+2 and Waves 3+4 cohorts (p-value 0.2 log-rank test). (C). Ex vivo drug response values are shown comparing the average AUC for each drug (points) within de novo AML patients comparing Waves 1+2 to Waves 3+4 (Pearson’s correlation r=0.965). (D) Waves 3+4 can serve as validation cohort to assess prior mutation-inhibitor associations (Tyner et al., 2018). The difference in average response of specimens that are mutated versus wild type for a given gene (effect size) are plotted for Waves 1+2 on the x-axis and Waves 3+4 on the y-axis. Effect sizes were expressed as Glass’s delta with respect to the wild type group. Significance was based on the Welch’s t-test comparing mutated vs wild type and requiring a minimum of five mutations in Waves 1+2 and three mutations in Waves 3+4. Adjusted significance in Waves 1+2, Waves 3+4, or both are also annotated (qvalue < 0.05; (Storey and Tibshirani, 2003)).
Figure 2.
Figure 2.. Differentiation scoring to characterize expression and mutational patterns.
We generated malignant cell-type gene expression scores for each of our patients relative to 6 sets of 30 genes derived from expression signatures from single-cell sequencing (Van Galen et al., 2019). (A) By examining the correlation of expression module eigengenes and the cell-type scores we can see that WGCNA expression modules (X-axis) show correlation with differentiation cell-type scores (y-axis). Pearson’s correlation r-values are annotated. (B) Similarly, we can determine the mutational events significantly associated with each of the cell-type scores. Shown are the signed –log10(Welch’s t-test p-values) for the differences in cell-type score with respect to mutational status. Up to the top 5 most significant (qvalue < 0.05; (Storey and Tibshirani, 2003)) mutational events associated with enrichment of each cell-type score are highlighted. Full data are available in Table S2.
Figure 3.
Figure 3.. Influence of cell-type on inhibitor response.
(A) We compared the cell-type gene expression scores, developed in Figure 2, with ex vivo drug response. Pearson’s correlation of ex vivo inhibitor response (measured by AUC) with each of the six cell-type scores reveals relationship between differentiation and resistance (blue) or sensitivity (red). Note, all drugs displayed in the heatmap showed a significant correlation with at least one cell-type (BY FDR < 0.05; (Benjamini and Yekutieli, 2001)). Panobinostat and Venetoclax are shown correlated with Monocyte-like score in Figure S3A. Asterisks indicate those inhibitors in which there is an interaction between mutation and cell-type, shown below in panel B (single asterisk, qvalue < 0.1; double asterisk, qvalue < 0.05; (Storey and Tibshirani, 2003)). Full data are available in Table S3. (B) We examined whether correlations between drug response and cell-type score changed due to mutational status. Drug response modification was quantified by examining the significance (Y-axis) of the interaction between each mutational event and cell-type (x-axis) for each inhibitor, requiring a minimum of 10 mutations. Interactions with qvalue at two thresholds (q < 0.1; q < 0.05) are called out by text and shape and distinguished by a dashed and solid line, respectively. As an example, the conditional relationships between sorafenib, FLT3-ITD, and cell-type scores are shown in Figure S3B, where sorafenib activity is robust in FLT3-ITD cases with a high progenitor-like score, but activity is lost in FLT3-ITD cases with a high monocyte-like score.
Figure 4.
Figure 4.. Genomic associations of drug family response.
As in Figure 3A, we define sensitivity by red and resistant with blue and with white indicating intermediate. (A) Drug target information, where available, was annotated for all drugs on the panel, and these targets were mapped onto pathways to create drug families that share common targets and pathways. Full mapping of drug families is available in Table S4. Family-level drug response summaries allow us to identify cohort-level responses. Some like the Aurora Kinase family (Aurk) show overall resistance and others like Type XIII RTKs (Eph) or PIKK are overall sensitive. (B). We examined correlations between mutational status and drug family response. Mutational status associates with drug family response either in terms of significant (qvalue < 0.05; (Storey and Tibshirani, 2003)) sensitivity (red) or resistance (blue). Association tests were performed using Welch’s T-test comparing mutated vs wild type and requiring at least 5 mutations for a given mutational event. Effect size was based off of Glass’s delta using wild type as the reference. Full data are available in Table S5.
Figure 5.
Figure 5.. Drug family response is influenced by and conditional on cell-type.
(A) Similar to the analysis of single-inhibitor responses and their correlation with cell-type score, shown in Figure 3A, we can group the drug families from Figure 4 by their association with cell-type differentiation scores based on their Pearson’s correlation (BY FDR < 0.05; (Benjamini and Yekutieli, 2001)). (B) We can also determine instances where drug family correlation with mutational state is conditional on cell-type (as we did for individual drugs in Figure 3B). The mutations that play a significant drug response modification role based on the statistical interaction between cell-type score and mutation, requiring at least 10 mutations per event is shown. The Y-axis indicates the signed -log10 (Pvalue), the X-axis indicates cell-type. The interactions are listed by text (qvalue < 0.1 and qvalue < 0.05; (Storey and Tibshirani, 2003)) and distinguished by a dashed and solid line respectively. Full data are available in Table S6.
Figure 6.
Figure 6.. Comprehensive analysis of clinical variables identifies PEAR1 expression as a prognostic factor in AML.
(A) We analyzed univariate associations between the 6 cell-type scores and the set of 9 non-redundant WGCNA eigengenes with categorical and continuous clinical variables as well as overall survival across and within age subsets. Each variable type was grouped on the Y-axis and the displayed association values were derived from the corresponding test statistics. These include the Z statistic for categorical (logistic regression) and survival outcomes (Cox Proportional Hazards) and T-statistic for the continuous outcomes (general linear model). Average linkage hierarchical clustering was applied to rows (within groups) and columns (B; top) To understand which gene(s) among the module 3 WGCNA signature are the strongest drivers of the overall signature, we calculated the correlation of each gene with the module eigengene (kME). Of all the 203 genes in module 3, PEAR1 has the highest correlation. (B; bottom) The patient expression values (dots) of PEAR1 (x-axis) correlated highly with the Mod3 module eigengene (y-axis) and both are also correlated with the ‘HSC-like’ malignant cell-type as indicated by the cell-type purple(low)-yellow(high) gradient as defined in Figure S2A. Full module gene components are available in Table S7. (C) A strategy based on a forest of conditional inference trees (cforest) was used to determine variables that differentiate overall survival. Age groups, expression modules (denoted with Mod*), gene mutation, AML gene fusions, and cell-type scores from in the harmonized dataset were all included in the model. The age groups are young (<45), middle (45–60), older (60–75), oldest (>75). Depiction of the resulting tree where oval splits indicate variables that most significantly split overall survival. Lines indicate values that were split on, for instance, “TRUE” for the ‘young’ variable, which indicates that the subgroup is <45 years old. The resulting subgroups of patients, rectangles that denote ‘terminal nodes’, are listed with the subgroup size (denoted as n) and are colored to match corresponding survival curves.
Figure 7.
Figure 7.. Integrative modeling shows PEAR1 expression is a single, independent predictor of poor prognosis.
(A) PEAR1 expression (y-axis) is significantly higher in Adverse compared to Favorable ELN 2017 risk categorization (x-axis) for patients 60 and over (dots; older + oldest group), but the pattern is less pronounced in patients < 60. Significance determined using a using a Welch’s T-test. (B) PEAR1 expression differentiates survival for young patients equivalently to the LSC17 signature. Categorization of samples into high and low expression groups for PEAR1 and LSC17 was determined using the ctree methodology to facilitate comparison with PEAR1. (C) We compared performance of PEAR1 and LSC17 using both ctree and the median expression values for each. Shown are the hazard ratios (HRs) and 95% confidence intervals (CIs) for PEAR1 and LSC17 in the entire cohort or in the younger patients as well as in all sample types or only in bone marrow samples. The categories were high vs low expression as determined by either median threshold or significant splits using ctree (i.e., split type). In two instances, the ctree method failed to identify a split, and these are denoted with “N/A”.

Comment in

Similar articles

Cited by

References

    1. Arber DA, Orazi A, Hasserjian R, Thiele J, Borowitz MJ, Le Beau MM, Bloomfield CD, Cazzola M, and Vardiman JW (2016). The 2016 revision to the World Health Organization classification of myeloid neoplasms and acute leukemia. Blood 127, 2391–2405. - PubMed
    1. Armstrong JF, Faccenda E, Harding SD, Pawson AJ, Southan C, Sharman JL, Campo B, Cavanagh DR, Alexander SPH, Davenport AP, et al. (2020). The IUPHAR/BPS Guide to PHARMACOLOGY in 2020: extending immunopharmacology content and introducing the IUPHAR/MMV Guide to MALARIA PHARMACOLOGY. Nucleic Acids Res 48, D1006–D1021. - PMC - PubMed
    1. Avila Cobos F, Vandesompele J, Mestdagh P, and De Preter K (2018). Computational deconvolution of transcriptomics data from mixed cell populations. Bioinformatics 34, 1969–1979. - PubMed
    1. Barbie DA, Tamayo P, Boehm JS, Kim SY, Moody SE, Dunn IF, Schinzel AC, Sandy P, Meylan E, Scholl C, et al. (2009). Systematic RNA interference reveals that oncogenic KRAS-driven cancers require TBK1. Nature 462, 108–112. - PMC - PubMed
    1. Benjamini Y, and Yekutieli D (2001). The Control of the False Discovery Rate in Multiple Testing Under Dependency. The Annals of Statistics 29, 1165–1188.

Publication types

Substances