. 2022 Aug 8;40(8):818-834.e9.
doi: 10.1016/j.ccell.2022.06.011. Epub 2022 Jul 21.

Oncogenic collagen I homotrimers from cancer cells bind to α3β1 integrin and impact tumor microbiome and immunity to promote pancreatic cancer

Affiliations

Oncogenic collagen I homotrimers from cancer cells bind to α3β1 integrin and impact tumor microbiome and immunity to promote pancreatic cancer

Yang Chen et al. Cancer Cell. .

Abstract

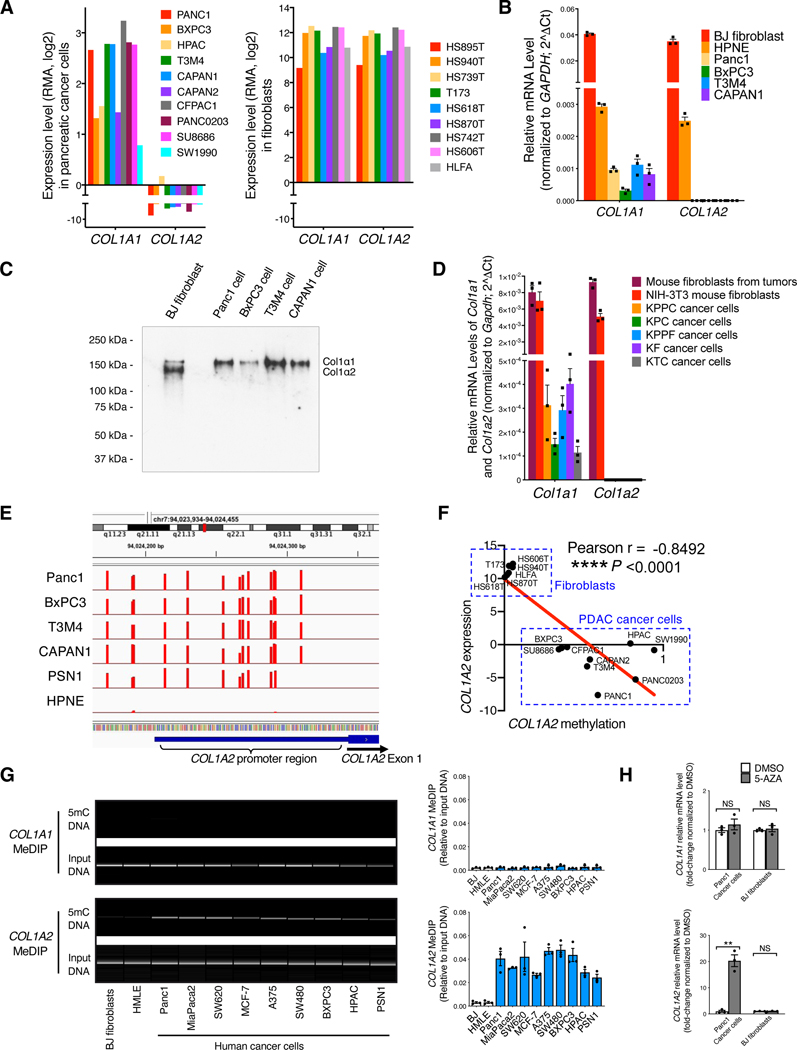
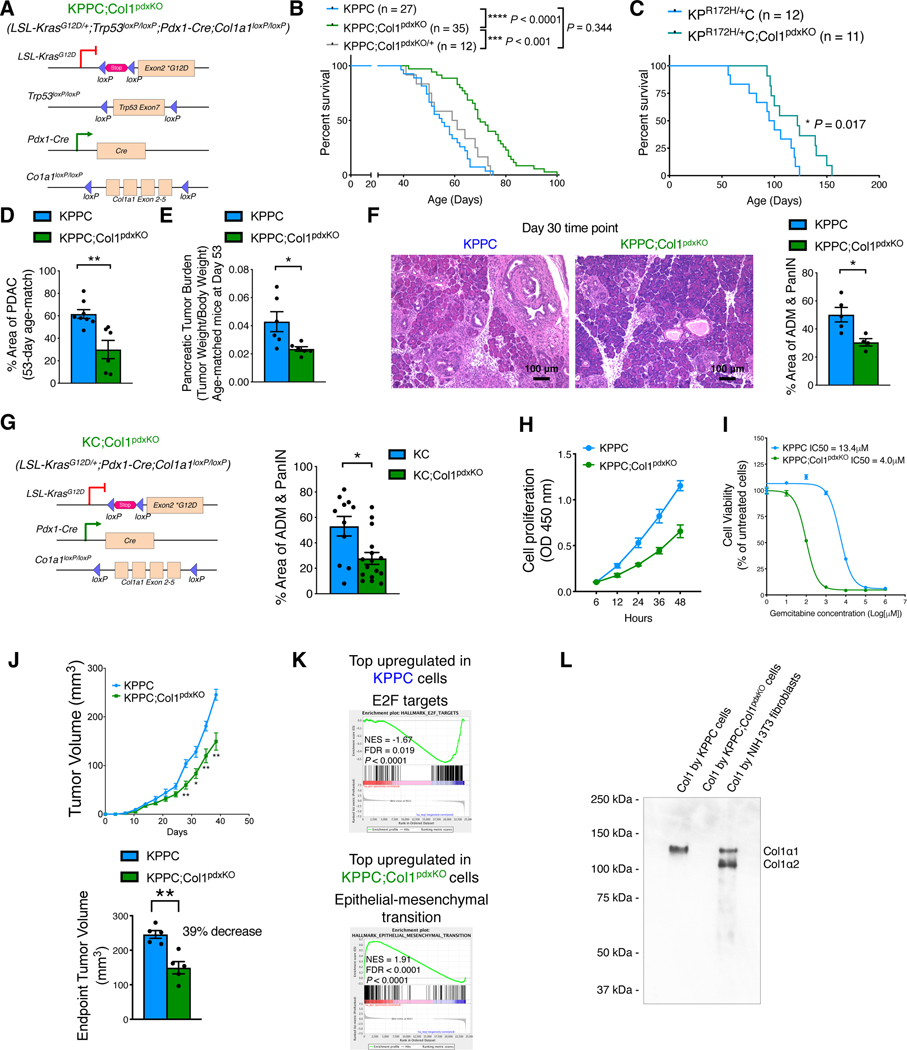
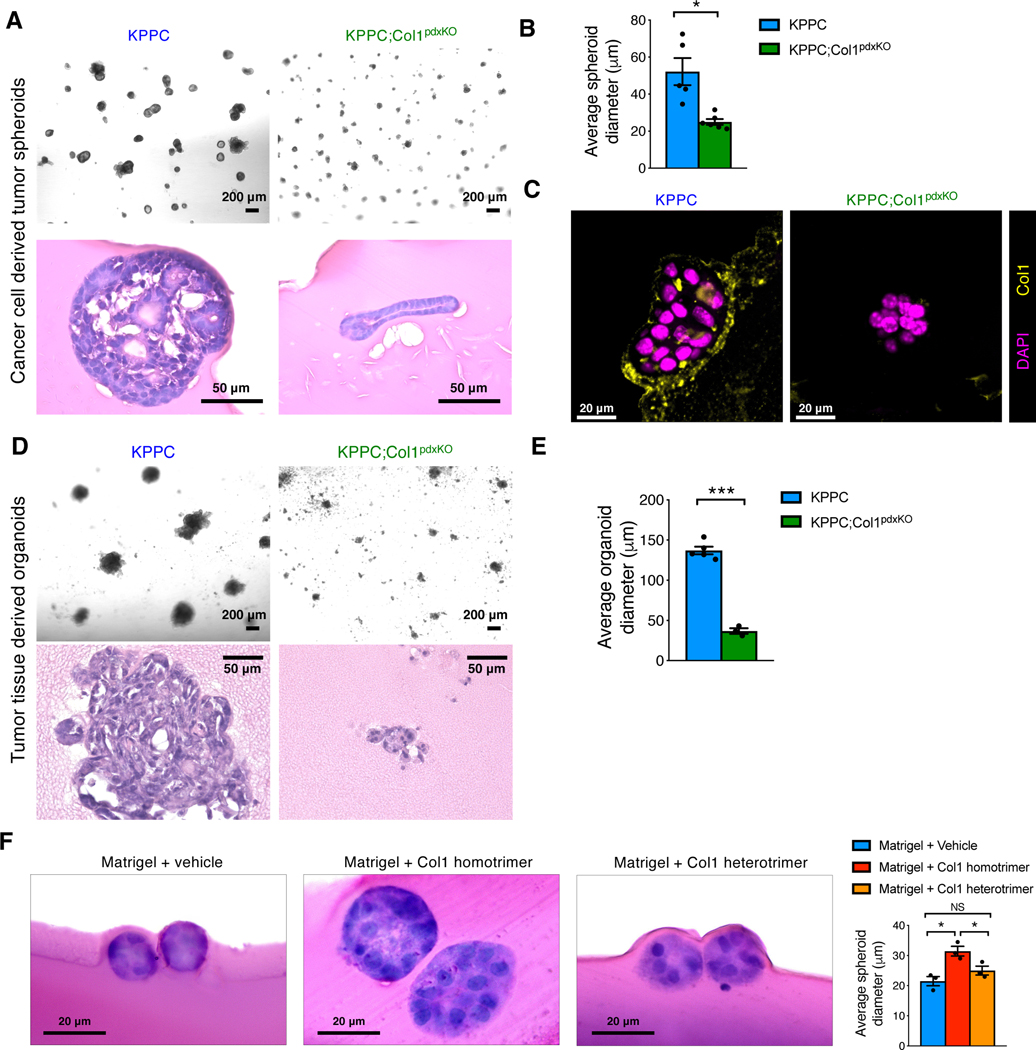
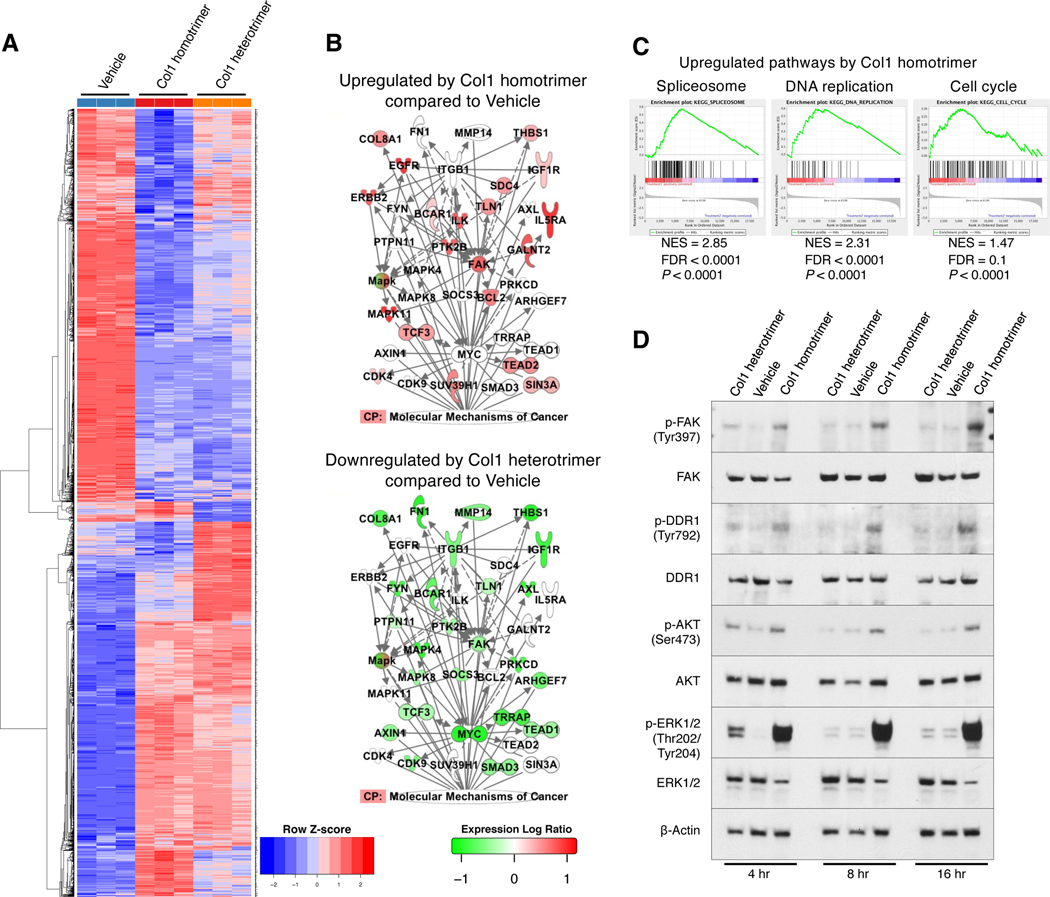
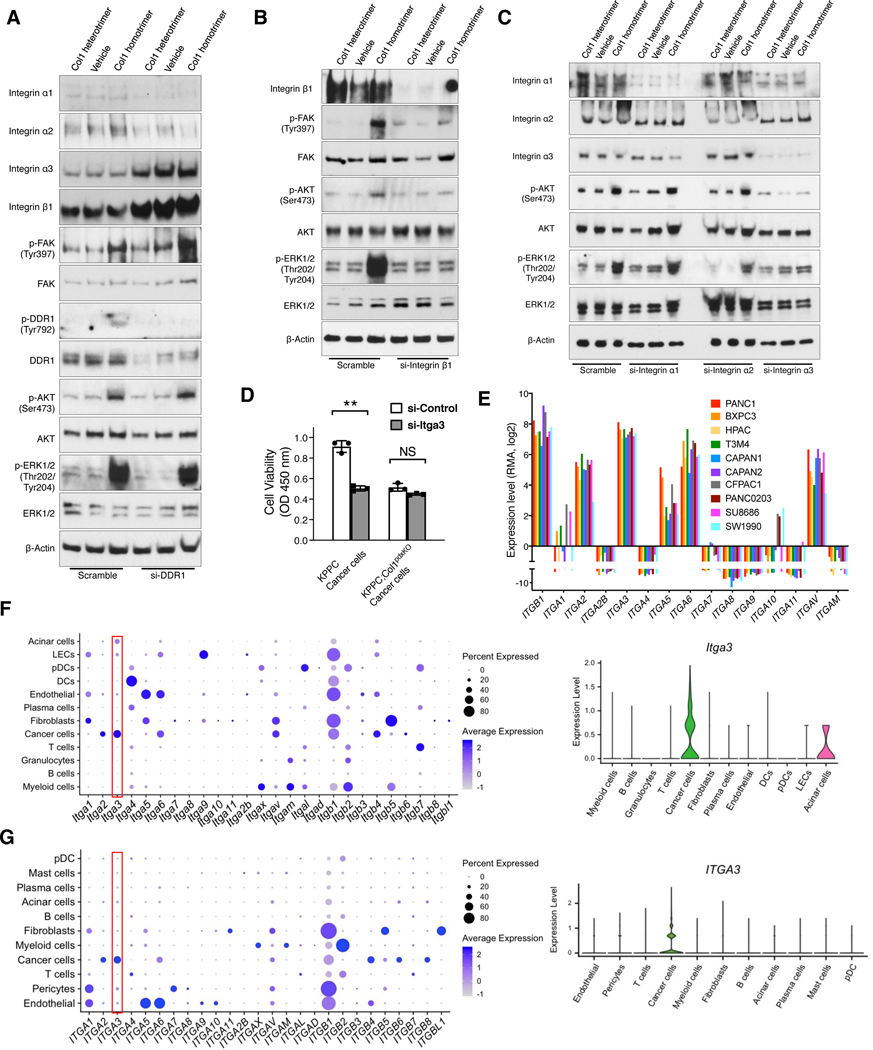
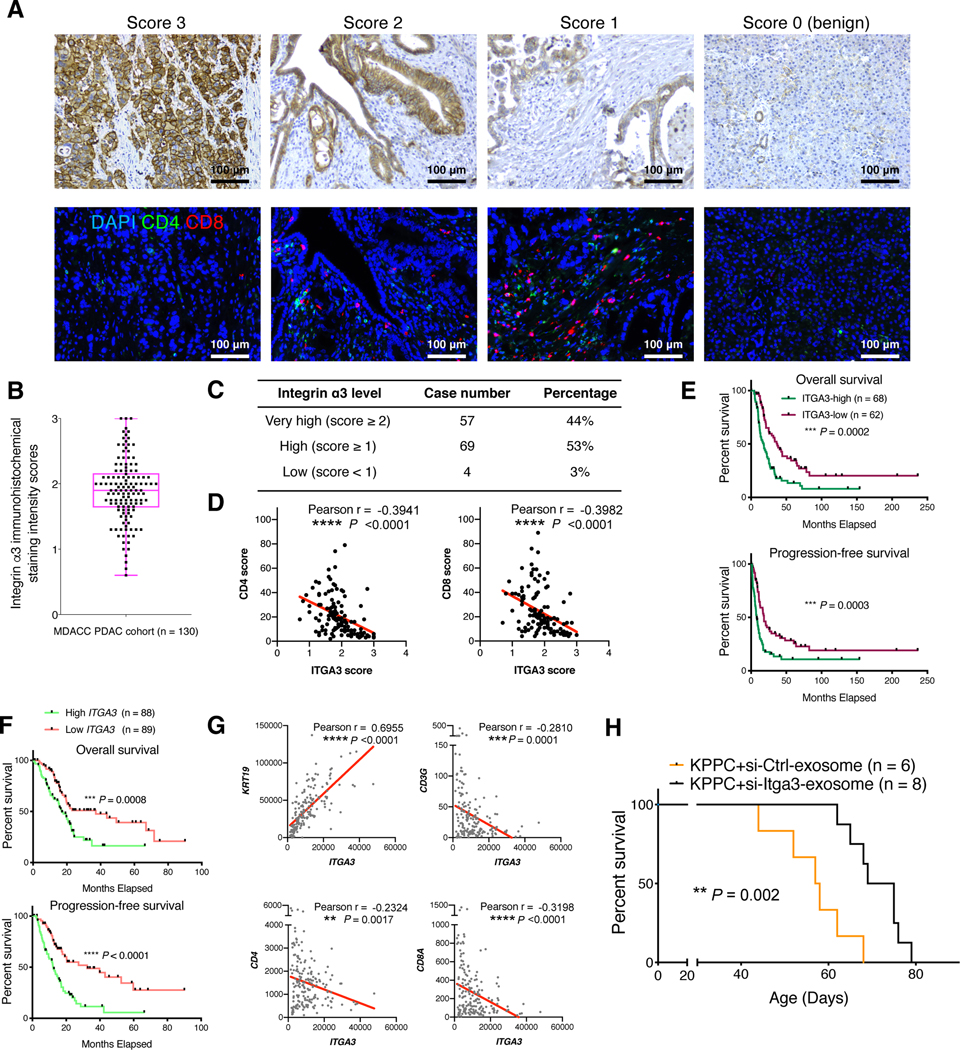
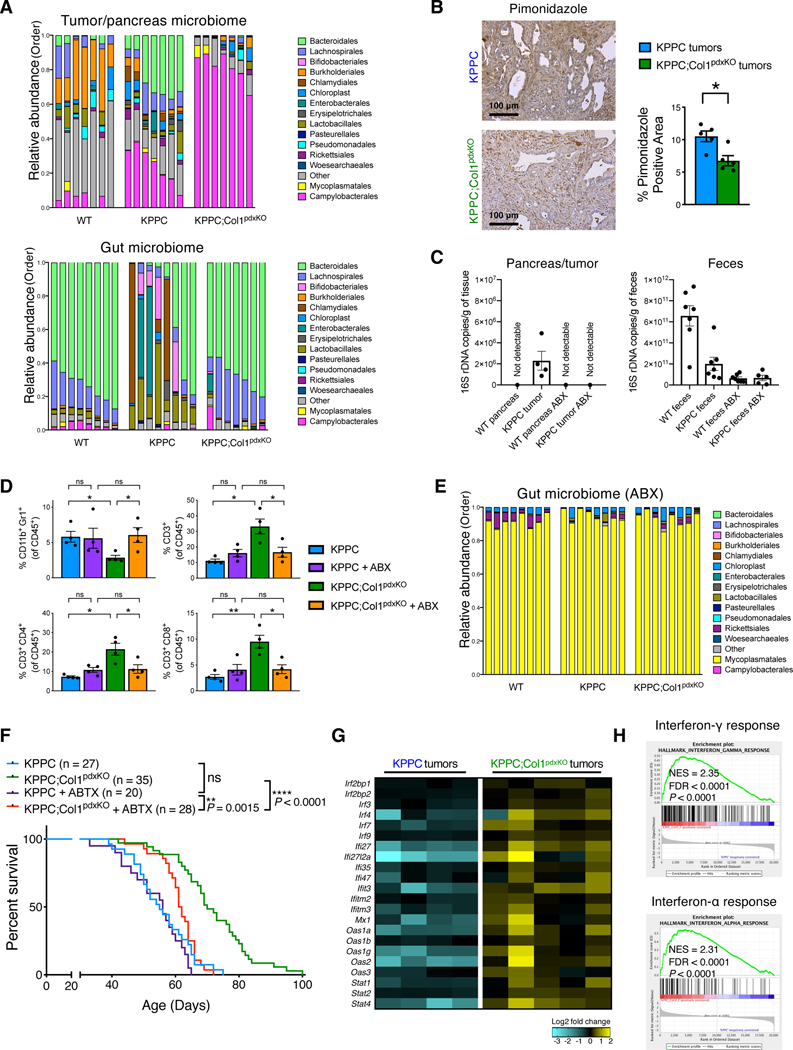
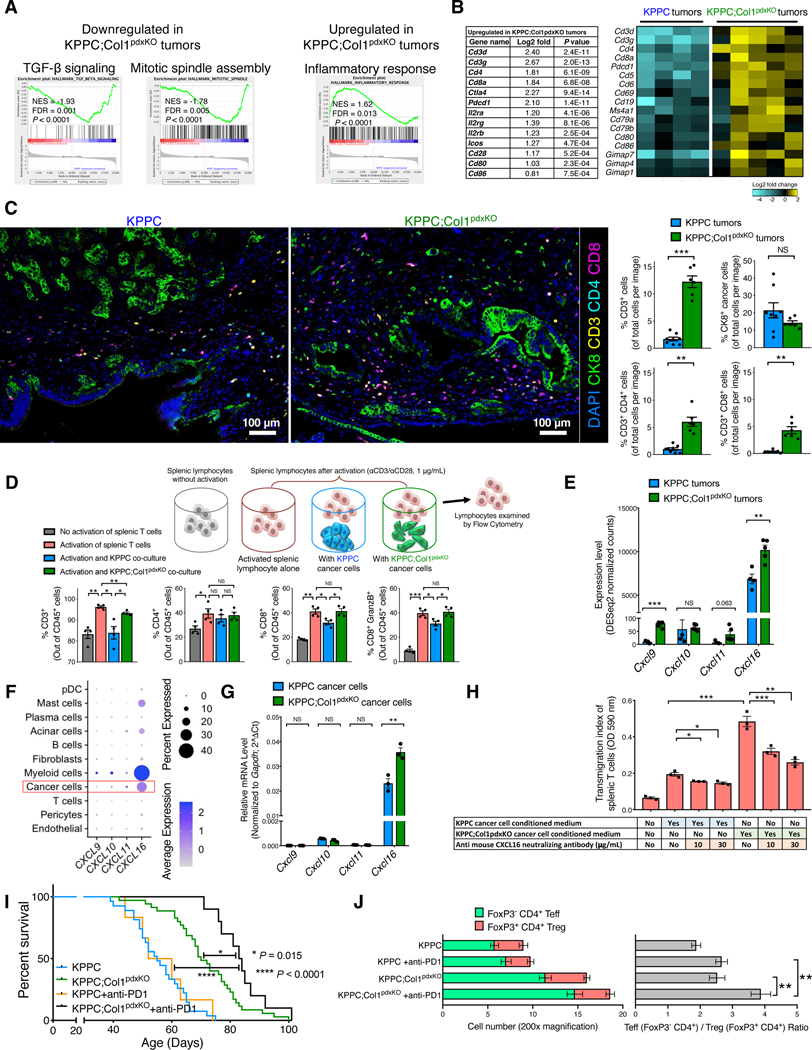
In contrast to normal type I collagen (Col1) heterotrimer (α1/α2/α1) produced by fibroblasts, pancreatic cancer cells specifically produce unique Col1 homotrimer (α1/α1/α1). Col1 homotrimer results from epigenetic suppression of the Col1a2 gene and promotes oncogenic signaling, cancer cell proliferation, tumor organoid formation, and growth via α3β1 integrin on cancer cells, associated with tumor microbiome enriched in anaerobic Bacteroidales in hypoxic and immunosuppressive tumors. Deletion of Col1 homotrimers increases overall survival of mice with pancreatic ductal adenocarcinoma (PDAC), associated with reprograming of the tumor microbiome with increased microaerophilic Campylobacterales, which can be reversed with broad-spectrum antibiotics. Deletion of Col1 homotrimers enhances T cell infiltration and enables efficacy of anti-PD-1 immunotherapy. This study identifies the functional impact of Col1 homotrimers on tumor microbiome and tumor immunity, implicating Col1 homotrimer-α3β1 integrin signaling axis as a cancer-specific therapeutic target.

Keywords: immunotherapy; pancreatic cancer; tumor immunology; tumor microbiome; tumor microenvironment; type I collagen.


Conflict of interest statement

Declaration of interests The authors declare no competing interests.

Figures

Figure 1.
Figure 1.. Pancreatic cancer cells express only COL1A1 (forming α1/α1/α1 homotrimer) but not COL1A2 due to COL1A2 promoter hypermethylation
(A) The expression levels of type I collagen (Col1) genes: COL1A1 (encoding Col1 α1 chain) and COL1A2 (encoding Col1 α2 chain) in human pancreatic cancer cell and fibroblast lines based on RNA-seq data from the CCLE database. RMA (Robust Multi-array Average algorithm) normalization was used and data were presented as the log2 gene expression. (B) The expression levels of COL1A1 and COL1A2 in human cell lines by qRT-PCR. Human BJ fibroblast, normal human pancreatic epithelial cell line (HPNE), and pancreatic cancer cell lines were examined (n = 3). (C) Detection of purified Col1 (human Col1α1 and/or Col1α2 chains) from conditioned culture media of human cell lines by Western blot. Representative Western blot of three independently experiments was shown. (D) The expression levels of Col1a1 and Col1a2 in primary pancreatic cancer cell lines from indicated mouse models, as compared to mouse fibroblasts (n = 3). (E) Genome-wide DNA methylation analysis of human pancreatic cancer cell lines and HPNE cell line (n = 3). DNA methylation at COL1A2 gene promoter regions was shown. Methylation percentages of the individual CpGs examined are depicted as bars (with Y axis ranging from 0 to 100) at their genome. (F) The reverse correlation between COL1A2 expression level and COL1A2 methylation fraction in human pancreatic cancer cells and fibroblasts based on the RNA-seq and DNA methylation data from the CCLE database. Pearson’s correlation test was used. (G) Methylated DNA immunoprecipitation (MeDIP) assay of COL1A1 and COL1A2 genes in various human cancer cell lines, as compared with BJ fibroblasts (n = 3). (H) The expression of COL1A1 and COL1A2 in human cancer cells and fibroblasts treated with 5-azacytidine (5-AZA; 10 μg/mL) for 14 days (n = 3). Data are represented as mean ± SEM. **p < 0.01, ****p < 0.0001; NS: not significant, Student’s t test was used unless otherwise indicated. All experiments were conducted in triplicate. See also Figure S1.
Figure 2.
Figure 2.. Deletion of Col1 as the α1/α1/α1 homotrimer format in pancreatic cancer cells delays PDAC progression
(A) Genetic strategy to delete Col1α1 (Col1a1) in pancreatic cancer cells using the KPPC;Col1pdxKO mice, as compared to background-matched KPPC mice. (B) Survival of KPPC (n = 27), KPPC;Col1pdxKO (n = 35), and KPPC;Col1pdxKO/+ (heterozygous Col1a1 deletion, n = 12) mice. Log-rank (Mantel-Cox) test was used. (C) Survival of KPC;Col1pdxKO (n = 11) mice, as compared to background-matched KPC (n = 12) mice. Log-rank (Mantel-Cox) test was used. (D) Histology evaluation of tumors from KPPC (n = 8) and KPPC;Col1pdxKO (n = 6) mice at the same age of 53 days. (E) Pancreatic tumor burden (tumor weight/body weight) of KPPC (n = 6) and KPPC;Col1pdxKO (n = 6) mice at the same 53 days of age. (F) Percentage of ADM/PanIN lesion areas of KPPC (n = 5) and KPPC;Col1pdxKO (n = 4) mice at the same 30 days of age. Scale bar: 100 μm. (G) Genetic strategy to delete Col1a1 in cancer cell lineage in the context of pancreatic cancer using the KC;Col1pdxKO mice, as compared to background-matched KC mice. Percentage of ADM/PanIN lesion areas was quantified based on H&E sections from KC (n = 11) and KC;Col1pdxKO (n = 16) mice. (H) Cell proliferation of KPPC and KPPC;Col1pdxKO cell lines over time (n = 3 biological replicates). (I) Cell viability of KPPC and KPPC;Col1pdxKO cell lines (% normalized to untreated group of each cell line) treated with gemcitabine (n = 3). (J) Xenograft tumor formation of KPPC and KPPC;Col1pdxKO cancer cell lines subcutaneously in nude mice (n = 5/group). (K) Gene set enrichment analysis (GSEA) of RNA-seq data on KPPC and KPPC;Col1pdxKO cancer cells. Top upregulated pathways were shown. NOM. p. val: nominal P value. NES, normalized enrichment score. FDR, false discovery rate (q value). (L) Detection of purified Col1 (mouse Col1α1 and/or Col1α2 chains) from conditioned culture media of mouse cancer cells or fibroblasts. Representative Western blot of three independently experiments was shown. Data are represented as mean ± SEM. *p < 0.05, **p < 0.01, ***p < 0.001, ****p < 0.0001, Student’s t test was used unless otherwise indicated. See also Figures S1–S3; Table S1.
Figure 3.
Figure 3.. Deletion of oncogenic Col1 homotrimers impedes the proliferation and tumorigenesis of pancreatic cancer cells
(A-C) 3D tumor spheroids established from KPPC and KPPC;Col1pdxKO cancer cell lines (n ≥ 5 biological replicates). Tumor spheroids were subjected to H&E (A and B) and Col1 staining (C). Average diameter of spheroids was quantified in (B). Scale bar for tumor spheroids: 200 μm. Scale bar for H&E staining: 50 μm. Scale bar for immunofluorescence staining: 20 μm. (D and E) Organoids were established from fresh tumor mixtures of KPPC (n = 5) and KPPC;Col1pdxKO (n = 3) mice (D), and quantified for average diameter (E). Scale bar: 200 μm in 3D culture images; 50 μm in H&E images. (F) Tumor spheroids established from KPPC;Col1pdxKO cells grown in 3D Matrigel culture system supplemented with Col1 homotrimers or Col1 heterotrimers (n = 3/group). Tumor spheroids were subjected to H&E staining. Scale bar for H&E staining: 20 μm. Data are represented as mean ± SEM. *p < 0.05, ***p < 0.001; NS: not significant, Student’s t test was used. See also Figure S3.
Figure 4.
Figure 4.. Oncogenic Col1 homotrimers produced by pancreatic cancer cells induce persistent proliferation signals
(A-C) RNA sequencing (RNA-seq) analysis on KPPC;Col1pdxKO cancer cells cultured on pre-coated vehicle, Col1 homotrimer, or Col1 heterotrimer (n = 3/group). Heatmap of differentially expressed genes was shown in (A). IPA was performed to visualize the most differentially regulated signaling network (B). CP: canonical pathway. GSEA revealed upregulated pathways by Col1 homotrimers as compared to Col1 heterotrimer (C). (D) KPPC;Col1pdxKO cancer cells were treated with Col1 homotrimers or heterotrimers for 4–16 hours and examined for intracellular signaling by Western blotting. Representative Western blot of three independently experiments was shown. See also Figures S3 and S4; Table S2.
Figure 5.
Figure 5.. Col1 homotrimer-induced signals involve integrin α3(β1) that is specifically expressed by pancreatic cancer cells.
(A-C) KPPC;Col1pdxKO cancer cells were transfected with siRNAs of DDR1 (A), integrin β1 (B), integrin α1, integrin α2, or integrin α3 (C). Cells were treated with Col1 homotrimers or heterotrimers for 16 hours. Cells were examined by Western blotting. Representative Western blot of three independently experiments was shown. (D) KPPC and KPPC;Col1pdxKO cancer cells were transfected with siRNA of integrin α3. Cells were then cultured for 48 hours and examined by cell viability assay (n = 3). Data are represented as mean ± SEM. **p < 0.01; NS: not significant, Student’s t test was used. (E) Expression levels of selected integrin subunits in human PDAC cell lines based on RNA-seq data from the CCLE database. RMA normalization was used and data were presented as the log2 gene expression. (F and G) Expression profile of Itga3 (F) and ITGA3 (G) among various cell clusters from the single-cell RNA-sequencing datasets of mouse (GEO: GSE166298) and human (GSA: CRA001160) pancreatic tumors, as shown in dot plot and violin plot. See also Figure S4.
Figure 6.
Figure 6.. Integrin α3 correlates with poor prognosis and T cell suppression in pancreatic cancer patients.
(A-E) Representative images showing the immunohistochemical (IHC) scores of integrin α3 (A) on a scale of 0–3 in human PDAC tissue microarray sections. CD4 and CD8 staining was also conducted on the serial sections of the same samples (A). The average score of integrin α3 expression was 1.86 for the entire cohort (B). The top and bottom lines of the boxplot represent the interquartile range (IQR); center line represents median; and the whiskers represent minimum and maximum values. Case number and percentage of PDAC samples with indicated integrin α3 expression scores was counted (C). Scatterplot illustrating the reverse correlation between integrin α3 IHC score and CD4/CD8 score was shown in (D). Pearson’s correlation test was used. Kaplan-Meier survival curves showed the correlation between integrin α3 expression level and survival (E). Log-rank (Mantel-Cox) test was used. Scale bar: 100 μm. (F and G) Survival (F) of pancreatic adenocarcinoma patients from TCGA dataset correlated with ITGA3 expression level. Log-rank (Mantel-Cox) test was used. Patients with available survival data and RNA-seq data (n = 177) were stratified into two groups based on the median ITGA3 expression level. Scatterplot illustrating the correlation between the gene expression levels of ITGA3 and KRT19 (or T cell related genes) in PDAC patients was shown in (G). Pearson’s correlation test was used. (H) Survival of KPPC mice treated with mesenchymal stem cell-derived exosomes electroporated with either scrambled siRNA-control or siRNA-Itga3. Log-rank (Mantel-Cox) test was used. **p < 0.01, ***p < 0.001, ****p < 0.0001; NS: not significant. See also Figure S5.
Figure 7.
Figure 7.. Col1 homotrimer deletion in cancer cells confers beneficial tumor microbiome and immune landscape.
(A) Bacterial 16S rRNA gene sequencing analysis of intratumoral microbiome and gut (fecal) microbiome from co-housed KPPC mice and KPPC;Col1pdxKO mice with stage-matched end-point tumors (n = 7–8/group). Pancreatic microbiome and gut microbiome from co-housed wild-type (tumor-free) littermate control mice were also shown. Sequences were classified by taxonomy at the Order level. (B) Representative images of hypoxyprobe/pimonidazole staining and positivity quantification of KPPC and KPPC;Col1pdxKO tumors (n = 5/group). Scale bar: 100 μm. (C) The evaluation of total bacterial DNA content by 16S rRNA gene qRT-PCR. Pancreatic tissue (as pancreatic tumor or normal pancreas) samples (n = 4/group) and fecal samples (n = 5–7/group) were collected from KPPC mice and healthy (tumor-free) littermate mice, treated with either broad-spectrum antibiotics (ABX) or vehicle. (D) Immune profiling (flow cytometry) assay of CD11b+Gr1+ myeloid cells, CD3+ T cells, CD4+/CD3+ T cells, and CD8+/CD3+ T cells in the tumors from KPPC mice and KPPC;Col1pdxKO mice with or without ABX treatment (n = 4/group). (E) Bacterial 16S rRNA gene sequencing analysis of gut microbiome (fecal samples) from mice with ABX treatment (n = 8/group). Sequences were classified by taxonomy at the Order level. (F) The overall survival of KPPC mice (n = 20) and KPPC;Col1pdxKO mice (n = 28) with ABX treatment, compared with untreated KPPC and KPPC;Col1pdxKO mice (originally shown in Figure 2B). Log-rank (Mantel-Cox) test was used. (G and H) Significantly upregulated expression of interferon response pathway genes (G) in KPPC;Col1pdxKO tumors (n = 5) compared to KPPC tumors (n = 4), based on bulk RNA-seq data. GSEA revealing significantly upregulated interferon pathways was shown in (H). Data are represented as mean ± SEM. *p < 0.05, **p < 0.01, ****p < 0.0001; NS: not significant, Student’s t test was used unless otherwise indicated. See also Figures S5, S6, and S7; Table S3.
Figure 8.
Figure 8.. Deletion of Col1 homotrimers from cancer cells increases T cell accumulation and enables the efficacy of anti-PD-1 therapy.
(A and B) GSEA revealing differentially regulated pathways in KPPC;Col1pdxKO tumors (n = 5), as compared to KPPC tumors (n = 4) (A), based on bulk RNA-seq data (partly shown in Figures 7G and 7H). Upregulated T cell signature genes in KPPC;Col1pdxKO tumors were listed with log2-fold change and P value (Wald Test) in (B). Heatmap of representative genes encoding immune regulatory molecules was also shown. (C) T cell quantification from multispectral imaging of multiplex stained sections of stage-matched endpoint KPPC tumors (n = 8) and KPPC;Col1pdxKO tumors (n = 6). Scale bar: 100 μm. (D) Splenic lymphocytes (n = 4 mice) were cultured in the presence or absence of: anti-CD3/anti-CD28 activation, KPPC cancer cell co-culture, or KPPC;Col1pdxKO cancer cell co-culture. Lymphocytes were then examined by flow cytometry. (E) Expression profile of genes encoding chemokines related to T cell recruitment based on bulk RNA-seq of KPPC (n = 4) and KPPC;Col1pdxKO (n = 5) tumors. (F) Expression profile of indicated genes among various cell clusters from the single-cell RNA-sequencing dataset of human pancreatic tumors (GSA: CRA001160), as shown in dot plot. (G) Expression profile of indicated genes in KPPC and KPPC;Col1pdxKO cancer cells (n = 3) as examined by qRT-PCR. (H) Transwell migration assay of mouse splenic T cells (in upper chambers, treated with vehicle or CXCL16 neutralizing antibody) towards conditioned medium from KPPC or KPPC;Col1pdxKO cancer cells (n = 3). (I,J) Survival of KPPC;Col1pdxKO (n = 10) and KPPC mice (n = 6) treated with anti-PD-1 therapy (I), compared to untreated KPPC (n = 27) and KPPC;Col1pdxKO (n = 35) mice originally from Figure 2B. Log-rank (Mantel-Cox) test was used. Indicated cell number and ratio were examined by immunofluorescence (J). Data are represented as mean ± SEM. *p < 0.05, **p < 0.01, ***p < 0.001, ****p < 0.0001; NS: not significant, Student’s t test was used unless otherwise indicated. See also Figures S7 and S8; Table S3.

Comment in

References

    1. Barretina J, Caponigro G, Stransky N, Venkatesan K, Margolin AA, Kim S, Wilson CJ, Lehar J, Kryukov GV, Sonkin D, et al. (2012). The Cancer Cell Line Encyclopedia enables predictive modelling of anticancer drug sensitivity. Nature 483, 603–607. 10.1038/nature11003. - DOI - PMC - PubMed
    1. Bezzi M, Seitzer N, Ishikawa T, Reschke M, Chen M, Wang G, Mitchell C, Ng C, Katon J, Lunardi A, et al. (2018). Diverse genetic-driven immune landscapes dictate tumor progression through distinct mechanisms. Nature medicine 24, 165–175. 10.1038/nm.4463. - DOI - PubMed
    1. Bhattacharjee S, Hamberger F, Ravichandra A, Miller M, Nair A, Affo S, Filliol A, Chin L, Savage TM, Yin D, et al. (2021). Tumor restriction by type I collagen opposes tumor-promoting effects of cancer-associated fibroblasts. The Journal of clinical investigation 131. 10.1172/JCI146987. - DOI - PMC - PubMed
    1. Caporaso JG, Lauber CL, Walters WA, Berg-Lyons D, Huntley J, Fierer N, Owens SM, Betley J, Fraser L, Bauer M, et al. (2012). Ultra-high-throughput microbial community analysis on the Illumina HiSeq and MiSeq platforms. ISME J 6, 1621–1624. 10.1038/ismej.2012.8. - DOI - PMC - PubMed
    1. Carstens JL, Correa de Sampaio P, Yang D, Barua S, Wang H, Rao A, Allison JP, LeBleu VS, and Kalluri R. (2017). Spatial computation of intratumoral T cells correlates with survival of patients with pancreatic cancer. Nature communications 8, 15095. 10.1038/ncomms15095. - DOI - PMC - PubMed

Publication types