. 2023 Jan;228(1):68.e1-68.e12.
doi: 10.1016/j.ajog.2022.07.014. Epub 2022 Jul 19.

COVID-19 booster dose induces robust antibody response in pregnant, lactating, and nonpregnant women

Affiliations

COVID-19 booster dose induces robust antibody response in pregnant, lactating, and nonpregnant women

Caroline Atyeo et al. Am J Obstet Gynecol. 2023 Jan.

Abstract

Background: Although emerging data during the SARS-CoV-2 pandemic have demonstrated robust messenger RNA vaccine-induced immunogenicity across populations, including pregnant and lactating individuals, the rapid waning of vaccine-induced immunity and the emergence of variants of concern motivated the use of messenger RNA vaccine booster doses. Whether all populations, including pregnant and lactating individuals, will mount a comparable response to a booster dose is not known.

Objective: This study aimed to profile the humoral immune response to a COVID-19 messenger RNA booster dose in a cohort of pregnant, lactating, and nonpregnant age-matched women.

Study design: This study characterized the antibody response against ancestral Spike and Omicron in a cohort of 31 pregnant, 12 lactating, and 20 nonpregnant age-matched controls who received a BNT162b2 or messenger RNA-1273 booster dose after primary COVID-19 vaccination. In addition, this study examined the vaccine-induced antibody profiles of 15 maternal-to-cord dyads at delivery.

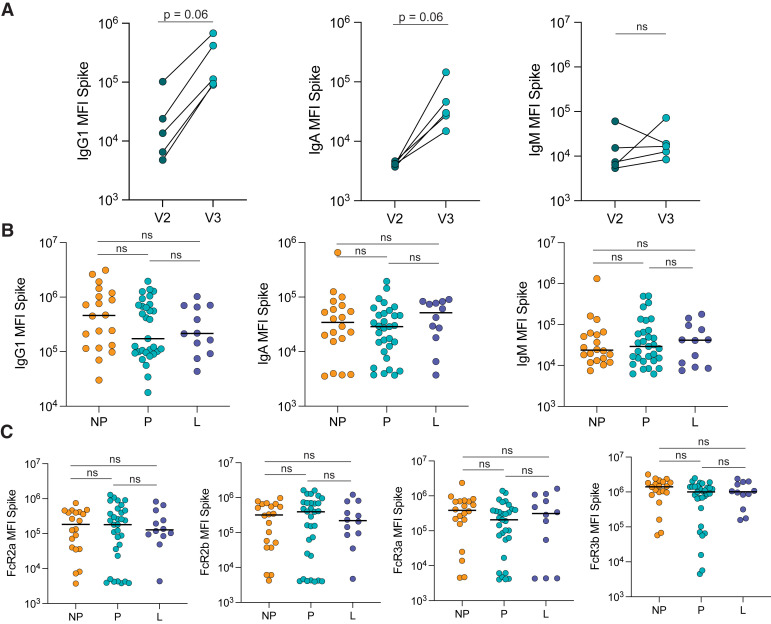
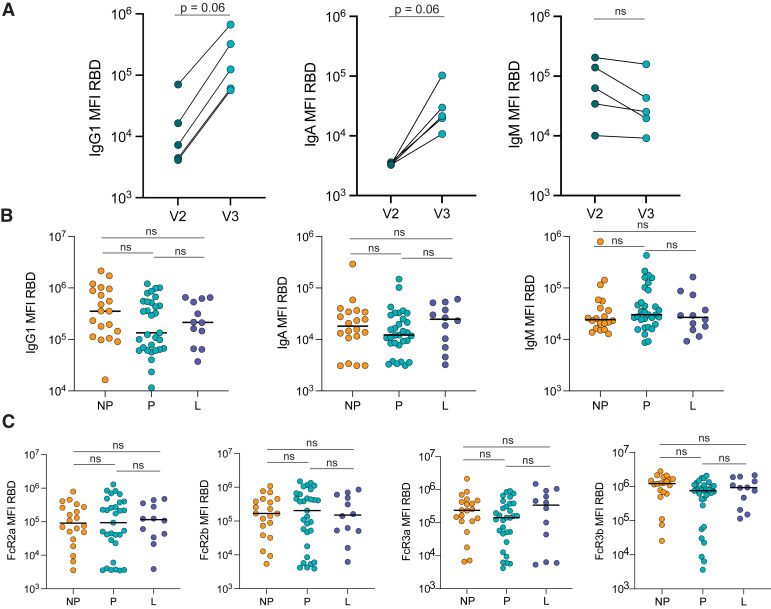
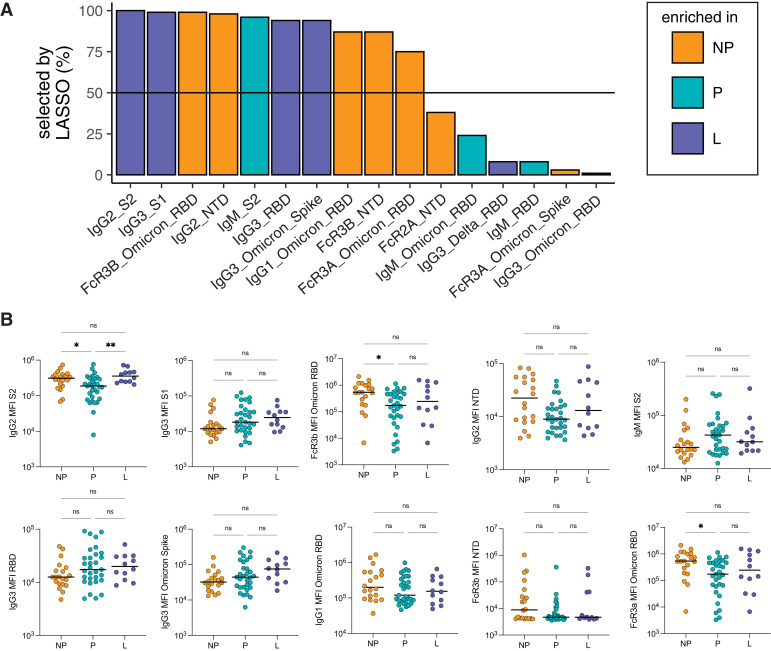
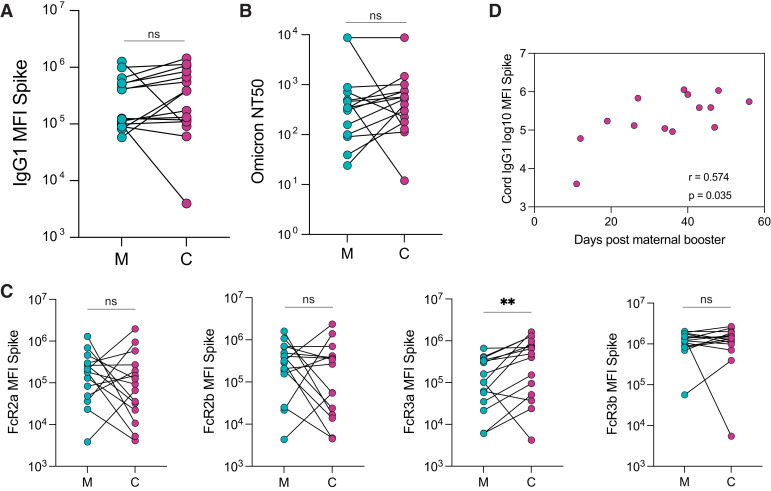
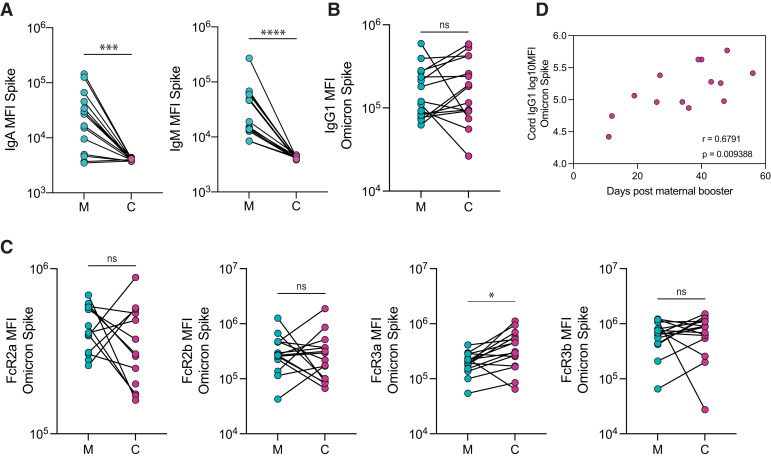
Results: Receiving a booster dose during pregnancy resulted in increased immunoglobulin G1 levels against Omicron Spike (postprimary vaccination vs postbooster dose; P=.03). Pregnant and lactating individuals exhibited equivalent Spike-specific total immunoglobulin G1, immunoglobulin M, and immunoglobulin A levels and neutralizing titers against Omicron compared with nonpregnant women. Subtle differences in Fc receptor binding and antibody subclass profiles were observed in the immune response to a booster dose in pregnant vs nonpregnant individuals. The analysis of maternal and cord antibody profiles at delivery demonstrated equivalent total Spike-specific immunoglobulin G1 in maternal and cord blood, yet higher Spike-specific FcγR3a-binding antibodies in the cord relative to maternal blood (P=.002), consistent with the preferential transfer of highly functional immunoglobulin. Spike-specific immunoglobulin G1 levels in the cord were positively correlated with the time elapsed since receiving the booster dose (Spearman R, .574; P=.035).

Conclusion: Study data suggested that receiving a booster dose during pregnancy induces a robust Spike-specific humoral immune response, including against Omicron. If boosting occurs in the third trimester of pregnancy, higher Spike-specific cord immunoglobulin G1 levels are achieved with greater time elapsed between receiving the booster and delivery. Receiving a booster dose has the potential to augment maternal and neonatal immunity.

Keywords: COVID-19; SARS-CoV-2; antibodies; booster; humoral immune response; immune response; immunity; messenger RNA vaccine; transplacental antibody transfer; vaccination.


Figures

Figure 1
Figure 1
Similar Spike-specific antibody responses after boosting in pregnant, lactating, and non-pregnant A, The dot plots show the peak IgG1, IgA, and IgM response against Spike in 5 pregnant individuals after receiving the second dose of a primary mRNA vaccine series (V2) and after the booster dose (V3). The lines connect samples from the same individual. Significance was determined by a Wilcoxon signed-rank test. The differences did not reach statistical significance (P=.06 or ns for P>.1 is indicated). B, The dot plots show IgG1, IgA, and IgM levels against Spike in NP, P, and L individuals. Horizontal line represents the median for each group. Significance was determined by a Kruskal-Wallis test. No comparison was significant (ns). C, The dot plots show the FcR-binding of antibodies against Spike in NP, P, and L individuals. Horizontal line represents the median for each group. Significance was determined by a Kruskal-Wallis test. No comparison was significant (ns). FcR, Fc receptor; IgA, immunoglobulin A; IgG1, immunoglobulin G1; IgM, immunoglobulin M; L, lactating; mRNA, messenger RNA; NP, nonpregnant; ns, not significant; P, pregnant. Atyeo. Antibody response to COVID-19 booster dose in pregnancy. Am J Obstet Gynecol 2023.
Figure 2
Figure 2
Similar RBD-specific antibody responses after boosting in pregnant, lactating, and non-pregnant A, The dot plots show the peak IgG1, IgA, and IgM response against RBD in 5 pregnant individuals after receiving the second dose of a primary mRNA vaccine series (V2) and after the booster dose (V3). The lines connect samples from the same individual. The significance was determined by a Wilcoxon signed-rank test. The differences did not reach statistical significance (P=.06 or ns for P>.1 is indicated). B, The dot plots show the IgG1, IgA, and IgM-titer against RBD in NP, P, and L individuals. The horizontal line represents the median for each group. Significance was determined by a Kruskal-Wallis test. No comparison was significant (ns). C, The dot plots show the FcR-binding of antibodies against RBD in NP, P, and L individuals. The horizontal line represents the median for each group. Significance was determined by a Kruskal-Wallis test. No comparison was significant (ns). FcR, Fc receptor; IgA, immunoglobulin A; IgG1, immunoglobulin G1; IgM, immunoglobulin M; L, lactating; mRNA, messenger RNA; NP, nonpregnant; ns, not significant; P, pregnant; RBD, receptor-binding domain. Atyeo. Antibody response to COVID-19 booster dose in pregnancy. Am J Obstet Gynecol 2023.
Figure 3
Figure 3
Similar Omicron-Spike specific antibody responses after boosting in pregnant, lactating, and non-pregnant A–B, The dot plots show the peak IgG1, IgA, and IgM response against Omicron Spike in 5 pregnant individuals after receiving the second dose of a primary mRNA vaccine series (V2) and after the booster dose (V3). The lines connect samples from the same individual. Significance was determined by a Wilcoxon signed-rank test, asterisk represents P<.05 (ns). B, The dot plots show IgG1, IgA, and IgM levels against Omicron Spike in NP, P, and L individuals. The horizontal line represents the median for each group. Significance was determined by a Kruskal-Wallis test. No comparison was significant (ns). C, The dot plots show the NT50 against an Omicron Spike pseudovirus in NP, P, and L individuals. The horizontal line represents the median for each group. Significance was determined by a Kruskal-Wallis test. No comparison was significant (ns). D, The dot plots show the FcR-binding of antibodies against Omicron Spike in NP, P, and L individuals. The horizontal line represents the median for each group. Significance was determined by a Kruskal-Wallis test. No comparison was significant. FcR, Fc receptor; IgA, immunoglobulin A; IgG1, immunoglobulin G1; IgM, immunoglobulin M; L, lactating; mRNA, messenger RNA; NP, nonpregnanct; ns, not significant; P, pregnant. Atyeo. Antibody response to COVID-19 booster dose in pregnancy. Am J Obstet Gynecol 2023.
Figure 4
Figure 4
Boosting induces differences in antibody profiles between pregnant and non-pregnant A, LASSO was used to select the antibody features that separated the 3 groups: NP, P, and L individuals. LASSO was performed 100 times, and the barplot shows the percentage that each feature was selected (for features selected at least once). The horizontal line represents the 50% cutoff used to define the top features. The color of the bar represents the group in which the feature is the most elevated. B, The dot plots show the univariate analysis of the LASSO-selected features (A). The horizontal line represents the median for each group. Significance was determined by a Kruskal-Wallis test. P values were corrected for multiple testing by the Benjamini-Hochberg method, single asterisk represents P<.05 and double asterisks represent P<.01. L, lactating; LASSO, least absolute shrinkage and selection operator; NP, nonpregnant; P, pregnant. Atyeo. Antibody response to COVID-19 booster dose in pregnancy. Am J Obstet Gynecol 2023.
Figure 5
Figure 5
The transfer of Spike-specific antibodies to the cord after third trimester vaccination A, The dot plots show the IgG1 against Spike in M and C blood. The lines connect matched maternal-to-cord dyads (n=15). Significance was determined by a Wilcoxon signed-rank test (ns). B, The dot plots show the NT50 against an Omicron Spike pseudovirus in M and C blood. The lines connect matched maternal-to-cord dyads (n=15). Significance was determined by a Wilcoxon signed-rank test (ns). C, The dot plots show the FcR-binding titer against Spike in M and C blood. The lines connect matched maternal-to-cord dyads (n=15). Significance was determined by a Wilcoxon signed-rank test followed by a Benjamini-Hochberg correction for multiple testing, double asterisks represent P<0.01 (ns). D, The scatter plot shows the correlation of cord IgG1 titer against Spike vs days from maternal booster to delivery. The r value reflects a Spearman correlation. Of note, 1 dyad was excluded because of missing information about time from booster to delivery. C, cord blood; FcR, Fc receptor; IgG1, immunoglobulin G1; M, maternal blood; ns, not significant. Atyeo. Antibody response to COVID-19 booster dose in pregnancy. Am J Obstet Gynecol 2023.
Figure 6
Figure 6
Omicron Spike-specific antibody transfer to the umbilical cord after third trimester boosting A, The dot plots show IgA and IgM against Spike in M and C blood. The lines connect matched maternal-to-cord dyads (n=15), triple asterisks denote P<.001 and four asterisks denote P<.0001 (ns). B–C, The dot plots show the IgG1 (B) and FcR-binding (C) titer against Omicron Spike in M and C blood. The lines connect matched maternal-to-cord dyads (n=15). Significance was determined by a Wilcoxon signed-rank test followed by a Benjamini-Hochberg correction for multiple testing, single asterisk denotes P<.05 (ns). D, The scatter plot shows the correlation of log-transformed cord IgG1 levels against Omicron Spike vs days from maternal booster to delivery. The r value reflects a Spearman correlation. C, cord blood; FcR, Fc receptor; IgA, immunoglobulin A; IgG1, immunoglobulin G1; IgM, immunoglobulin M; M, maternal blood; ns, not significant. Atyeo. Antibody response to COVID-19 booster dose in pregnancy. Am J Obstet Gynecol 2023.

References

    1. Zambrano L.D., Ellington S., Strid P., et al. Update: characteristics of symptomatic women of reproductive age with laboratory-confirmed SARS-CoV-2 infection by pregnancy status - United States, January 22-October 3, 2020. MMWR Morb Mortal Wkly Rep. 2020;69:1641–1647. - PMC - PubMed
    1. Woodworth K.R., Olsen E.O., Neelam V., et al. Birth and infant outcomes following laboratory-confirmed SARS-CoV-2 infection in pregnancy - SET-NET, 16 jurisdictions, March 29-October 14, 2020. MMWR Morb Mortal Wkly Rep. 2020;69:1635–1640. - PMC - PubMed
    1. Metz T.D., Clifton R.G., Hughes B.L., et al. Disease severity and perinatal outcomes of pregnant patients with coronavirus disease 2019 (COVID-19) Obstet Gynecol. 2021;137:571–580. - PMC - PubMed
    1. DeSisto C.L., Wallace B., Simeone R.M., et al. Risk for stillbirth among women with and without COVID-19 at delivery hospitalization - United States, March 2020-September 2021. MMWR Morb Mortal Wkly Rep. 2021;70:1640–1645. - PMC - PubMed
    1. Centers for Disease Control and Prevention . 2022. COVID-19 vaccines while pregnant or breastfeeding.https://www.cdc.gov/coronavirus/2019-ncov/vaccines/recommendations/pregn... Available at:

Publication types