. 2022 Jul 22;13(1):4226.
doi: 10.1038/s41467-022-31790-7.

Heparin induces α-synuclein to form new fibril polymorphs with attenuated neuropathology

Affiliations

Heparin induces α-synuclein to form new fibril polymorphs with attenuated neuropathology

Youqi Tao et al. Nat Commun. .

Abstract

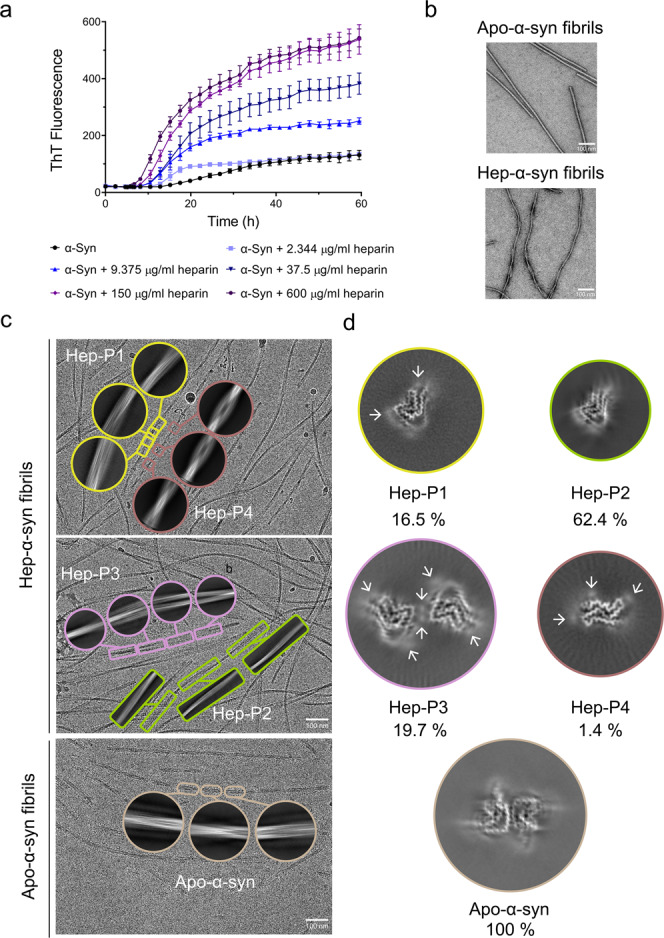
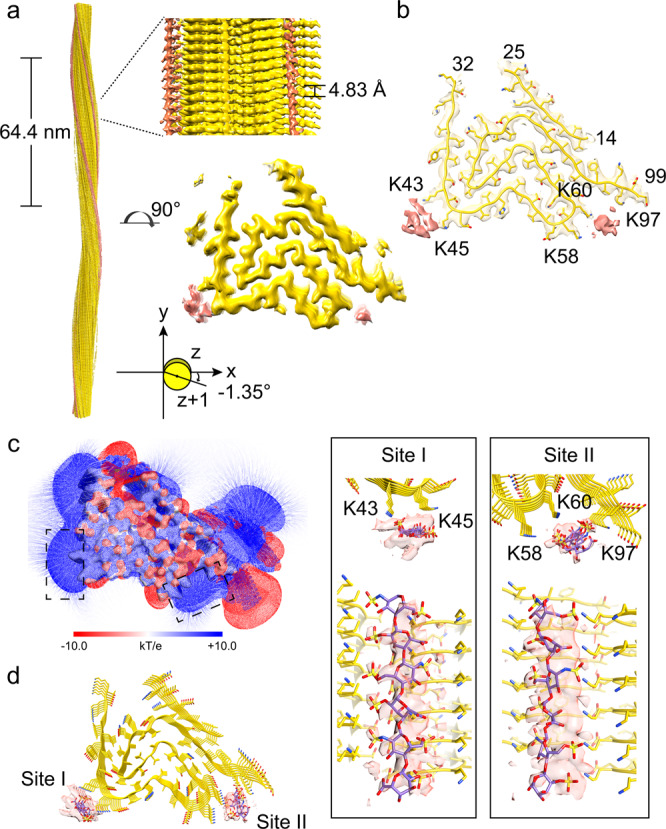
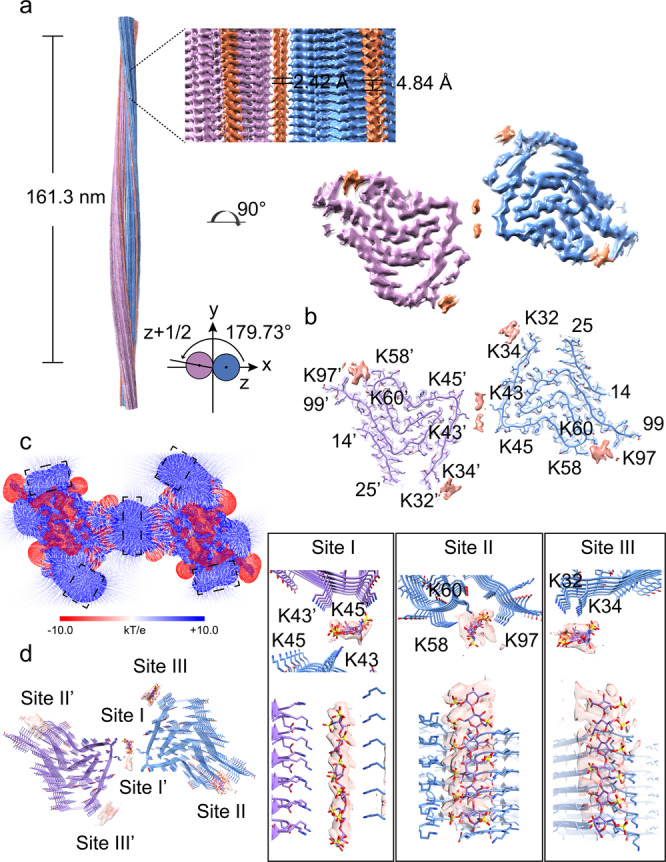
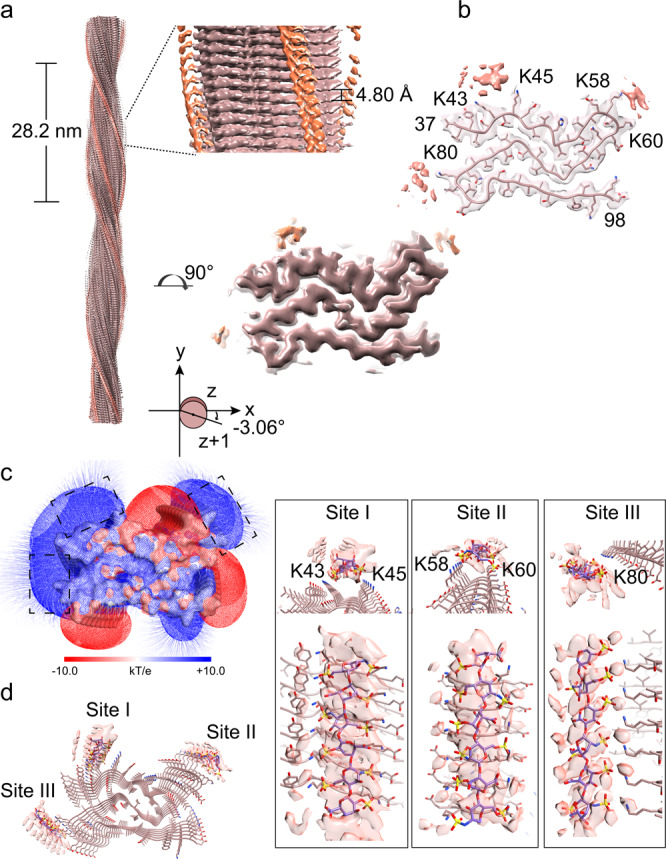
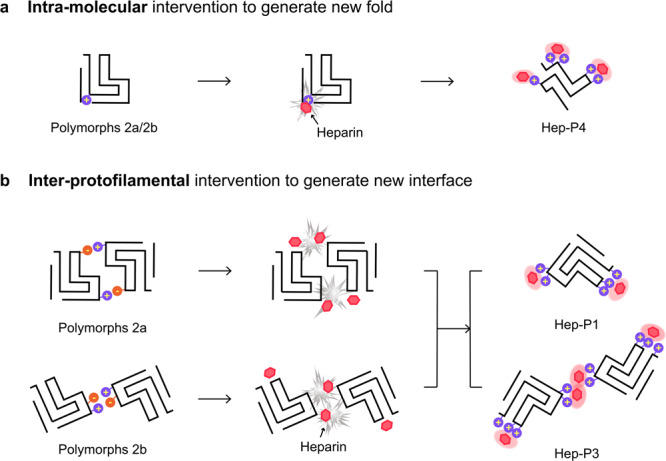
α-Synuclein (α-syn), as a primary pathogenic protein in Parkinson's disease (PD) and other synucleinopathies, exhibits a high potential to form polymorphic fibrils. Chemical ligands have been found to involve in the assembly of α-syn fibrils in patients' brains. However, how ligands influence the fibril polymorphism remains vague. Here, we report the near-atomic structures of α-syn fibrils in complex with heparin, a representative glycosaminoglycan (GAG), determined by cryo-electron microscopy (cryo-EM). The structures demonstrate that the presence of heparin completely alters the fibril assembly via rearranging the charge interactions of α-syn both at the intramolecular and the inter-protofilamental levels, which leads to the generation of four fibril polymorphs. Remarkably, in one of the fibril polymorphs, α-syn folds into a distinctive conformation that has not been observed previously. Moreover, the heparin-α-syn complex fibrils exhibit diminished neuropathology in primary neurons. Our work provides the structural mechanism for how heparin determines the assembly of α-syn fibrils, and emphasizes the important role of biological polymers in the conformational selection and neuropathology regulation of amyloid fibrils.


Conflict of interest statement

The authors declare no competing interests.

Figures

Fig. 1
Fig. 1. Polymorphic fibrils of α-syn formed in the presence of heparin.
a ThT kinetic assay for α-syn aggregation in the presence of a gradient concentration of heparin. α-Syn concentration is 50 μM. Data shown are mean ± SD, n = 5 independently prepared samples. b Representative negative-staining TEM images of apo-α-syn fibrils (top) and hep-α-syn fibrils (bottom) from three biologically independent experiments. Scale bar = 100 nm. c Cryo-EM micrographs of hep-α-syn and apo-α-syn fibrils. Representative 2D class averages of each polymorph are shown as insets. Scale bar = 100 nm. d Central slices of the 3D maps of each polymorph of hep-α-syn fibrils and apo-α-syn fibrils. The proportions of each polymorph in the fibril sample are indicated. Arrows indicate the additional densities.
Fig. 2
Fig. 2. Cryo-EM structure of the Hep-P1 fibril.
a Cryo-EM density map of the Hep-P1 fibril. The fibril parameters including the length of half pitch (180° helical turn), helical rise and twist angle are indicated. Extra densities are displayed with the same threshold (0.0125) as protein densities. Extra densities for heparin are colored in red in the density map. No specified radius was used to plot around residues/heparin. b Cross-section view of the structural model fitted in the density map. The density map is the same map in (a) but restricted to areas within a 2 Å radius of the α-syn model, and then combined with the heparin densities in (a). c Cross-section view of the electrostatic potential surface of the Hep-P1 fibril. The heparin-binding sites are highlighted dash boxes. A surface potential color bar is shown. d Molecular docking of heparin into the extra densities. Heparin molecules are shown in sticks and colored in purple). Cross-section view is shown on the left. Side view is shown in boxes on the right.
Fig. 3
Fig. 3. Cryo-EM structure of the Hep-P3 fibril.
a Cryo-EM density map of the Hep-P3 fibril. The fibril parameters including the length of half pitch (180° helical turn), helical rise and twist angle are indicated. The two protofilements are colored in blue and purple, respectively. Extra densities are displayed with the same threshold (0.008) as protein densities. Extra densities for heparin are colored in orange in the density map. No specified radius was used to plot around residues/heparin. b Cross-section view of the structural model fitted in the density map. The density map is the same map in (a) but restricted to areas within a 2 Å radius of the α-syn model, and then combined with the heparin densities in (a). c Cross-section view of the electrostatic potential surface of the Hep-P3 fibril. The heparin-binding sites are highlighted dash boxes. A surface potential color bar is shown. d Molecular docking of heparin into the extra densities. Heparin molecules are shown in sticks and colored in purple). Cross-section view is shown on the left. Side view is shown in boxes on the right.
Fig. 4
Fig. 4. Cryo-EM structure of the Hep-P4 fibril.
a Cryo-EM density map of the Hep-P4 fibril. The fibril parameters including the length of half pitch (180° helical turn), helical rise and twist angle are indicated. Extra densities are displayed with the same threshold (0.0095) as protein densities. Extra densities for heparin are colored in orange in the density map. No specified radius was used to plot around residues/heparin. b Cross-section view of the structural model fitted in the density map. The density map is the same map in (a) but restricted to areas within a 2 Å radius of the α-syn model, and then combined with the heparin densities in (a). c Cross-section view of the electrostatic potential surface of the Hep-P1 fibril. The heparin-binding sites are highlighted dash boxes. A surface potential color bar is shown. d Molecular docking of heparin into the extra densities. Heparin molecules are shown in sticks and colored in purple). Cross-section view is shown on the left. Side view is shown in boxes on the right.
Fig. 5
Fig. 5. Schematic diagram of the polymorphism of α-syn fibrils induced by heparin.
a Charge interactions of heparin with lysine residues that are buried inside the polymorphs 2a/2b fold block α-syn folds into polymorphs 2a/2b. Instead, α-syn forms a distinctive fold in complex with heparin. b Heparin disrupts the charge interactions between the protofilaments, which results in polymorphs either containing a single protofilament, or forming an interface mediated by heparin.

References

    1. Spillantini MG, et al. α-Synuclein in Lewy bodies. Nature. 1997;388:839–840. doi: 10.1038/42166. - DOI - PubMed
    1. Goedert, M., Jakes, R., Crowther, R. A. & Spillantini, M. G. in Parkinson’s Disease 33–59 (Springer, 2001).
    1. Burré J, et al. α-Synuclein promotes SNARE-complex assembly in vivo and in vitro. Science. 2010;329:1663–1667. doi: 10.1126/science.1195227. - DOI - PMC - PubMed
    1. Theillet F-X, et al. Structural disorder of monomeric α-synuclein persists in mammalian cells. Nature. 2016;530:45–50. doi: 10.1038/nature16531. - DOI - PubMed
    1. Georgieva ER, Ramlall TF, Borbat PP, Freed JH, Eliezer D. Membrane-bound α-synuclein forms an extended helix: long-distance pulsed ESR measurements using vesicles, bicelles, and rodlike micelles. J. Am. Chem. Soc. 2008;130:12856–12857. doi: 10.1021/ja804517m. - DOI - PMC - PubMed

Publication types