. 2022 Jul 22;13(7):639.
doi: 10.1038/s41419-022-05059-2.

SMOC2 promotes an epithelial-mesenchymal transition and a pro-metastatic phenotype in epithelial cells of renal cell carcinoma origin

Affiliations

SMOC2 promotes an epithelial-mesenchymal transition and a pro-metastatic phenotype in epithelial cells of renal cell carcinoma origin

Daniel Feng et al. Cell Death Dis. .

Abstract

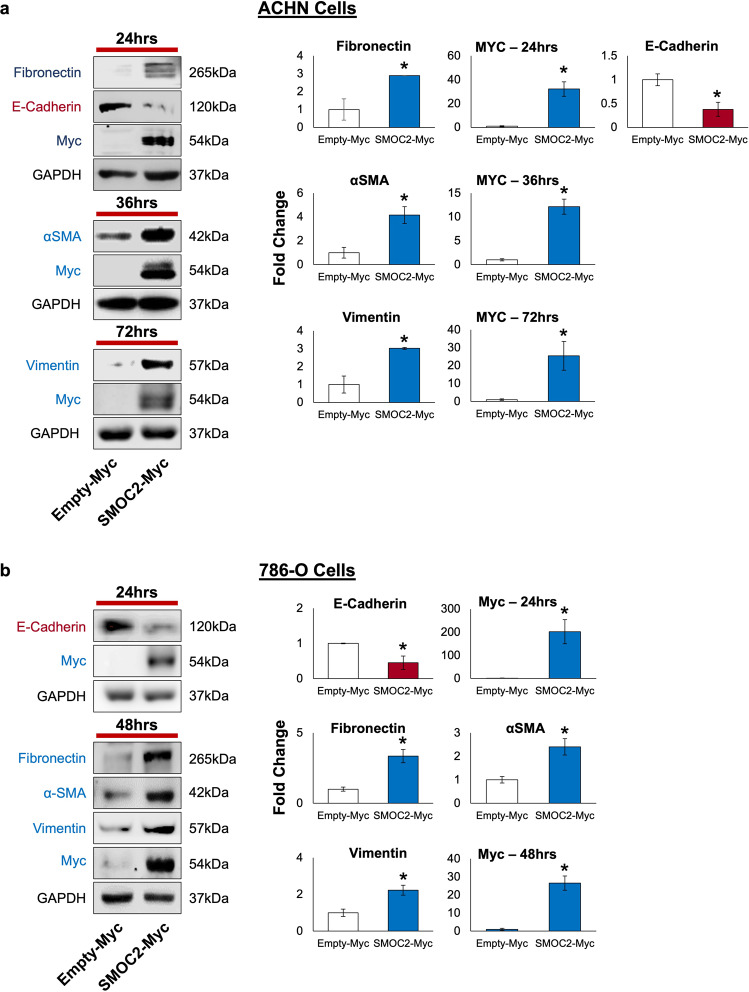
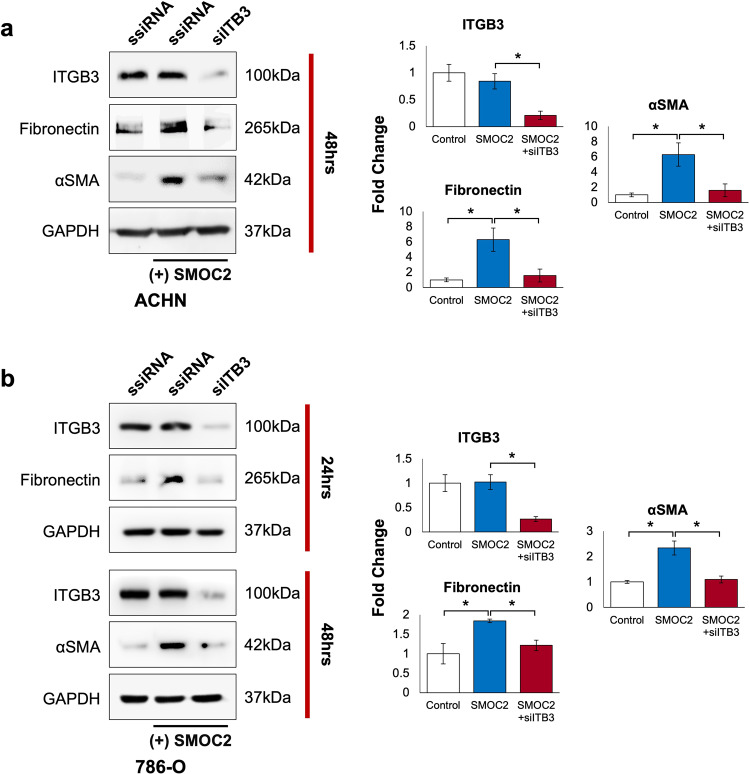
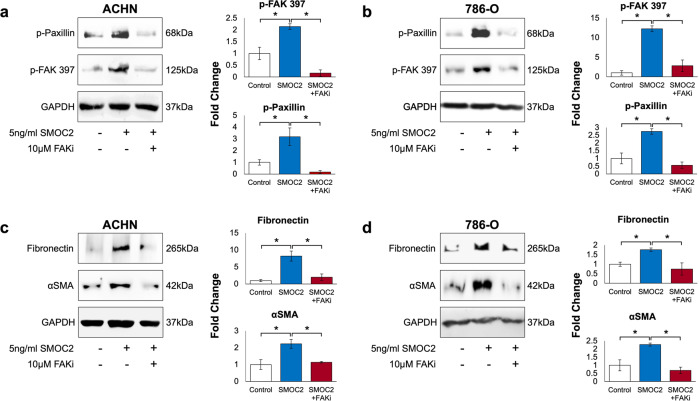
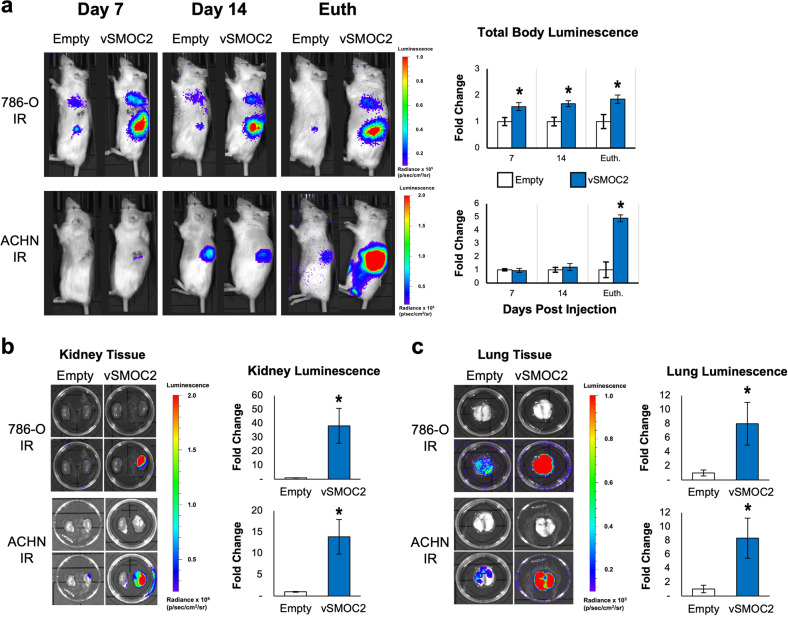
Renal Cell Carcinoma (RCC) is the most common form of all renal cancer cases, and well-known for its highly aggressive metastatic behavior. SMOC2 is a recently described non-structural component of the extracellular matrix (ECM) that is highly expressed during tissue remodeling processes with emerging roles in cancers, yet its role in RCC remains elusive. Using gene expression profiles from patient samples, we identified SMOC2 as being significantly expressed in RCC tissue compared to normal renal tissue, which correlated with shorter RCC patient survival. Specifically, de novo protein synthesis of SMOC2 was shown to be much higher in the tubular epithelial cells of patients with biopsy-proven RCC. More importantly, we provide evidence of SMOC2 triggering kidney epithelial cells into an epithelial-to-mesenchymal transition (EMT), a phenotype known to promote metastasis. We found that SMOC2 induced mesenchymal-like morphology and activities in both RCC and non-RCC kidney epithelial cell lines. Mechanistically, treatment of RCC cell lines ACHN and 786-O with SMOC2 (recombinant and enforced expression) caused a significant increase in EMT-markers, -matrix production, -proliferation, and -migration, which were inhibited by targeting SMOC2 by siRNA. We further characterized SMOC2 activation of EMT to occur through the integrin β3, FAK and paxillin pathway. The proliferation and metastatic potential of SMOC2 overexpressing ACHN and 786-O cell lines were validated in vivo by their significantly higher tumor growth in kidneys and systemic dissemination into other organs when compared to their respective controls. In principle, understanding the impact that SMOC2 has on EMT may lead to more evidence-based treatments and biomarkers for RCC metastasis.


Conflict of interest statement

The authors declare no competing interests.

Figures

Fig. 1
Fig. 1. SMOC2 is upregulated in RCC epithelial cells and its high expression predicts poor RCC patient outcome.
a SMOC2 mRNA expression in RCC patient biopsies at stage 1 and 2 compared to the healthy patients (n = 10 patients/condition). b H&E staining of RCC patient tissue biopsies. RCC tissue show loss of kidney structures, replaced by condensed cells. Immunofluorescence of RCC patient tissue biopsies show SMOC2 (green), vimentin (red) and DAPI (blue). Distal tubules are indicated by yellow arrows, while proximal tubules are indicated by purple arrows. Images are representative of n = 4; *p < 0.05 determined by t-test. Scale bar: 50 μm; 20X Magnification. c Endogenous SMOC2 levels in a normal human kidney cell line (HK2), and human RCC epithelial cell lines 786-O and ACHN. Ponceau staining served as a loading control. d Kaplan-Meier plot of SMOC2 mRNA expression levels (low vs. high) correlating patient survival rate. 5-year survival rates for low and high SMOC2 expression, p score and patient size are listed for total male and female patients.
Fig. 2
Fig. 2. SMOC2 affects the morphology and colony organization of epithelial cells.
ACHN cells were transfected for 24 h with a an empty-Myc or SMOC2-Myc vector, and b silencing RNA (ssiRNA) or SMOC2 siRNA, then evaluated for their morphology. siRNA transfections were cotreated with TGFβ1. Cells were outlined in red for increased visibility. c After 24 h of transfection with an empty-Myc or SMOC2-Myc vector, MDCK cells formed a confluent monolayer then scratched for a Scratch assay. Images of MDCK cells were taken 24 h after the inflicted scratch. d 786-O cells were transduced with a SMOC2-luc or empty-luc vector, which were used to form a confluent monolayer, then scratched for a Scratch assay. Live cell analysis was performed on such 786-O cells over a 43 h period to calculate the percentage of wound confluence as a function of time for triplicates (15 000 cells/well). Wound confluence (%) represents the fractional area of the wound that is occupied by cells. a, b were taken at 20X magnification and c was taken at 10X magnification. Scale bar: 50 μm. Images are representative of n = 3; *P < 0.05 determined by t-test between SMOC2 and control cells at each time point.
Fig. 3
Fig. 3. Recombinant SMOC2 treatment of RCC cells induces the protein expression of key EMT markers.
a ACHN and b 786-O cells were treated with either 10 ng/mL recombinant SMOC2 or vehicle (control), then protein harvested at indicated times. Cell extracts were subjected to Western blot analysis for fibronectin, E-cadherin, αSMA and vimentin. GAPDH immunoblotting served as a loading control. Representative of n = 3; *P < 0.05 determined by t-test.
Fig. 4
Fig. 4. SMOC2 overexpression induces EMT markers in RCC cells.
a ACHN and b 786-O cells were transfected with either a SMOC2-Myc or empty-Myc vector, then protein harvested at indicated times. Cell extracts were subjected to Western blot analysis for fibronectin, E-cadherin, αSMA, vimentin and SMOC2 (Myc). GAPDH immunoblotting served as a loading control. Representative of n = 3; *P < 0.05 determined by t-test.
Fig. 5
Fig. 5. SMOC2 binds to integrin β3.
a ACHN and b 786-O cells were transfected with either a SMOC2-Myc or empty-Myc vector, then protein harvested after 24 h. Cell extracts were immunoprecipitated for Myc. Western blot analysis was performed on whole cell extracts (2.5% Input), supernatant and Myc-immunoprecipitated samples for Myc, integrin β3 (ITGB3) and GAPDH. Western blot images are representative of repeated experiments.
Fig. 6
Fig. 6. SMOC2 interacts with integrin β3 to mediate EMT.
a ACHN and b 786-O cells were transfected with either scrambled siRNA (ssiRNA) or integrin β3 siRNA (siITB3) 24 h prior to 5 ng/mL SMOC2 recombinant protein treatment, then protein harvested after 24 and 48 h. Western blot was performed on whole cell extracts for integrin β3 (ITGB3), and EMT markers fibronectin and αSMA. GAPDH immunoblotting served as a loading control. Images are representative of n = 3; *P < 0.05 determined by t-test.
Fig. 7
Fig. 7. SMOC2 activates EMT through integrin proximal proteins.
a, c ACHN and b, d 786-O cells were pretreated for 2 h with a focal adhesion kinase inhibitor (10 μM FAKi), then treated with recombinant SMOC2 or vehicle (control). After 5 min of SMOC2 treatment, protein from a ACHN and b 786-O cells was harvested and a Western blot analysis was performed on whole cell extracts for phosphorylated Focal Adhesion Kinase (P-FAK) at site Y397, and phosphorylated paxillin at site Tyr118. After 24 h of SMOC2 treatment, protein from c ACHN and d 786-O cells was harvested and a Western blot analysis was performed on whole-cell extracts for ECM proteins Fibronectin and αSMA. GAPDH immunoblotting served as loading controls. Images are representative of n = 3; *P < 0.05 determined by t-test.
Fig. 8
Fig. 8. SMOC2 activates the common properties of EMT.
Viability of a ACHN and b 786-O cells transfected with either a SMOC2-Myc or empty-Myc control vector, and c ACHN and d 786-O cells treated with either vehicle (CTRL) or 10, 50, 100 ng/mL SMOC2 were measured over time by an MTT assay. A Boyden chamber assay was performed on e ACHN and f 786-O cells treated 24 h with vehicle or 10 ng/mL SMOC2. Images are representative transwells. Each experiment was performed with an n = 3; *P < 0.05 determined by t-test.
Fig. 9
Fig. 9. SMOC2 is an important component in transforming epithelial cells into mesenchymal cells.
After 24 h of treatment with SMOC2 siRNA (siSMOC2) or scrambled siRNA (ssiRNA), a, c ACHN and b, d 786-O cells were treated with 5 ng/mL TGFβ1 for an additional 24 h. Western blot analysis was performed on whole cell extracts for a, b SMOC2, and c, d fibronectin, αSMA and vimentin. GAPDH immunoblotting served as a loading control. Representative of n = 3; *P < 0.05 determined by t-test.
Fig. 10
Fig. 10. Silencing SMOC2 reduces EMT activities in RCC cells.
After 24 h of treatment with SMOC2 siRNA or scrambled siRNA (ssiRNA), a ACHN and b 786-O cells were treated with 5 ng/mL TGFβ1 for 24 h. Viability was evaluated using an MTT assay. Boyden chamber assay was performed on c ACHN and d 786-O cells treated 24 h with SMOC2 siRNA or ssiRNA. Images are representative transwells. Each experiment was performed with an n = 3; *P < 0.05 determined by t-test.
Fig. 11
Fig. 11. SMOC2 overexpression promotes RCC tumor growth and metastasis in vivo.
a ACHN and 786-O cells were transduced with a luciferase-labeled SMOC2 (vSMOC2) or empty vector which were used for intrarenal (IR) injections of SCID mice. Mice were euthanized (Euth.) at 16 days for 786-O cell injections and 27-29 days for ACHN cell injections. Each experiment was performed with an n = 5–6; *P < 0.05 determined by t-test. Whole-body luminescence was detected by IVIS imaging, as shown by representative images. b Kidney and c lung tissue were isolated and tumor growth was quantified by luminescence as shown by representative images (Top row: brightfield image; Bottom row: superimposed top row brightfield image with luminescent image). Each experiment was performed with an n = 5-6; *P < 0.05 determined by t-test.
Fig. 12
Fig. 12. SMOC2 expression in RCC cells increases metastasis to the lungs in immunodeficient mice.
a ACHN and 786-O cells were transduced with a luciferase-labeled SMOC2 (vSMOC2) or empty vector and injected intravenously into the tail vein of SCID mice, then euthanized (Euth.) at 17–18 days (both cell type injections). Each experiment was performed with an n = 5-6; *P < 0.05 determined by t-test. Whole-body luminescence was detected by IVIS imaging, as shown by representative images. b Lung tissue was isolated and tumor growth was quantified by luminescence as shown by representative images (Top row: brightfield image; Bottom row: superimposed top row brightfield image with luminescent image). Each experiment was performed with an n = 5-6; *P < 0.05 determined by t-test.
Fig. 13
Fig. 13. Schematic representation of SMOC2 induction of EMT markers and migration.
SMOC2 binds to integrin of RCC cells and activates in a paracrine and autocrine fashion EMT by reducing E-cadherin intracellular binding for detachment, increasing αSMA cytoskeleton for larger cellular spreading, increasing pseudopodia extensions for migration, and increasing fibronectin expression for integration into migration tracks. Figure was produced using Servier Medical Art (http://smart.servier.com/).

Similar articles

Cited by

References

    1. Canadian Cancer Society., National Cancer Institute of Canada. Advisory Committee on Records and Registries. Canadian cancer statistics. Toronto: Canadian Cancer Society; 1987.
    1. Ljungberg B, Campbell SC, Choi HY, Jacqmin D, Lee JE, Weikert S, et al. The epidemiology of renal cell carcinoma. Eur Urol. 2011;60:615–21. doi: 10.1016/j.eururo.2011.06.049. - DOI - PubMed
    1. Han WK, Alinani A, Wu CL, Michaelson D, Loda M, McGovern FJ, et al. Human kidney injury molecule-1 is a tissue and urinary tumor marker of renal cell carcinoma. J Am Soc Nephrol. 2005;16:1126–34.. doi: 10.1681/ASN.2004070530. - DOI - PMC - PubMed
    1. Thiery JP, Acloque H, Huang RY, Nieto MA. Epithelial-mesenchymal transitions in development and disease. Cell. 2009;139:871–90. doi: 10.1016/j.cell.2009.11.007. - DOI - PubMed
    1. Roche J. The Epithelial-to-Mesenchymal Transition in Cancer. Cancers (Basel). 2018;10:52. - PMC - PubMed

Publication types

MeSH terms

Substances