. 2022 Jul 22;13(1):4228.
doi: 10.1038/s41467-022-31879-z.

Construction of the axolotl cell landscape using combinatorial hybridization sequencing at single-cell resolution

Affiliations

Construction of the axolotl cell landscape using combinatorial hybridization sequencing at single-cell resolution

Fang Ye et al. Nat Commun. .

Abstract

The Mexican axolotl (Ambystoma mexicanum) is a well-established tetrapod model for regeneration and developmental studies. Remarkably, neotenic axolotls may undergo metamorphosis, a process that triggers many dramatic changes in diverse organs, accompanied by gradually decline of their regeneration capacity and lifespan. However, the molecular regulation and cellular changes in neotenic and metamorphosed axolotls are still poorly investigated. Here, we develop a single-cell sequencing method based on combinatorial hybridization to generate a tissue-based transcriptomic landscape of the neotenic and metamorphosed axolotls. We perform gene expression profiling of over 1 million single cells across 19 tissues to construct the first adult axolotl cell landscape. Comparison of single-cell transcriptomes between the tissues of neotenic and metamorphosed axolotls reveal the heterogeneity of non-immune parenchymal cells in different tissues and established their regulatory network. Furthermore, we describe dynamic gene expression patterns during limb development in neotenic axolotls. This system-level single-cell analysis of molecular characteristics in neotenic and metamorphosed axolotls, serves as a resource to explore the molecular identity of the axolotl and facilitates better understanding of metamorphosis.


Conflict of interest statement

The authors declare no competing interests.

Figures
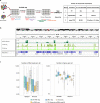
Fig. 1
Fig. 1. Profiling of the transcriptome in single cells using CH-seq.
a Diagram illustrating the experimental workflow for combinatorial hybridization sequencing (RT: Reverse transcription. For a detailed description of the experimental procedure, see Methods). b Representative genome browser view of CH-seq NIH/3T3 cell data, 10X Genomics data and ENCODE NIH/3T3 cell data (RNA-seq (“GSE39524”) read coverage using an integrative genomics viewer (IGV). ENCODE datasets were obtained from the Gene Expression Omnibus with the accession numbers mentioned above. c Box plots showing the number of uniquely mapped RNA reads and the number of genes detected per cell from HEK293T and NIH/3T3 cells (n = 842 cells, source data are provided as supplementary data 2, The boxplots are defined by the 25th and 75th percentiles, with the centre as the median, the minima and maxima extend to the largest value until 1.5 of the interquartile range and the smallest value at most 1.5 of interquartile range, respectively.). Original version of the number of genes and reads in sci-RNA-seq (“GSE98561”), SPLiT-seq (“GSE110823”), Drop-seq (“GSE63269”) and “10X Genomics scRNA-seq [https://support.10xgenomics.com/single-cell-gene-expression/datasets/3.0.2/1k_hgmm_v3_nextgem]” were obtained as source data in Paired-seq (Supplementary Data 2). The original dataset could be obtained from the Gene Expression Omnibus with the accession numbers mentioned above.
Fig. 2
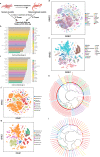
Fig. 2. Mapping the axolotl cell landscape.
a Experimental design of axolotl metamorphosis induction and adult axolotl cell landscape construction (number of biological replicates: neotenic axolotl CH-RNA-seq, n = 5; metamorphosed axolotl CH-RNA-seq, n = 3; bulk RNA-seq of neotenic axolotls, n = 2; bulk RNA-seq of metamorphosed axolotls, n = 2). Bar plots showing the number of cells detected in each tissue from adult neotenic axolotls (b) and metamorphosed axolotls (c) (log10 scale). t-stochastic neighbor embedding (tSNE) plots showing all the single cells profiled using CH-RNA-seq in adult neotenic axolotls (d) and adult metamorphosed axolotls (e), colored by tissues. tSNE plots showing all the single cells profiled using CH-RNA-seq in adult neotenic axolotls (f) and metamorphosed axolotls (g), colored by major cell types. Hierarchical trees showing the relationship between cell types in adult neotenic axolotls (h) and metamorphosed axolotls (i). Each hierarchy was built by performing hierarchical clustering on the area under the receiver operating characteristic (AUROC) scores acquired from MetaNeighbor analyses. Node color indicates the cell lineage for each cell type. The main branches, corresponding to the taxonomy, are annotated with cell lineages.
Fig. 3
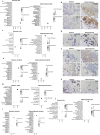
Fig. 3. Visualizing of cell clusters marker genes between neotenic and metamorphosed axolotls in major metamorphosed tissues.
a, b Dotplots visualizing expression of genes and representative RNA in situ hybridizations in skin probing for Muc5ac and Muc5b (Representative images in neotenic metamorphosed axolotls are chosen from two independently animal experiment, scale bars are 25 μm, blue: nuclei). c, d Dotplots visualizing expression of genes and representative RNA in situ hybridizations in lung probing for Cd109 (Representative images in neotenic metamorphosed axolotls are chosen from two independently animal experiment, scale bars are 25 μm, blue: nuclei). e, f Dotplots visualizing expression of genes and representative RNA in situ hybridizations in fore limbs probing for Krt6a, Muc4 (Representative images in neotenic metamorphosed axolotls are chosen from two independently animal experiment, scale bars are 25 μm, blue: nuclei). g, h Dotplots visualizing expression of genes and representative RNA in situ hybridizations in heart probing for Chga (Representative images in neotenic metamorphosed axolotls are chosen from two independently animal experiment, scale bars are 25 μm, blue: nuclei). i Dotplots visualizing expression of representative genes in intestine. j Dotplots visualizing expression of representative genes in eye.
Fig. 4
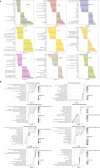
Fig. 4. Differentially expressed genes and their function enrichment between neotenic and metamorphosed axolotls tissues.
a Top 10 differentially expressed genes in major tissues (avg_log2FC: log fold-change of the average expression between neotenic axolotls and metamorphosed axolotls, avg_log2FC > 0: upregulated genes in neotenic axolotls, avg_log2FC < 0: upregulated genes in metamorphosed axolotls). b Gene ontology enrichment of differentially expressed genes in a (negative_log10_of_adjusted_p_value: −log 10 scale of p values, rich factor > 0: function enrichment of upregulated genes in neotenic axolotls with avg_log2FC > 0, rich factor < 0: function enrichment of upregulated genes in metamorphosed axolotls with avg_log2FC < 0, p values were calculated by the hypergeometric distribution, statistical test is one-sided, adjustments p values were made after p value is corrected by Benjamin & Hochberg multiple test).
Fig. 5
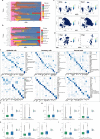
Fig. 5. Inner heterogeneity of major nonimmune parenchymal cell types in neotenic and metamorphosed axolotls.
Bar plots showing the fraction of cells per tissue derived from annotated major cell types in neotenic axolotls (a) and metamorphosed axolotls (b). c Feature plots visualization of Krt6a and Tnmd in neotenic axolotl (NEO) and metamorphosed axolotl (META) forelimbs. d Feature plots visualization of Chga in neotenic axolotl (NEO) and metamorphosed axolotl (META) hearts. e Heatmaps showing the top differentially expressed marker genes across tissues in three major cell types from adult neotenic axolotls (top: NEO) and metamorphosed axolotls (bottom: META). The color represents the expression level. Bar plots showing the activity of selected gene ontology (GO) enrichment terms in epithelial cells (f) (META: n = 54,036 cells, NEO: n = 458,162 cells), secretory cells (g) (META: n = 24,711 cells, NEO: n = 73,786 cells), stromal cells (h) (META: n = 27,466 cells, NEO: n = 77,572 cells), endothelial cells (i) (META: n = 3267 cells, NEO: n = 23,924 cells) from neotenic axolotls (NEO, green) and metamorphosed axolotls (META, blue) (n = number of cells, the boxplots are defined by the 25th and 75th percentiles, with the centre as the median, the minima and maxima extend to the largest value until 1.5 of the interquartile range and the smallest value at most 1.5 of interquartile range, respectively. “****”: p values < 0.001, in all cases, p value < 2.22e-10, t test was introduced, adjustments p values were made after p value is corrected by Benjamin & Hochberg multiple test).
Fig. 6
Fig. 6. Perturbation of skin cell types in response to metamorphosis.
a UMAP visualization of downsampled single cells from neotenic axolotl skin and all single cells from metamorphosed axolotl skin (right: UMAP plot colored by neotenic axolotl (NEO) and metamorphosed axolotl (META); left: UMAP plot showing the cluster numbers). b Feature plots visualization of Umod, Krt6a and Mmp19 in original neotenic axolotl skin samples (left) and original metamorphosed axolotl skin samples (right). c Dotplot showing selected marker gene expression in the original skin cluster (Neotenic: original skin clustering of neotenic axolotl skin in Supplementary Fig. 3; Metamorphosed: original skin clustering of neotenic axolotl skin in Supplementary Fig. 4). d Representative RNA in situ hybridizations in skin probing for Krt6a and Mmp19 (blue: nuclei, representative images in neotenic metamorphosed axolotls are chosen from two independently animal experiment, scale bars are 25 μm). e UMAP visualization of extracted perturbed differentially expressed genes from merged clustering of single cells (top right: same UMAP plot in which genes were colored by perturbed cell types; bottom: highlight of perturbed genes in Cluster 10 and Cluster 22). f Histogram of L1 distances between centroids of neotenic and metamorphosed axolotl cells within each merged cluster versus pairwise L1 distances between centroids of all merged clusters. Cluster 10 and Cluster 22 harbored the largest internal distances and overlapping distances. g Gene ontology (GO) enrichment of perturbed genes in each merged cluster. h UpSet plot visualization for intersecting sets of “perturbed” genes (left bar plot: number of differentially expressed perturbed genes under metamorphosis in each merged cluster; The connected dots represent overlaps between perturbed genes in each cluster, differentially expressed perturbed genes in only one cluster are colored in red; top bar plot: number of perturbed genes in red gene module).
Fig. 7
Fig. 7. Gene regulatory network analysis of neotenic and metamorphosed axolotls.
a Gene regulatory networks of neotenic axolotls and metamorphosed axolotls. Nodes represent network genes, and edges represent putative relationships. The size of nodes represents PageRank centralities. Calculated clusters are colored, and cell-type annotations are highlighted. Polygon shape covered annotated major cell types. b Same gene regulatory networks with the top 50 nodes ranked by PageRank centrality in the neotenic axolotl network and the top 100 nodes ranked by PageRank centrality in the metamorphosed axolotl network. Top nodes were highlighted in red. c Selected gene ontology (GO) enrichments of the top 100 differential PageRank centrality ranked nodes in the neotenic axolotl network and metamorphosed axolotl network (p values was calculated by the hypergeometric distribution, statistical test is one-sided, adjustments p values were made after p value is corrected by Benjamin & Hochberg multiple test).
Fig. 8
Fig. 8. Whole-organism CH-RNA-seq mapped neotenic axolotl limb development.
a Workflow for constructing larval neotenic axolotl single-cell landscape using CH-RNA-seq. b SPRING visualization of 217,781 single cells of larval neotenic axolotl whole-organism and cell-type annotation. c SPRING visualization of limb-development-related cell lineages (left) and limb regeneration blastema cell lineages (right). d MetaNeighbor analysis showing the cell-type correlations of limb-development-related cell lineages and limb regeneration blastema cell lineages (Reg). e Selected downregulated genes from Day 30 to Day 70 post-fertilization. f Selected upregulated genes from Day 30 to Day 70 post-fertilization. Gene ontology (GO) enrichment of downregulated genes (g) and upregulated genes (h) during limb development (p values was calculated by the hypergeometric distribution, statistical test is one-sided, adjustments p values were made after p value is corrected by Benjamin & Hochberg multiple test).

Similar articles

Cited by

References

    1. Voss, S. R., Epperlein, H. H. & Tanaka, E. M. Ambystoma mexicanum, the axolotl: a versatile amphibian model for regeneration, development, and evolution studies. Cold Spring Harb. Protoc.2009, pdb emo128. 10.1101/pdb.emo128 (2009). - PubMed
    1. Dall’Agnese A, Puri PL. Could we also be regenerative superheroes, like salamanders? Bioessays. 2016;38:917–926. doi: 10.1002/bies.201600015. - DOI - PubMed
    1. Safi R, et al. The axolotl (Ambystoma mexicanum), a neotenic amphibian, expresses functional thyroid hormone receptors. Endocrinology. 2004;145:760–772. doi: 10.1210/en.2003-0913. - DOI - PubMed
    1. Skulachev VP, et al. Neoteny, prolongation of youth: from naked mole rats to “naked apes” (Humans) Physiol. Rev. 2017;97:699–720. doi: 10.1152/physrev.00040.2015. - DOI - PubMed
    1. Vieira WA, Wells KM, McCusker CD. Advancements to the Axolotl model for regeneration and aging. Gerontology. 2020;66:212–222. doi: 10.1159/000504294. - DOI - PMC - PubMed

Publication types

MeSH terms