. 2022 Jul 22;13(1):4230.
doi: 10.1038/s41467-022-31951-8.

Myasthenia gravis-specific aberrant neuromuscular gene expression by medullary thymic epithelial cells in thymoma

Affiliations

Myasthenia gravis-specific aberrant neuromuscular gene expression by medullary thymic epithelial cells in thymoma

Yoshiaki Yasumizu et al. Nat Commun. .

Abstract

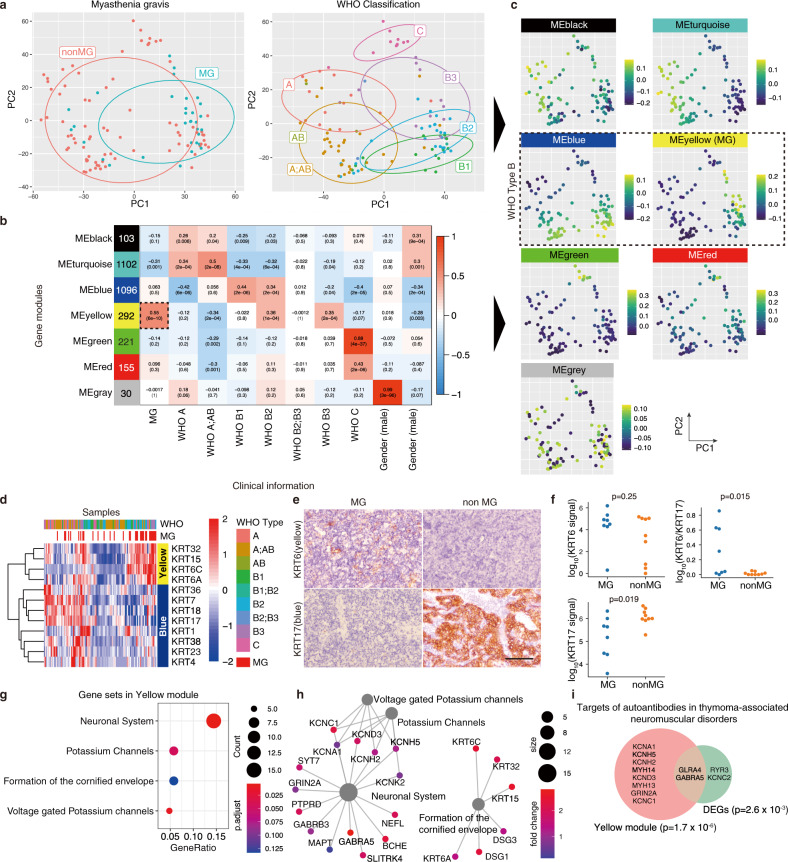
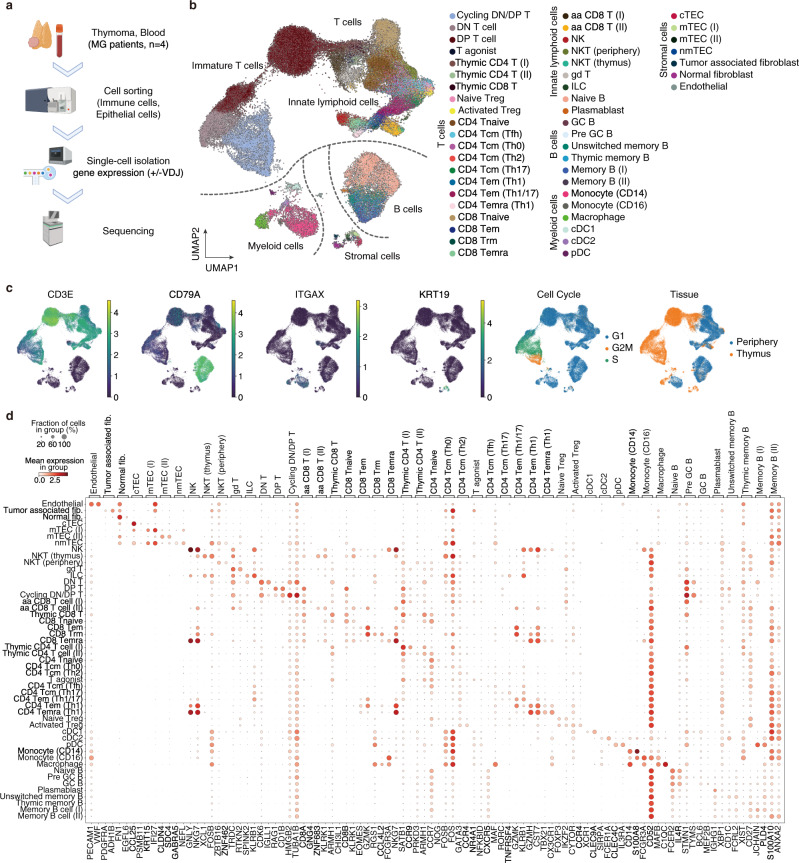
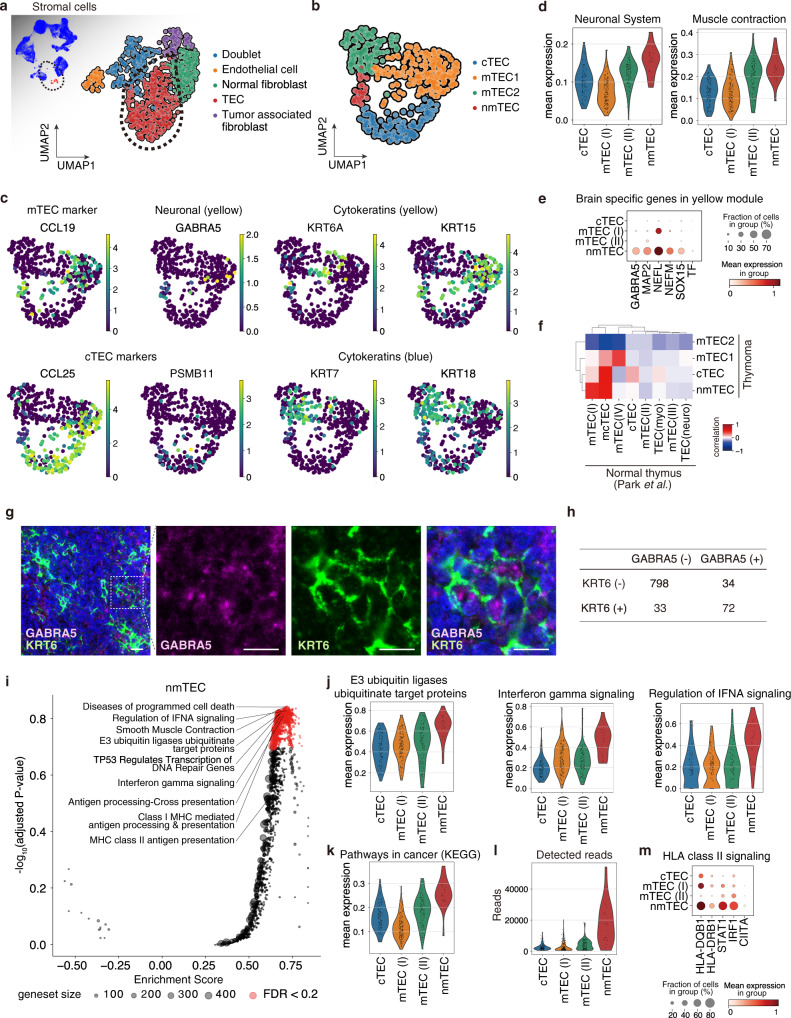
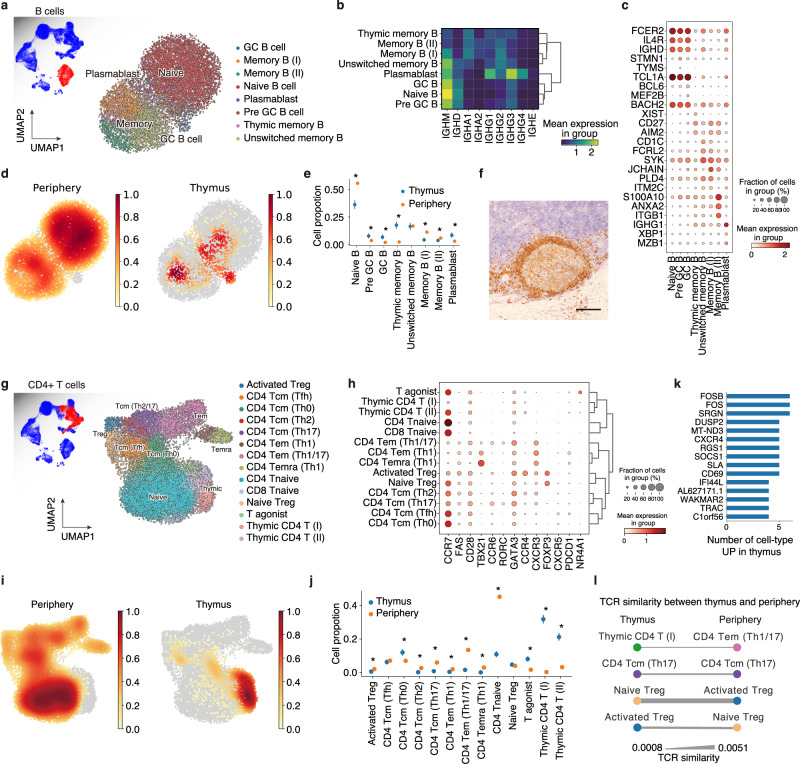
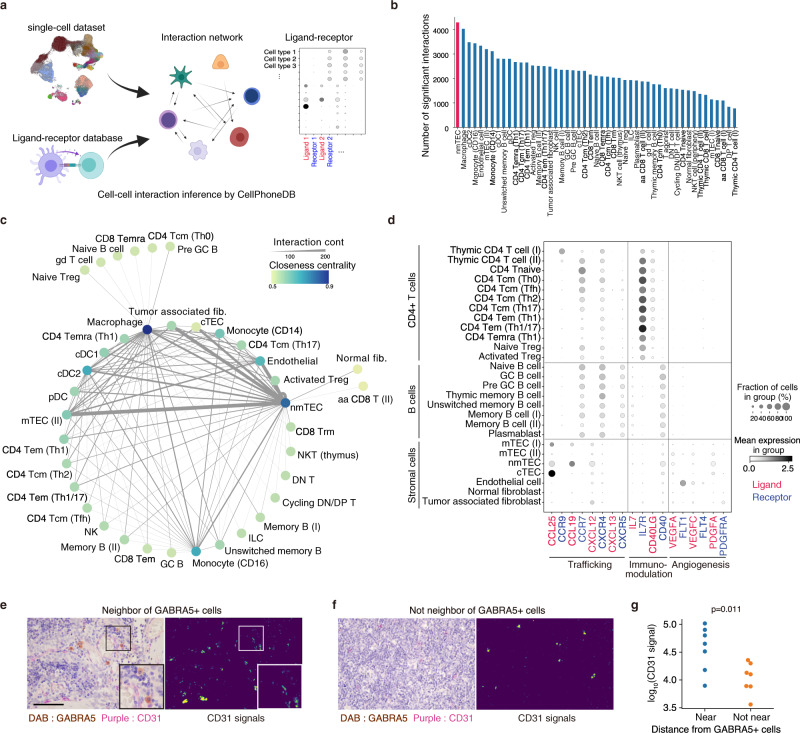
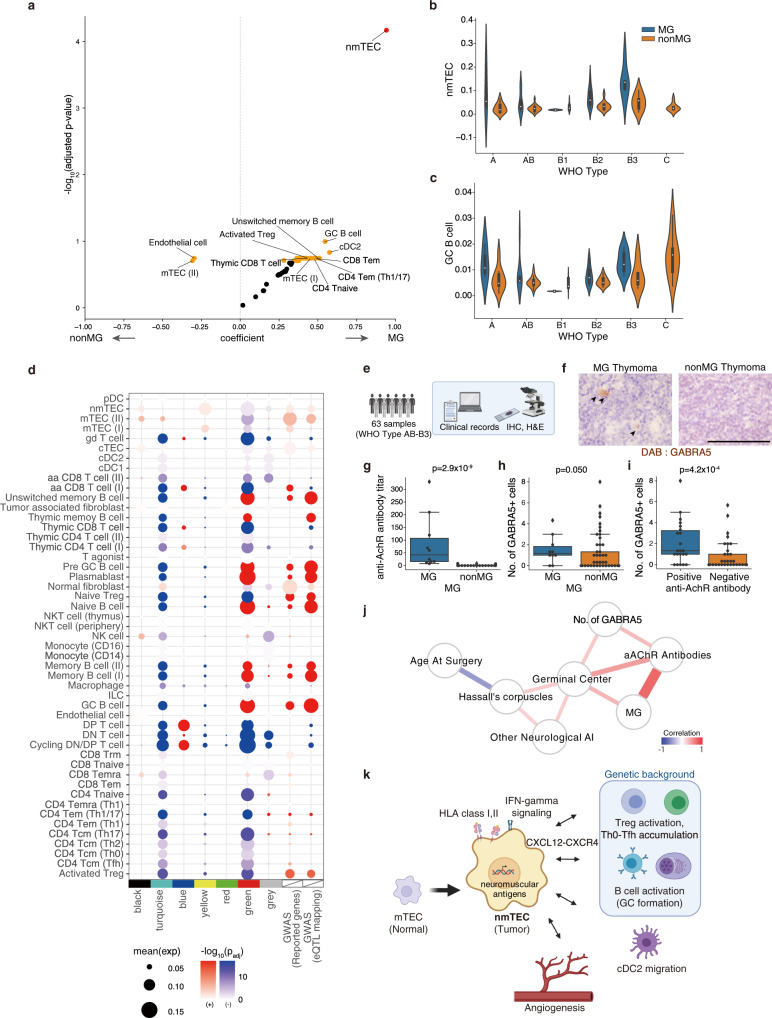
Myasthenia gravis (MG) is a neurological disease caused by autoantibodies against neuromuscular-associated proteins. While MG frequently develops in thymoma patients, the etiologic factors for MG are not well understood. Here, by constructing a comprehensive atlas of thymoma using bulk and single-cell RNA-sequencing, we identify ectopic expression of neuromuscular molecules in MG-type thymoma. These molecules are found within a distinct subpopulation of medullary thymic epithelial cells (mTECs), which we name neuromuscular mTECs (nmTECs). MG-thymoma also exhibits microenvironments dedicated to autoantibody production, including ectopic germinal center formation, T follicular helper cell accumulation, and type 2 conventional dendritic cell migration. Cell-cell interaction analysis also predicts the interaction between nmTECs and T/B cells via CXCL12-CXCR4. The enrichment of nmTECs presenting neuromuscular molecules within MG-thymoma is further confirmed immunohistochemically and by cellular composition estimation from the MG-thymoma transcriptome. Altogether, this study suggests that nmTECs have a significant function in MG pathogenesis via ectopic expression of neuromuscular molecules.


Conflict of interest statement

The authors declare no competing interests.

Figures

Fig. 1
Fig. 1. Transcriptome profiling of thymoma and MG-specific expression of neuro-related genes.
a PCA plots for transcription profile of thymomas from 116 patients. The left panel shows the disease status, MG or non-MG, and the right panel shows WHO classification based on histology. b Gene modules defined using WGCNA and the association with MG, WHO classification, gender, and age at diagnosis. Numbers in colored boxes on the left are the number of genes included in each module. The numbers in the heatmap show the correlation (upper) and the P-value (lower). c Eigengenes of each module for each patient on the PCA plot. d Heatmap of the gene expression of keratins in the yellow and blue modules. The color represents the Z-score of normalized expression by DESeq2. WHO classification and MG status were shown at the top of the heatmap. e Immunohistochemical (IHC) staining of KRT6 and KRT17 in MG and non-MG-thymoma. The scale bar: 100 µm. f Protein levels of KRT6 and KR17, and KRT6 normalized by KRT17 in MG and non-MG-thymoma quantified using microscopic images (MG n = 8, nonMG n = 9, Details are provided in Supplementary Fig. 2, 3 and Methods. Source data are provided as a Source Data file.). The signals were analyzed using a two-sided Mann–Whitney U-test. g Significantly enriched REACTOME pathways in the yellow module. The node size represents the number of genes included in each pathway, and the color represents the adjusted P-value of the enrichment. The pathways were sorted by the ratio of genes included in the yellow module. h Genes in enriched REACTOME pathway in the yellow module. Genes with log2 fold change > 1 in comparison of MG and non-MG were selected. i Venn diagram showing overlap of targets of autoantibodies associated with thymoma with genes in the yellow module and upregulated genes in MG. Data were analyzed using a two-sided Fisher’s exact test.
Fig. 2
Fig. 2. Overview of scRNAseq of thymoma and blood from anti-AChR receptor antibody positive patients.
a The experimental design of scRNAseq. Immune cells and non-immune cells from MG-type thymoma and immune cells from the blood of corresponding patients were collected for scRNAseq. b UMAP plot for 65,935 cells displaying the 49 clusters from thymoma and blood of MG patients. c UMAP plot of marker genes, inferred cell cycle, and tissue origins. d Dot plot depicting signature genes’ mean expression levels and percentage of cells expressing them across clusters. The detailed dot plot is shown in Supplementary Fig. 8c.
Fig. 3
Fig. 3. Neuromuscular thymic epithelial cells (nmTECs) expressed neuromuscular genes, IFN gamma signaling pathway genes, and HLA molecules.
a, b UMAP embedding for stromal clusters (a) and thymic epithelial cells (TECs) clusters (b) in thymoma. c Gene expression of marker genes on UMAP embedding. d, Violin plots of mean expression of the REACTOME gene sets; Neuronal System (left) and Muscle contraction (right) in TEC clusters. e Dot plot of the yellow module genes. Corresponding protein expressions were also confirmed using IHC (Supplementary Fig. 9b). f Heatmap showing correlation of transcriptional profile with TEC cells in thymoma (this publication) and a normal thymus (Park et al.). g Immunofluorescence staining for confirming the presence of nmTECs positive for GABRA5 (red), KRT6 (green), and DAPI (blue). Scale bars: 20 µm. h Cross table showing cell numbers of GABRA5 positive/negative and KRT6 positive/negative cells in a representative IHC slide. Data were analyzed using a two-sided Fisher’s exact test. i Volcano plot showing REACTOME gene sets enriched in nmTECs. jl Violin plots of mean expression of the gene sets (jk) and the number of detected reads per cell (l). j Represents the significantly enriched REACTOME gene sets and k represents the KEGG gene set, Pathways in cancer. m Dot plot of gene expression of HLA class II-related molecules in TECs.
Fig. 4
Fig. 4. Immune cell landscape elucidates GC formation, TH0-TFH enhancement, and Treg recirculation in MG-type thymoma.
a UMAP embedding for B cell clusters of thymoma and peripheral blood. b Heatmap of immunoglobulin expressions in each B cell cluster. Mean expressions in each group are shown as a heatmap. c Dot plot of gene expression of marker genes of each B cell cluster. d Density plots showing B cell accumulation in the periphery (left) and thymus (right). e Cell proportion of each B cell cluster in thymoma and peripheral blood. Periphery n = 2, Thymoma n = 4. Error bars show 98% highest density interval. *FDR < 0.05. (Methods) f Representative IHC image of germinal center in MG-thymoma stained for CD79A. Scale bar: 100 µm. The presence of GC was also checked in Fig. 6j and Source Data. g UMAP embedding for CD4+ T-cell clusters of thymoma and peripheral blood. h Dot plot of gene expression of marker genes of each T-cell cluster. i Density plots showing T-cell accumulation in the periphery (left) and thymus (right). j Cell proportion of each T-cell cluster in thymoma and peripheral blood. Periphery n = 2, Thymoma n = 4. Error bars show 98% highest density interval. Center points represent the mean of the posterior distributions. *FDR < 0.05. (Methods) k Bar plot of thymus specific genes across CD4+ T-cell clusters ranked by the number of cell types where each gene was upregulated (Padj < 0.05 and log2 fold change > 1) in mature CD4+ T cells. l TCR similarity between peripheral blood and thymoma. The thicknesses of edges represents TCR similarity. *FDR < 0.05 in e and j. Statical procedures in e and j are described in Methods. GC germinal center.
Fig. 5
Fig. 5. nmTECs strongly associated with epithelial cells, myeloid cells, and T cells with characteristic ligand-receptor pairs.
a Schematic view of the cell–cell interaction analysis. b Bar chart showing the number of significant interactions with other cell types in each cell type. c Cell–cell interaction network inferred from scRNAseq data. Each node represents a cell type, and the thickness of each edge represents the number of significant interactions. Edges with <75 significant interactions were removed. d Dot plot of gene expression of ligand-receptor pairs involved in trafficking, immunomodulation, and angiogenesis in CD4+ T cells, B cells, and stromal cells. e, f Representative images of the colocalization of nmTECs (GABRA5; DAB) and endothelial cells (CD31; purple) in the vicinity of GABRA5+ cells (e) and not in the vicinity of GABRA5+ cells (f). Binarized signals are shown in yellow. Scale bar: 100 µm. g Protein levels of CD31 near and not near from GABRA5+ cells in MG-thymoma quantified using microscopic images (Near n = 7, Non-Near n = 7. Details are provided in Supplementary Fig. 13 and Methods. Source data are also provided as a Source Data file.). For each group, seven areas from four MG patients were quantified. The signals were analyzed using a two-sided Mann–Whitney U-test.
Fig. 6
Fig. 6. Cell-type wide analysis exhibits nmTECs and GC B cells associate with MG.
a Volcano plot showing the association with MG for deconvoluted cell proportions s, which were calculated from TCGA bulk RNA-seq dataset (n = 116) with the reference defined in our scRNAseq analysis. Coefficients and p-values were calculated with multiple regression (Methods). Red dot FDR < 0.05, orange dots FDR < 0.2. b, c Violin plots of the inferred cell proportion of TCGA bulk RNA-seq dataset (n = 116) for nmTECs (b) and GC B cells (c) partitioned by WHO classification and MG status. Box plots show IQRs and whiskers show the maximum or minimum value in the dataset excluding outliers (Q3 + 1.5 × IQR or Q1 − 1.5 × IQR). d Expression enrichment of gene modules, targets of autoantibodies in thymoma-associated neuromuscular disorders, and GWAS-reported genes for early-onset MG (EOMG) and late-onset MG (LOMG). The enrichment score for each gene set was analyzed using a two-sided Mann–Whitney U-test across cell-type, and the adjusted P-value was calculated. A positive correlation is colored in red, and a negative correlation is in blue. e Strategy of histological assessment by an independent cohort. f Representative Immunohistochemical (IHC) staining images of GABRA5 in MG (left) and non-MG (right) thymoma. Arrowheads indicate GABRA5-positive cells. Scale bar: 100 µm. gi Box plots of anti-AChR antibody titer (nmol/L) (g) and the number of GABRA5-positive cells in thymoma (h) in MG and non-MG-thymoma patients, and the number of GABRA5-positive cells in thymoma partitioned by anti-AChR antibody titer (i). Data were analyzed using a two-sided Mann–Whitney U-test. Box plots show IQRs and whiskers show the maximum or minimum value in the dataset excluding outliers (Q3 + 1.5 × IQR or Q1 − 1.5 × IQR). Source data are provided as a Source Data file. j Network showing the correlation with clinical and histological features. Anti-AChR antibody titer was tested before the thymectomy. The existence of the germinal center was determined using H&E staining or DAB staining for CD79A. Statistically significant edges with the multiple test correction were retained (FDR < 0.2). The edge color represents Pearson’s correlation, and the thickness of the edge represents -log10FDR. Source data are provided as a Source Data file. k Proposed MG pathology in thymoma.

References

    1. Romi F. Thymoma in myasthenia gravis: from diagnosis to treatment. Autoimmune Dis. 2011;2011:1–5. doi: 10.4061/2011/474512. - DOI - PMC - PubMed
    1. Mao Z-F, Mo X-A, Qin C, Lai Y-R, Hackett ML. Incidence of thymoma in myasthenia gravis: a systematic review. J. Clin. Neurol. 2012;8:161. doi: 10.3988/jcn.2012.8.3.161. - DOI - PMC - PubMed
    1. Zekeridou A, McKeon A, Lennon VA. Frequency of synaptic autoantibody accompaniments and neurological manifestations of thymoma. JAMA Neurol. 2016;73:853. doi: 10.1001/jamaneurol.2016.0603. - DOI - PubMed
    1. Wolfe GI, et al. Randomized trial of thymectomy in myasthenia gravis. N. Engl. J. Med. 2016;375:511–522. doi: 10.1056/NEJMoa1602489. - DOI - PMC - PubMed
    1. Lippner EA, Lewis DB, Robinson WH, Katsumoto TR. Paraneoplastic and therapy-related immune complications in thymic malignancies. Curr. Treat. Options Oncol. 2019;20:62. doi: 10.1007/s11864-019-0661-2. - DOI - PubMed

Publication types