. 2022 Jul 23;13(1):4256.
doi: 10.1038/s41467-022-31980-3.

A phylogenetically-restricted essential cell cycle progression factor in the human pathogen Candida albicans

Affiliations

A phylogenetically-restricted essential cell cycle progression factor in the human pathogen Candida albicans

Priya Jaitly et al. Nat Commun. .

Abstract

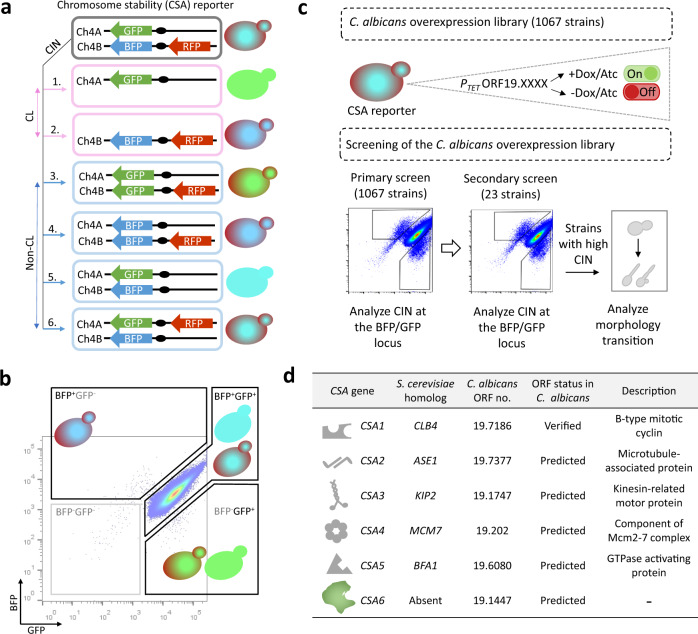
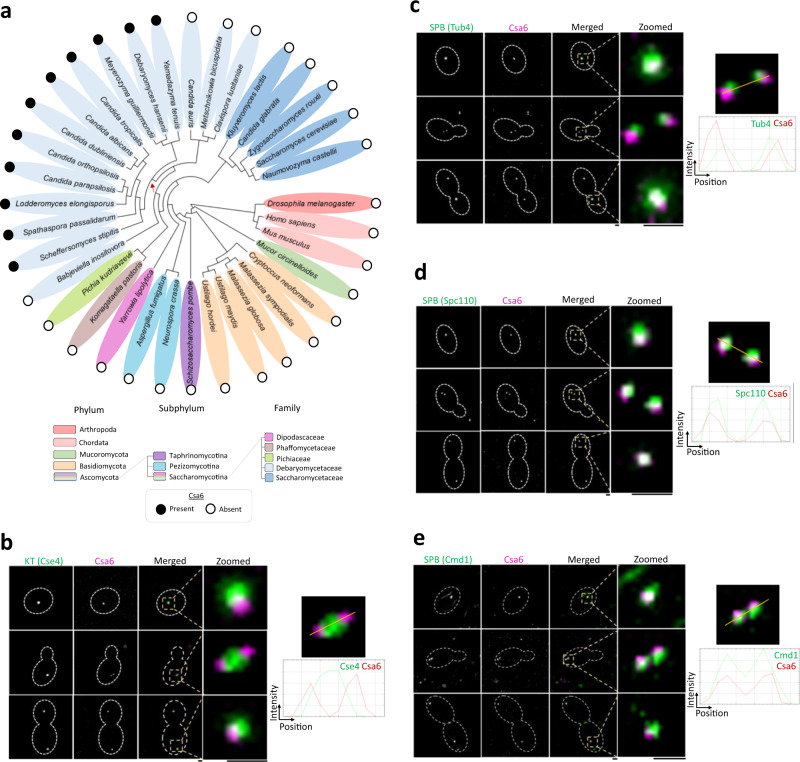
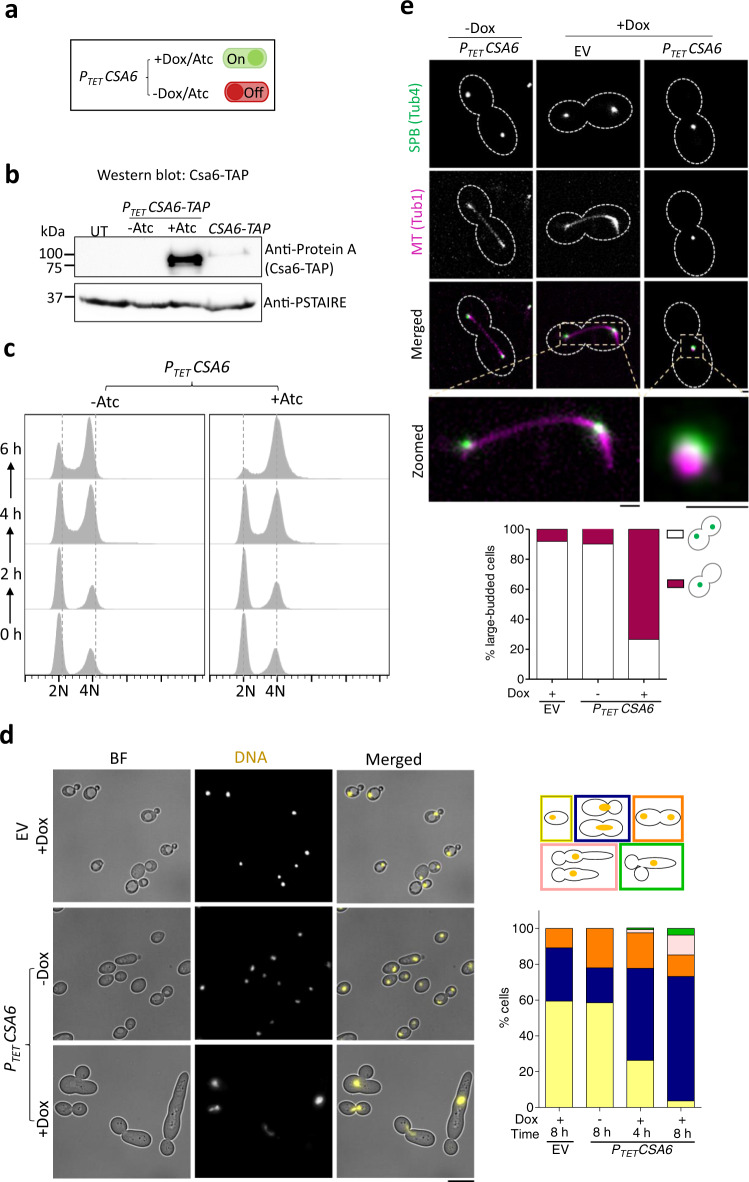
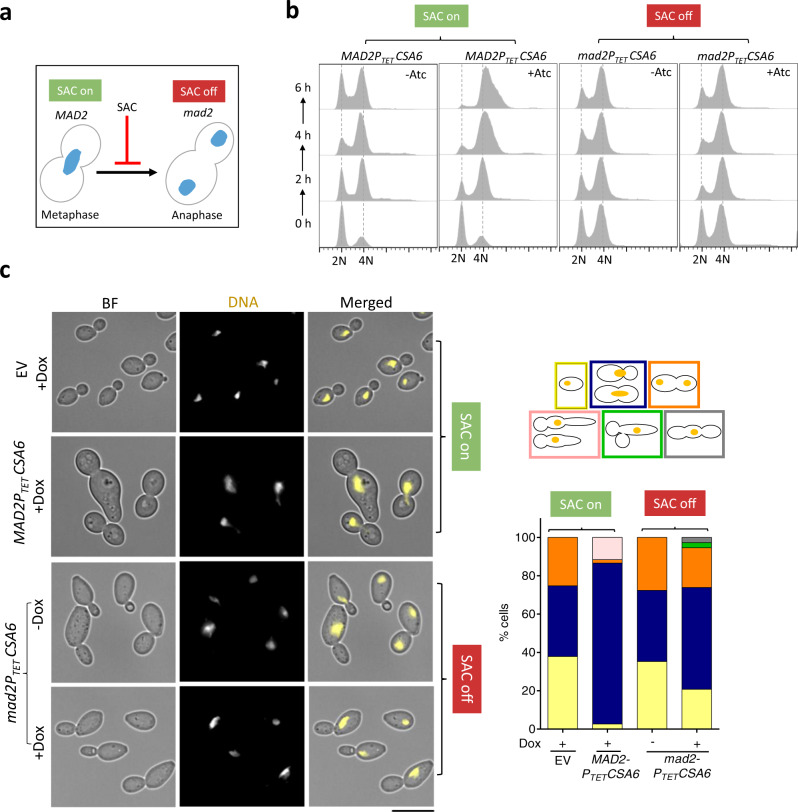
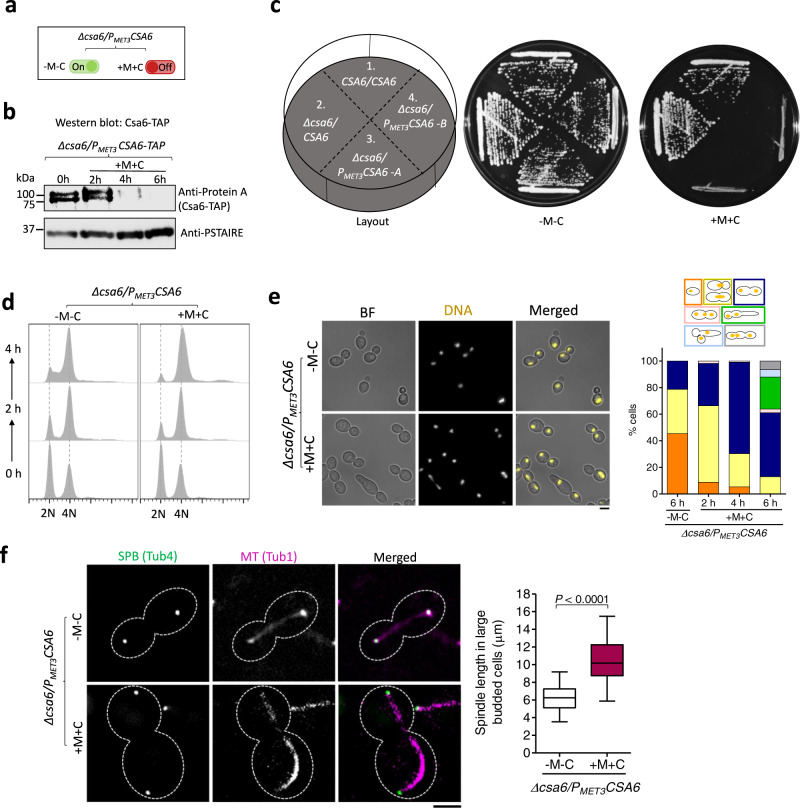
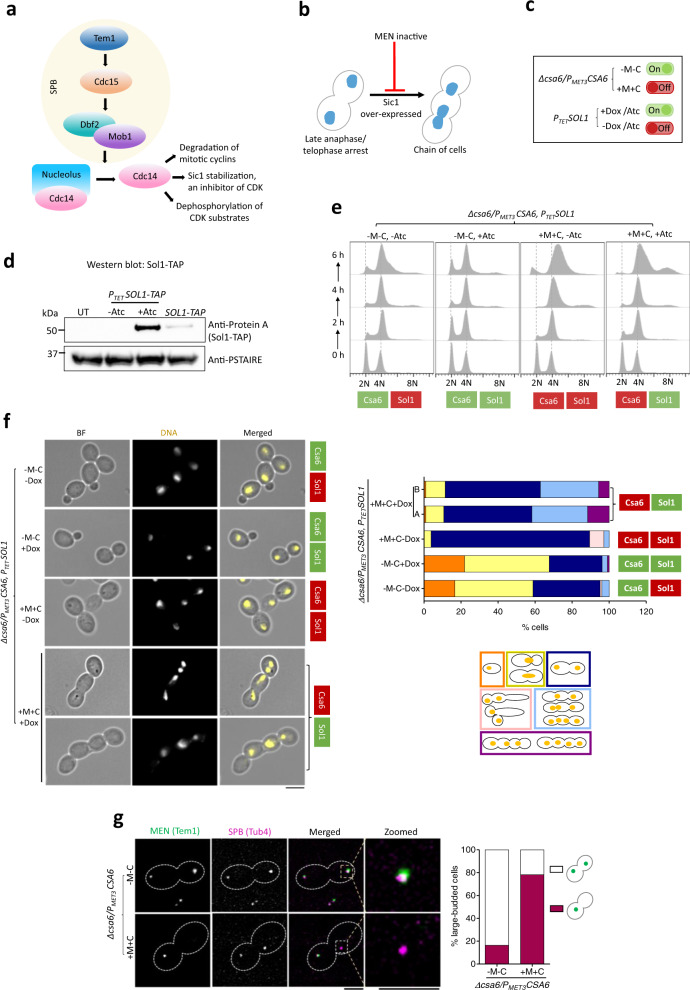
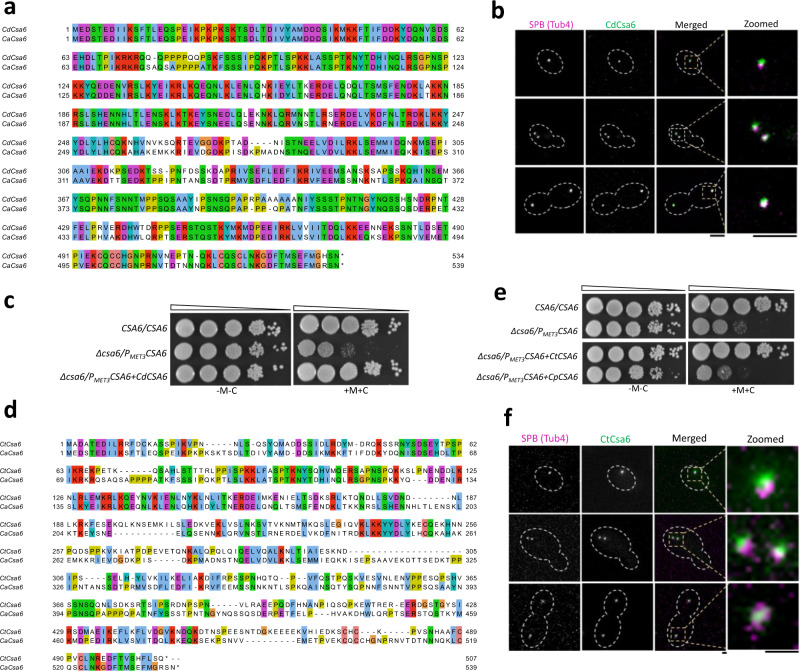
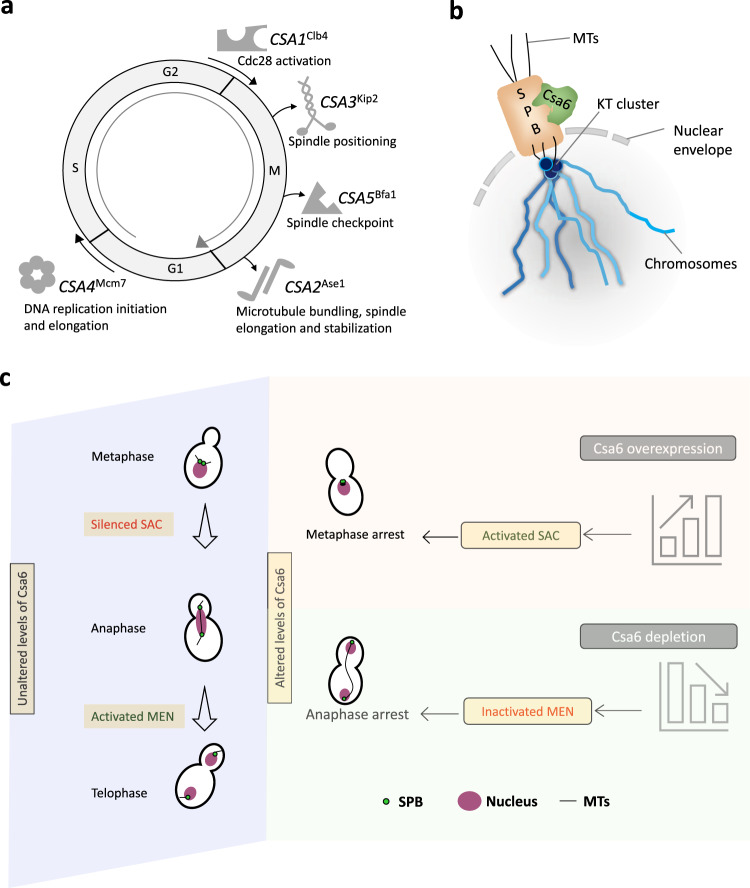
Chromosomal instability caused by cell division errors is associated with antifungal drug resistance in fungal pathogens. Here, we identify potential mechanisms underlying such instability by conducting an overexpression screen monitoring chromosomal stability in the human fungal pathogen Candida albicans. Analysis of ~1000 genes uncovers six chromosomal stability (CSA) genes, five of which are related to cell division genes of other organisms. The sixth gene, CSA6, appears to be present only in species belonging to the CUG-Ser clade, which includes C. albicans and other human fungal pathogens. The protein encoded by CSA6 localizes to the spindle pole bodies, is required for exit from mitosis, and induces a checkpoint-dependent metaphase arrest upon overexpression. Thus, Csa6 is an essential cell cycle progression factor that is restricted to the CUG-Ser fungal clade, and could therefore be explored as a potential antifungal target.


Conflict of interest statement

The authors declare no competing interests.

Figures

Fig. 1
Fig. 1. A medium-throughput protein overexpression screen identifies a set of CSA genes in C. albicans.
a Possible outcomes of CIN at the BFP/GFP and RFP loci. 1-4, CIN at the BFP or GFP locus, because of either chromosome loss (CL) or non-CL events such as break-induced replication, gene conversion, chromosome truncation or mitotic crossing over, will lead to the expression of either GFP or BFP expressing genes. CIN due to CL can be specifically identified by the concomitant loss of BFP and RFP, as shown in 1. 5 and 6, cells undergoing non-CL events at the RFP locus will continue to express BFP and GFP. b Flow cytometric analysis of the BFP/GFP density profile of empty vector (EV) (CaPJ150) containing BFP, GFP and RFP genes. The majority of the cells are positive for both BFP and GFP (BFP+GFP+). A minor fraction of the population had lost either one of the markers (BFP+GFP- or BFP-GFP+) or both the markers (BFP-GFP-), indicating spontaneous instability of this locus. Approximately 1 million events are displayed. c Pictorial representation of the screening strategy employed for identifying CSA genes in C. albicans. Briefly, a library of C. albicans overexpression strains (1067), each carrying a unique ORF under the tetracycline-inducible promoter, PTET, was generated using the CSA reporter (CEC5201) as the parent strain. The library was then analyzed by primary and secondary screening methods to identify CSA genes. In the primary screen, CIN frequency at the BFP/GFP locus in the individual 1067 overexpression strains was determined using flow cytometry. Overexpression strains exhibiting increased CIN (23 out of 1067) were taken forward for secondary screening. The secondary screen involved revalidation of the primary hits for increased CIN at the BFP/GFP locus by flow cytometry. Strains that reproduced the increased CIN phenotype were further examined for yeast to filamentous transition by microscopy. d A brief overview of the CSA genes identified from the overexpression screen (6 out of 1067). Functional annotation of genes is based on the information available either in Candida Genome Database (www.candidagenome.org) or Saccharomyces Genome Database (www.yeastgenome.org) on August 1, 2021.
Fig. 2
Fig. 2. Csa6 has a selective existence across fungal phylogeny and is constitutively localized to the SPBs in C. albicans.
a Phylogenetic tree showing the conservation of Csa6 across the mentioned species. The presence (filled circles) or absence (empty circles) of Csa6 in every species is marked. Each taxonomic rank is color-coded. The species mentioned under the family Debaryomycetaceae belong to the CUG-Ser clade in which the CUG codon is often translated as serine instead of leucine. The red arrow points to the CUG-Ser clade lineage that acquired Csa6. Searches for Csa6 homologs (E value ≤ 10−2) were carried out either in the Candida Genome Database (www.candidagenome.org) or NCBI nonredundant protein database. be Left, micrographs comparing the sub-cellular localization of Csa6 with KT (Cse4) and SPB (Tub4, Spc110 and Cmd1) at various cell cycle stages. b, Csa6-mCherry and Cse4-GFP (CaPJ119); c, Csa6-mCherry and Tub4-GFP (CaPJ120); d, Csa6m-Cherry and Spc110-GFP (CaPJ121) and e, Csa6m-Cherry and Cmd1-GFP (CaPJ122). Scale bar, 1 µm. Right, histogram plots showing the fluorescence intensity profile of Csa6-mCherry with Cse4-GFP (b), Tub4-GFP (c), Spc110-GFP (d) and Cmd1-GFP (e) across the indicated lines. Note that Cmd1 is also localized at the bud neck and as cables inside the cell in e.
Fig. 3
Fig. 3. Overexpression of Csa6 alters the morphology of the mitotic spindle and leads to G2/M arrest in C. albicans.
a Atc/Dox-dependent functioning of the PTET promoter system for conditional overexpression of CSA6. b Western blot analysis using anti-Protein A antibodies confirmed overexpression of CSA6-TAP from the PTET promoter (CaPJ181), after 8 h induction in presence of Atc (3 µg/ml), in comparison to the uninduced culture (-Atc) or CSA6-TAP expression from its native promoter (CaPJ180); N = 2. PSTAIRE was used as a loading control. UT, untagged control (SN148). c Flow cytometric analysis of cell cycle displaying the cellular DNA content of CSA6OE strain (CaPJ176) in presence or absence of Atc (3 µg/ml) at the indicated time intervals; N = 3. The gating strategy used for plotting flow cytometric cell cycle data is illustrated in Supplementary Fig. 13. d Left, microscopic images of Hoechst-stained EV (CaPJ170) and CSA6OE strain (CaPJ176) after 8 h of growth under indicated conditions of Dox (50 µg/ml). BF, bright-field. Scale bar, 10 µm. Right, quantitation of different cell types at the indicated time-points; n ≥ 100 cells. e Top, representative micrographs of spindle morphology in the large-budded cells of EV (CaPJ172) and CSA6OE strain (CaPJ178) after 8 h of growth under indicated conditions of Dox (50 µg/ml). SPBs and MTs are marked by Tub4-GFP and Tub1-mCherry, respectively. Scale bar, 1 µm. Bottom, the proportion of the large-budded cells with indicated SPB phenotypes; n ≥ 100 cells. Source data are provided as a Source Data file.
Fig. 4
Fig. 4. The G2/M cell cycle arrest in the CSA6OE mutant is mediated by Mad2.
a The G2/M arrest posed by SAC in response to an improper chromosome-spindle attachment is relieved in the absence of Mad2, allowing cells to transit from metaphase to anaphase. b Flow cytometric DNA content analysis in CaPJ176 (MAD2CSA6OE) and CaPJ197 (mad2CSA6OE) at the indicated times, in presence or absence of Atc (3 µg/ml); N = 3. c Left, microscopic images of CaPJ170 (EV), CaPJ176 (MAD2CSA6OE) and CaPJ197 (mad2CSA6OE) following Hoechst staining, after 8 h of growth under indicated conditions of Dox (50 µg/ml). Scale bar, 10 µm. Right, quantitation of the indicated cell types; n ≥ 100 cells.
Fig. 5
Fig. 5. Csa6 depletion causes late anaphase/telophase arrest with a hyper-extended mitotic spindle in C. albicans.
a The MET3 promoter system for depleting cellular levels of Csa6. The MET3 promoter can be conditionally repressed in presence of methionine (Met/M) and cysteine (Cys/C). b Western blot analysis using anti-Protein A antibodies revealed time-dependent depletion of Csa6-TAP in CSA6PSD strain (CaPJ212), grown under repressive conditions (YPDU + 5 mM Met and 5 mM Cys) for indicated time interval; N = 2. c Csa6 is essential for viability in C. albicans. Strains with indicated genotypes, (1) SN148, (2) CaPJ209, (3 and 4) CaPJ210 (two transformants) were streaked on agar plates with permissive (YPDU-Met-Cys) or repressive (YPDU + 5 mM Met and 5 mM Cys) media and incubated at 30 °C for two days. d Cell cycle analysis of CaPJ210 (CSA6PSD) by flow cytometry under permissive (YPDU-Met-Cys) and repressive conditions (YPDU + 5 mM Met and 5 mM Cys) at the indicated time intervals; N = 3. e Left, microscopic images of Hoechst stained CaPJ210 (CSA6PSD) cells grown under permissive (YPDU-Met-Cys) or repressive (YPDU + 5 mM Met and 5 mM Cys) conditions for 6 h. BF bright-field. Scale bar, 5 µm. Right, quantitation of different cell types at the indicated time-points; n ≥ 100 cells. f Left, micrograph showing Tub4-GFP and Tub1-mCherry (representing mitotic spindle) in the large-budded cells of CaPJ211 (CSA6PSD) after 6 h of growth under permissive (YPDU-Met-Cys) or repressive (YPDU + 5 mM Met and 5 mM Cys) conditions. Scale bar, 3 µm. Right, quantitation of the distance between the two SPBs, along the length of the MT (representing spindle length), in large-budded cells of CaPJ211 (CSA6PSD) under permissive (n = 32) or repressive (n = 52) conditions. Box plots include the median line, the box denotes the interquartile range (IQR), whiskers extend down to the minimum value and up to the maximum value. Paired t-test, one-tailed, P-value shows a significant difference (P < 0.0001). Source data are provided as a Source Data file.
Fig. 6
Fig. 6. Csa6 is required for mitotic exit in C. albicans.
a The MEN components in S. cerevisiae. At SPB, Nud1 acts as a scaffold. The ultimate target of the MEN is to activate Cdc14 phosphatase, which remains entrapped in the nucleolus in an inactive state until anaphase. Cdc14 release brings about mitotic exit and cytokinesis by promoting degradation of mitotic cyclins, inactivation of mitotic CDKs through Sic1 accumulation and dephosphorylation of the CDK substrates. b Inhibition of the MEN signaling prevents cells from exiting mitosis and arrests them at late anaphase/telophase. Bypass of cell cycle arrest due to the inactive MEN, viz. by overexpression of Sic1-a CDK inhibitor, results in the chain of cells with multiple nuclei,. c A combination of two regulatable promoters, PTET and PMET3, was used to overexpress C. albicans homolog of Sic1, called SOL1 (Sic one-like), in Csa6-depleted cells. The resulting strain, CaPJ215, can be conditionally induced for both SOL1 overexpression upon Atc/Dox addition and Csa6 depletion upon Met (M)/Cys (C) addition. d Protein A western blot analysis showed increased levels of Sol1 (TAP-tagged) in the SOL1OE mutant (CaP217, PTETSOL1-TAP) after 6 h induction in presence of Atc (3 µg/ml) in comparison to the uninduced culture (-Atc) or SOL1 expression from its native promoter (CaPJ216, SOL1-TAP); N = 2. PSTAIRE was used as a loading control. UT untagged control (SN148). e Flow cytometric analysis of cell cycle progression in CaPJ215 at indicated time intervals under various growth conditions, as indicated; N = 3. Dox: 50 µg/ml, Met: 5 mM, Cys: 5 mM. f Left, Hoechst staining of CaPJ215 after 6 h of growth under indicated conditions of Dox (50 µg/ml), Met (5 mM) and Cys (5 mM); n ≥ 100 cells. BF bright-field. Scale bar, 5 µm. Right, percent distribution of the indicated cell phenotypes; n ≥ 100 cells. g Left, co-localization analysis of Tem1-GFP and Tub4-mCherry in large-budded cells of CaPJ218 (CSA6PSD) under permissive (YPDU-Met-Cys) or repressive conditions (YPDU + 5 mM Met and 5 mM Cys). Scale bar, 3 µm. Right, the proportion of the large-budded cells with indicated Tem1 phenotypes; n ≥ 100 cells. Source data are provided as a Source Data file.
Fig. 7
Fig. 7. Functional complementation of CaCsa6 by its homologs in related species.
a Pair-wise alignment of amino acid sequences of Csa6 proteins in C. albicans (CaCsa6) and C. dubliniensis (CdCsa6) by Clustal Omega, visualized using Jalview. b CdCsa6 localizes to the SPB. Representative micrographs showing CdCsa6GFP localization at different cell cycle stages in CaPJ300. Tub4mCherry was used as an SPB marker. Scale bar, 3 µm. c CdCsa6 functionally complements CaCsa6. Ten-fold serial dilutions of SN148 (CSA6/CSA6), CaPJ301(CSA6PSD) and CaPJ302 (CSA6PSD expressing CdCSA6), starting from 105 cells were spotted on agar plates with permissive (YPDU-Met-Cys) or repressive (YPDU + 5 mM Met and 5 mM Cys) media and incubated at 30 °C for two days; N = 3. d Pair-wise protein sequence alignment of Csa6 of C. tropicalis (CtCsa6) and CaCsa6. e CtCsa6 but not CpCsa6 (Csa6 of C. parapsilosis) functionally complements CaCsa6. Spot dilution analysis of SN148 (CSA6/CSA6), CaPJ301(CSA6PSD), CaPJ303 (CSA6PSD expressing CtCSA6) and CaPJ304 (CSA6PSD expressing CpCSA6). Ten-fold serial dilutions, starting from 105 cells were spotted on permissive or repressive media; N = 3. f Representative micrographs showing constitutive localization of CtCsa6 at the SPBs in CaPJ303 (CSA6PSD expressing CtCSA6) under permissive conditions. SPBs are marked using Tub4mCherry. Scale bar, 1 µm.
Fig. 8
Fig. 8. Csa6 levels are fine-tuned at various stages of the cell cycle to ensure both mitotic progression and mitotic exit in C. albicans.
a A diagram illustrating the functions of the identified CSA genes except for CSA6 in various phases and phase transitions of the cell cycle. b Schematic depicting the approximate position of Csa6 with respect to SPB and KT. In C. albicans, SPBs and clustered KTs remain in close proximity throughout the cell cycle, while Csa6 remains constitutively localized to the SPBs. c A model summarizing the effects of overexpression or depletion of Csa6 in C. albicans. A wild-type cell with unperturbed Csa6 levels progresses through the mitotic cell cycle. Overexpression of CSA6 alters the mitotic spindle dynamics, which might lead to improper KT-MT attachments, prompting SAC activation and G2/M arrest. In contrast, decreased levels of Csa6 inhibit the MEN signaling pathway, probably by affecting Tem1 recruitment to the SPBs, resulting in cell cycle arrest at the late anaphase/telophase stage.

Similar articles

Cited by

References

    1. Aguilera A, Gomez-Gonzalez B. Genome instability: a mechanistic view of its causes and consequences. Nat. Rev. Genet. 2008;9:204–217. doi: 10.1038/nrg2268. - DOI - PubMed
    1. Potapova TA, Zhu J, Li R. Aneuploidy and chromosomal instability: a vicious cycle driving cellular evolution and cancer genome chaos. Cancer Metastasis Rev. 2013;32:377–389. doi: 10.1007/s10555-013-9436-6. - DOI - PMC - PubMed
    1. Yurov YB, Vorsanova SG, Iourov IY. Chromosome Instability in the Neurodegenerating Brain. Front Genet. 2019;10:892. doi: 10.3389/fgene.2019.00892. - DOI - PMC - PubMed
    1. Taylor AMR, et al. Chromosome instability syndromes. Nat. Rev. Dis. Prim. 2019;5:64. doi: 10.1038/s41572-019-0113-0. - DOI - PMC - PubMed
    1. Petr MA, Tulika T, Carmona-Marin LM, Scheibye-Knudsen M. Protecting the Aging Genome. Trends Cell Biol. 2020;30:117–132. doi: 10.1016/j.tcb.2019.12.001. - DOI - PubMed

Publication types