. 2022 Jul 22;8(1):61.
doi: 10.1038/s41522-022-00322-y.

Synthetic periphyton as a model system to understand species dynamics in complex microbial freshwater communities

Affiliations

Synthetic periphyton as a model system to understand species dynamics in complex microbial freshwater communities

Olga Lamprecht et al. NPJ Biofilms Microbiomes. .

Abstract

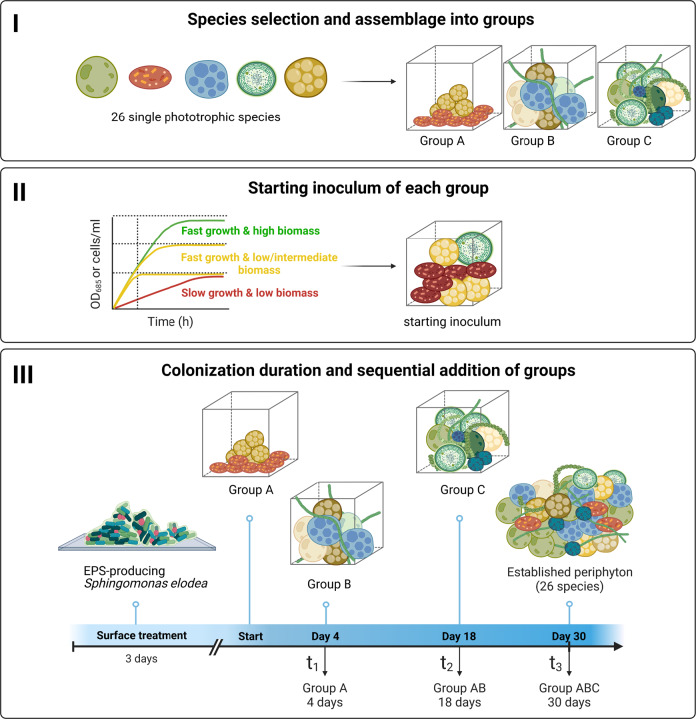
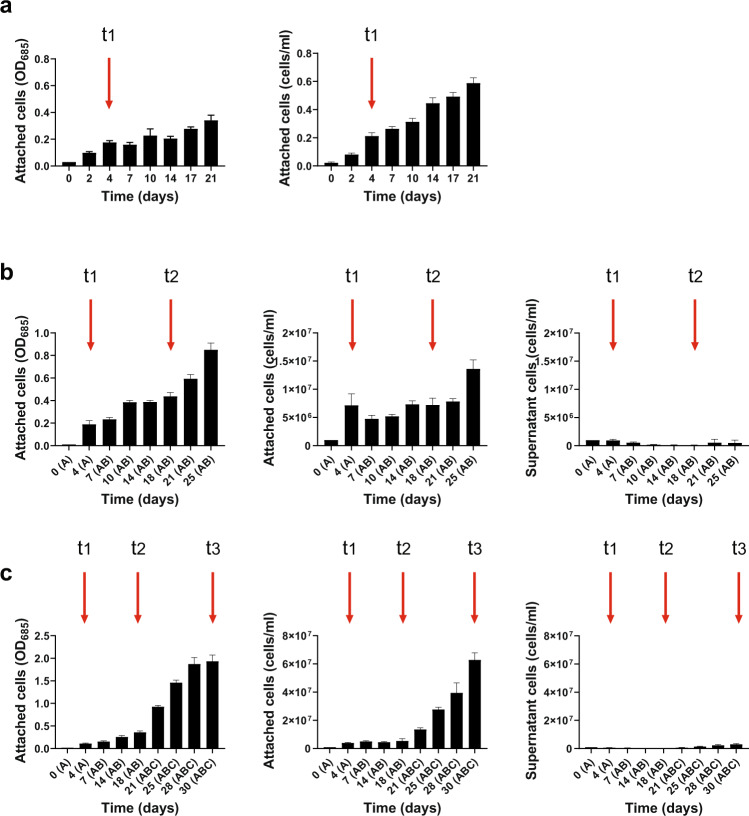
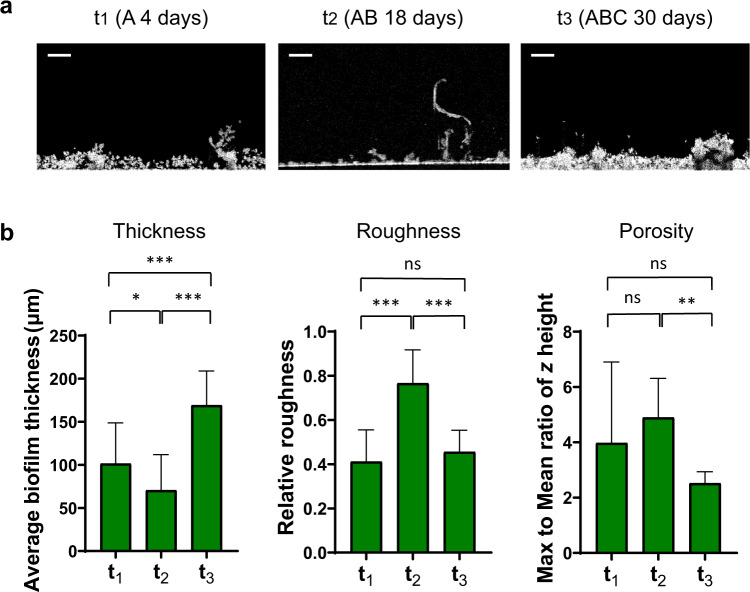
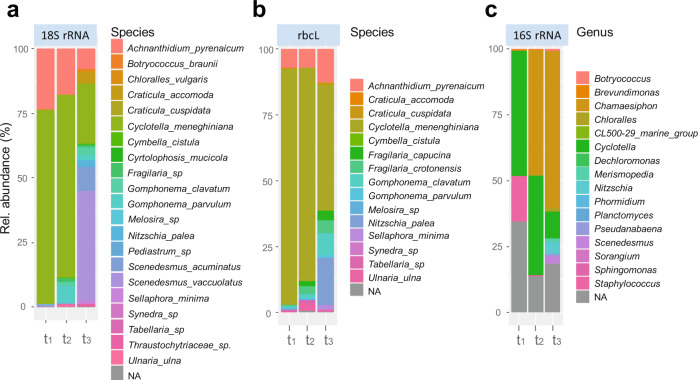
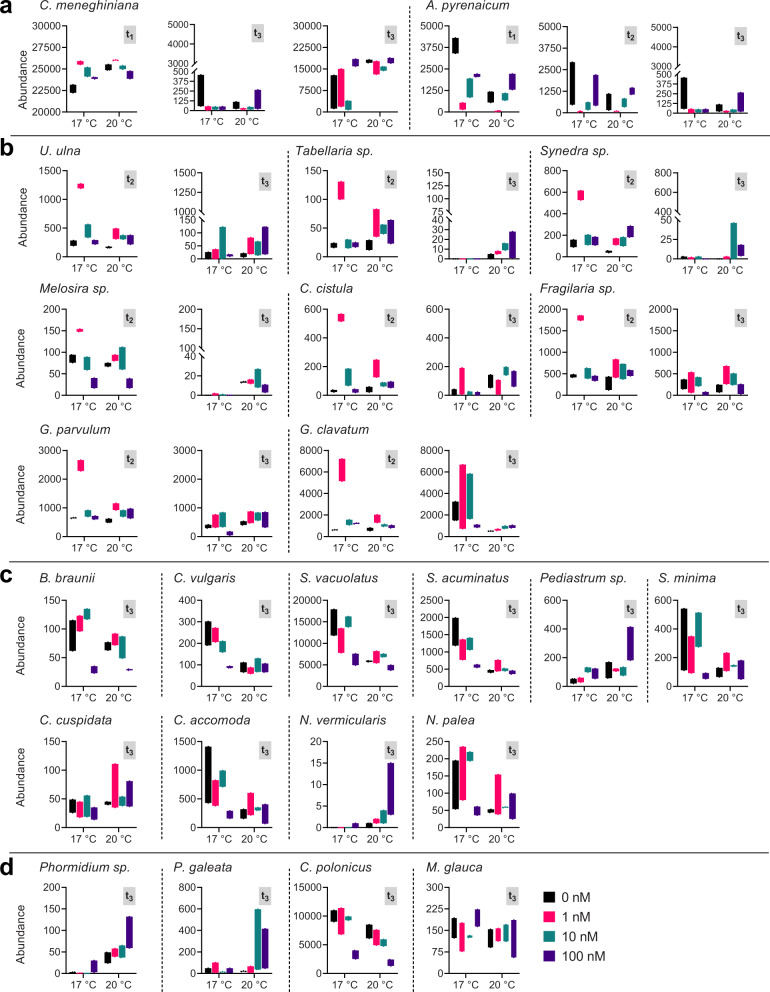
Phototrophic biofilms, also known as periphyton, are microbial freshwater communities that drive crucial ecological processes in streams and lakes. Gaining a deep mechanistic understanding of the biological processes occurring in natural periphyton remains challenging due to the high complexity and variability of such communities. To address this challenge, we rationally developed a workflow to construct a synthetic community by co-culturing 26 phototrophic species (i.e., diatoms, green algae, and cyanobacteria) that were inoculated in a successional sequence to create a periphytic biofilm on glass slides. We show that this community is diverse, stable, and highly reproducible in terms of microbial composition, function, and 3D spatial structure of the biofilm. We also demonstrate the ability to monitor microbial dynamics at the single species level during periphyton development and how their abundances are impacted by stressors such as increased temperature and a herbicide, singly and in combination. Overall, such a synthetic periphyton, grown under controlled conditions, can be used as a model system for theory testing through targeted manipulation.


Conflict of interest statement

The authors declare no competing interests.

Figures

Fig. 1
Fig. 1. Schematic representation of the workflow to establish the synthetic periphyton.
Twenty-six phototrophic microbial species were selected based on their ability to grow under the same conditions and their frequent detection in natural freshwater periphyton. The selected species were then assigned to three groups (I). The cell density in the starting inoculum for each group was determined based on the growth rates and reached maximum biomass of each single species (II). Groups were added sequentially onto growth chambers covered with the EPS-producing bacteria Sphingomonas elodea. Time points for the addition of the groups and colonization durations for each phototrophic group were determined experimentally (III) (Illustration created with BioRender.com).
Fig. 2
Fig. 2. Increase of the benthic biomass during periphyton establishment.
The concentrations (mean ± s.d.; n = 3) of attached and non-attached cells (supernatant) were quantified via optical density (OD) at 685 nm and cell count with a CASY cell counter throughout the periphyton development; separately for the two species of group A (a), then for groups A and AB (upon addition of group B onto group A at 4 days of growth) (b) and for groups A, AB, and ABC (upon addition of group C onto group AB at 18 days of growth) (c). Red vertical arrows indicate selected time points when group B species were added on top of group A (t1), group C on top of group AB (t2), and periphyton was established (t3). Cell concentrations in the supernatant for C. meneghiniana and A. pyrenaicum when grown separately (a) were below the quantification limit; hence no graphics for supernatant is shown.
Fig. 3
Fig. 3. Changes of the periphyton physical structure during its establishment.
Shown are representative OCT images obtained over 30 days of periphyton growth at time points t1 (A 4 days), t2 (AB 18 days), and t3 (ABC 30 days) (a). White pixel: Biomass accumulation, black pixel: absent/low biomass accumulation. Scale bar: 200 µm. Mean thickness, surface topology (relative roughness), and internal porosity (mean to max ratio of z, where z is the height of the biofilm) were determined from 20 to 30 images and 5 biological replicates per time point (b). Error bars represent standard deviations. *P < 0.05, **P < 0.005 ***P < 0.0001, post hoc Tukey test.
Fig. 4
Fig. 4. Genetic composition of the synthetic periphyton at the species level.
Community composition profile and relative abundances (average; n = 9) were inferred from taxonomy-based clustering at species level of assigned 18S rRNA (a) and rbcL (b) gene sequences and at genus level of assigned 16S rRNA (c) at 4 (t1), 18 (t2), and 30 days (t3) during periphyton formation. NA: not assigned species.
Fig. 5
Fig. 5. Abundance of single species during periphyton establishment.
Shown is abundance of group A (a), group B (b), and group C (c) eukaryotic species as well as group C prokaryotic species (d) measured at t1 (A 4 days), t2 (AB 18 days), and t3 (ABC 30 days) and grown under different conditions. The conditions correspond to 4 levels of the herbicide terbuthylazine (0, 1, 10, and 100 nM) and 2 different temperatures (17 and 20 °C). Horizontal lines in the black boxes correspond to the average values and the lower and higher limits of the standard deviation (n = 3). Results of the pairwise comparison (post hoc Tukey test) among all treatments for each species are shown in Supplementary Tables 13–15.

References

    1. Battin TJ, Besemer K, Bengtsson MM, Romani AM, Packmann AI. The ecology and biogeochemistry of stream biofilms. Nat. Rev. Microbiol. 2016;14:251–263. doi: 10.1038/nrmicro.2016.15. - DOI - PubMed
    1. Wetzel, R. G. Periphyton of Freshwater Ecosystems: Proceedings of the First International Workshop on Periphyton of Freshwater Ecosystems, held in Växjö, Sweden, 14–17 September 1982 (1983).
    1. Battin TJ, Kaplan LA, Newbold JD, Hansen CME. Contributions of microbial biofilms to ecosystem processes in stream mesocosms. Nature. 2003;426:439–442. doi: 10.1038/nature02152. - DOI - PubMed
    1. Romani AM, et al. Biofilm structure and function and possible implications for riverine DOC dynamics. Microb. Ecol. 2004;47:316–328. doi: 10.1007/s00248-003-2019-2. - DOI - PubMed
    1. Haack TK, Mcfeters GA. Nutritional relationships among microorganisms in an epilithic biofilm community. Microb. Ecol. 1982;8:115–126. doi: 10.1007/BF02010445. - DOI - PubMed

Publication types