. 2022 Jul 22;12(1):12565.
doi: 10.1038/s41598-022-16462-2.

Thermodynamic basis for the demarcation of Arctic and alpine treelines

Affiliations

Thermodynamic basis for the demarcation of Arctic and alpine treelines

Meredith Richardson Martin et al. Sci Rep. .

Abstract

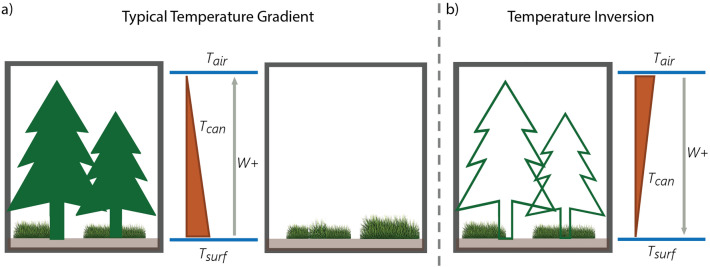
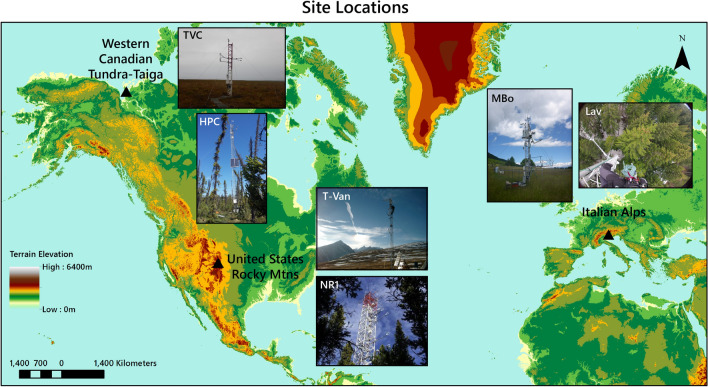
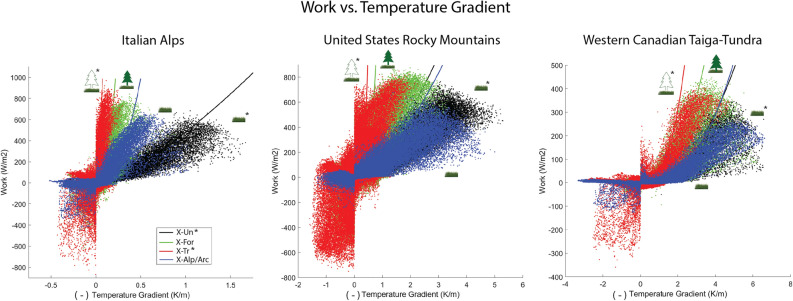
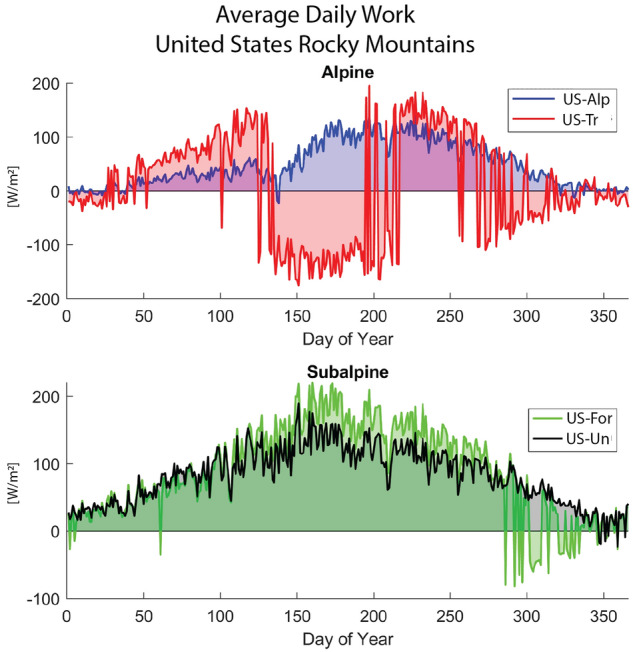
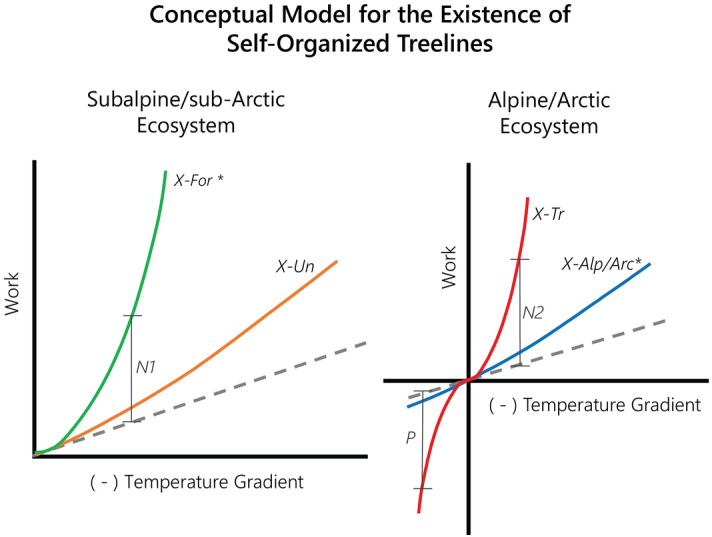
At the edge of alpine and Arctic ecosystems all over the world, a transition zone exists beyond which it is either infeasible or unfavorable for trees to exist, colloquially identified as the treeline. We explore the possibility of a thermodynamic basis behind this demarcation in vegetation by considering ecosystems as open systems driven by thermodynamic advantage-defined by vegetation's ability to dissipate heat from the earth's surface to the air above the canopy. To deduce whether forests would be more thermodynamically advantageous than existing ecosystems beyond treelines, we construct and examine counterfactual scenarios in which trees exist beyond a treeline instead of the existing alpine meadow or Arctic tundra. Meteorological data from the Italian Alps, United States Rocky Mountains, and Western Canadian Taiga-Tundra are used as forcing for model computation of ecosystem work and temperature gradients at sites on both sides of each treeline with and without trees. Model results indicate that the alpine sites do not support trees beyond the treeline, as their presence would result in excessive CO[Formula: see text] loss and extended periods of snowpack due to temperature inversions (i.e., positive temperature gradient from the earth surface to the atmosphere). Further, both Arctic and alpine sites exhibit negative work resulting in positive feedback between vegetation heat dissipation and temperature gradient, thereby extending the duration of temperature inversions. These conditions demonstrate thermodynamic infeasibility associated with the counterfactual scenario of trees existing beyond a treeline. Thus, we conclude that, in addition to resource constraints, a treeline is an outcome of an ecosystem's ability to self-organize towards the most advantageous vegetation structure facilitated by thermodynamic feasibility.


Conflict of interest statement

The authors declare no competing interests.

Figures

Figure 1
Figure 1
Conceptual diagram of temperature gradients. The W+ arrow indicates the positive direction of work performed through heat transport. Although in different directions, in both cases (a) and (b), the work performed is positive because heat moves from high to low temperatures. (a) Typical summertime temperature gradients from the earth surface to the air above the canopy are negative for the two real scenarios: subalpine/sub-Arctic forest (left) and alpine tundra/Arctic meadow (right). (b) A conceptual temperature inversion, or positive temperature gradient, which arise when alpine/Arctic forest are simulated as counterfactuals.
Figure 2
Figure 2
Site locations for the three pairs of sites (Table 1) above and below Arctic and alpine treelines. The background topographic map is generated from NASA space-based elevation data (https://visibleearth.nasa.gov/images/73934/topography#). Fluxtower site images were obtained from the following: TVC & HPC—Oliver Sonnentag (https://atmosbios.com/); T-Van—photo of the Saddle site about 350m along the ridge from T-Van taken by Andy Watt (https://archive.eol.ucar.edu/homes/stephens/RACCOON/NWRsite.html); NR1—Sean Burns, 10/07/2014, (https://ameriflux.lbl.gov/sites/siteinfo/US-NR1); MBo & Lav—Roberto Zampedri, Fondazione Edmund Mach.
Figure 3
Figure 3
The work versus resultant temperature gradient for the three site pairs summarized in Table 1. The negative of the resultant temperature gradient is plotted on the x-axis. Thus, the positive x-axis refers to a negative temperature gradient such that larger values indicate stronger declines in temperature from the earth surface to the atmosphere. The negative x-axis indicates positive temperature gradients, or temperature inversions. Data points represent half-hourly simulation timesteps over the entire study period (Italy, 2 years; United States, 6 years; Canada, 3 years). The starred vegetation scenarios (X-Un* & X-Tr*) indicate counterfactual scenarios. For every region, on the positive x-axis the simulated trees (X-Tr) scenario above the treeline performs the most work for the resultant temperature gradient than the other scenarios when the temperature of the earth surface is warmer than that of the air above the canopy. However, when the resultant temperature gradient is positive (negative x-axis), a temperature inversion occurs (Fig. 1), resulting in the vegetation performing negative work – transporting heat in the opposite direction of the temperature gradient (X-Tr & X-Alp/Arc).
Figure 4
Figure 4
Average daily time series of work for the entire study period (2008–2013) for scenarios in the United States Rocky Mountains. The top panel demonstrates the prolonged negative work (i.e., heat transport in the opposite direction of the temperature gradient) associated with snowmelt and winter temperature inversions of the simulated alpine forest (red; US-Tr), indicating that this counterfactual is thermodynamically infeasible. The existing alpine and subalpine vegetation (blue, US-Alp & green, US-For) generally only experience negative work during snowmelt conditions. The subalpine forest (green; US-For) experiences negative work sporadically for short durations during the winter; these instances are a function of snowmelt as well since the snowpack does not persist throughout the winter at this site (see Fig. 5a).
Figure 5
Figure 5
Feasibility analysis demonstrating annual net loss of CO2flux for the United States Rocky Mountains alpine simulated forest counterfactual scenario due to increased snowpack and shortened growing seasons. (a) 2009 daily timeseries of modeled snow depth (blue) and leaf CO2 flux—the averaged daily photosynthetic CO2 uptake (orange solid line) and above-ground autotrophic respiration (orange dotted line)—for the United States Rocky Mountains scenarios. For the alpine simulated forest, cooler temperatures near the earth’s surface result in faster accumulation of snow and less snowmelt throughout the winter, extending the time needed to melt the snow. Thus, the simulated forest exhibits compounding snow depth and an abbreviated summer season without snowpack, leading to shortened photosynthesis periods compared to the alpine fellfield scenario (top panel). (b) Modeled average annual net leaf CO2 flux over the entire study period (IT, 2 years; CA, 3 years; US, 6 years). Positive flux corresponds to net leaf uptake (i.e., photosynthesis minus above-ground autotrophic respiration). Error bars indicate the range of annual net leaf CO2 flux for all years of the study period. Simulated forests for the two alpine sites (orange; US-Tr & IT-Tr) experience decreases in net CO2 flux compared to the other scenarios. Further, the US-Tr scenario exhibits overall losses in CO2 year to year, creating unsustainable mass balance for biomass productivity and indicating that the counterfactual is infeasible.
Figure 6
Figure 6
Four projected views from the 3-D plot of work, temperature gradient, and total leaf area index (LAI) for the (a) Western Canadian Taiga-Tundra and (b) Italian Alps scenarios. The top panels display that increases in LAI lead to increases in the magnitude of work and smaller resultant temperature gradients. The negative of the resultant temperature gradient is plotted. Thus, positive values refer to negative temperature gradients such that larger values indicate stronger declines in temperature from the earth surface to the atmosphere. Negative values indicate positive temperature gradients, or temperature inversions. The 3-D views in the bottom panels show the transition from flatter curves to greater magnitudes of work with increases in resultant temperature gradient as more LAI is incorporated for each set of environmental conditions (i.e., alpine, subalpine). The simulated alpine/Arctic forest scenarios (red; X-Tr) exhibit considerable negative work performed since the LAI is beyond the supported limit of the local environmental conditions.
Figure 7
Figure 7
Conceptual model for the existence of treelines as a result of self-organization of the thermal environment. Self-organized treelines are demonstrated through the balance of positive or negative feedback between the resulting temperature gradient and the work performed by various vegetation structures. The negative of the resultant temperature gradient is plotted on the x-axis. Thus, the positive x-axis refers to a negative temperature gradient such that larger values indicate stronger declines in temperature from the earth surface to the atmosphere. The negative x-axis indicates positive temperature gradients, or temperature inversions. The dotted line represents an ecosystem without vegetation (i.e., bare soil). The colored solid lines represent vegetation curves as defined in Table 1. Dissipation rates leading to negative (N1 or N2) or positive (P) feedback loops between temperature gradient and vegetation structure are shown as the vertical distance from the bare soil curve to the vegetation scenarios. The starred scenario on each plot represents the most advantageous viable vegetation structure for the given ecosystem. The plot on the left represents ecosystems in which both vegetation scenarios (X-For & X-Un) are viable options, and the X-For scenario is most advantageous. The plot on the right represents ecosystems in which one of the vegetation scenarios (X-Tr) is infeasible due to positive feedback loops that result in continued dissipation of heat during temperature inversions. Instead, the X-Alp/Arc scenario is the most advantageous viable vegetation structure.

Similar articles

Cited by

References

    1. Richardson AD, Friedland AJ. A review of the theories to explain arctic and alpine treelines around the world. J. Sustain. For. 2009;28:218–242. doi: 10.1080/10549810802626456. - DOI
    1. Callaghan, T. V., Werkman, B. R. & Crawford, R. M. M. The tundra-taiga interface and its dynamics: concepts and applications. Ambio. Special Report Number 12, 6–14. http://www.jstor.org/stable/25094570 (Springer, 2002). - PubMed
    1. Holtmeier F-K, Broll G. Treeline research-from the roots of the past to present time. A review. Forests. 2020;11:38. doi: 10.3390/f11010038. - DOI
    1. Wardle P. An explanation for alpine timberline. N. Z. J. Bot. 1971;9:371–402. doi: 10.1080/0028825X.1971.10430192. - DOI
    1. Shi P, Körner C, Hoch G. A test of the growth-limitation theory for alpine tree line formation in evergreen and deciduous taxa of the eastern Himalayas. Funct. Ecol. 2008;22:213–220. doi: 10.1111/j.1365-2435.2007.01370.x. - DOI

Publication types