

Assessing the effect of urbanization on regional-scale surface water-groundwater interaction and nitrate transport
- PMID: 35869141
- PMCID: PMC9307516
- DOI: 10.1038/s41598-022-16134-1
Assessing the effect of urbanization on regional-scale surface water-groundwater interaction and nitrate transport
Abstract
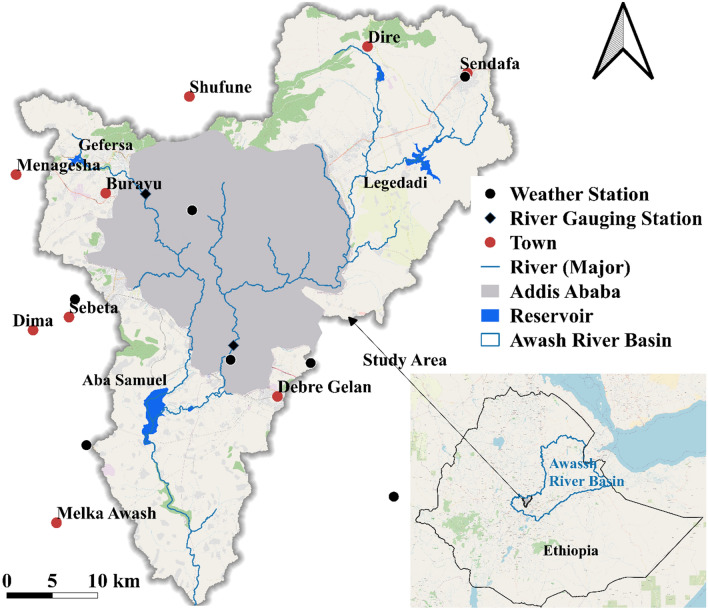
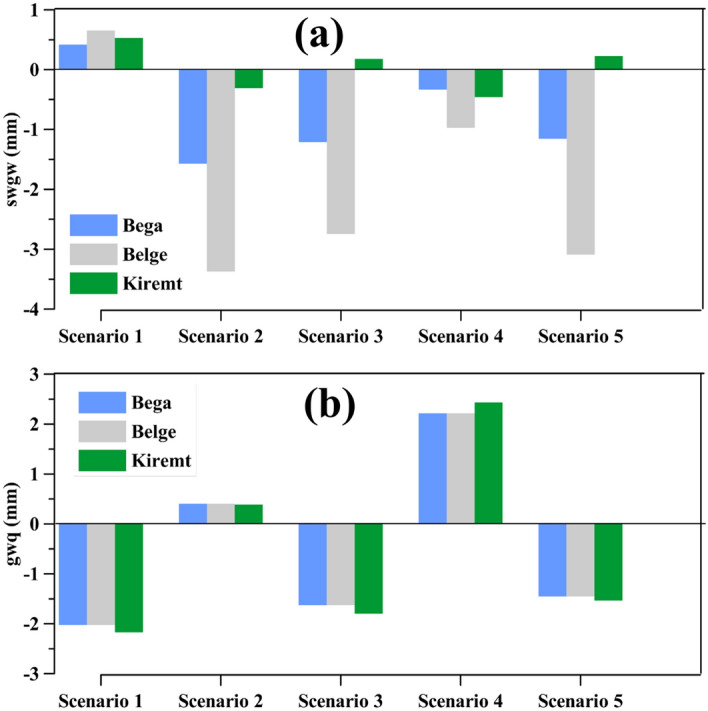
Identifying regional-scale surface water-groundwater interactions (SGI) is vital for predicting anthropogenic effects on surface water bodies and underlying aquifers. However, large-scale water and nutrient flux studies rely on surface water or groundwater-focused models. This study aims to model the effect of urbanization, which is usually accompanied by high groundwater abstraction and surface water pollution, particularly in the developing world, on a regional-scale SGI and nitrate loading. In the study area, the urban expansion increased by over 3% in the last decade. The integrated SWAT-MODFLOW model, Soil and Water Assessment Tool (SWAT) and Modular Finite-Difference Groundwater Flow (MODFLOW) coupling code, was used to assess SGI. By coupling SWAT-MODFLOW with Reactive Transport in 3-Dimensions, the nutrient loading to the river from point and non-point sources was also modeled. Basin average annual results show that groundwater discharge declined with increasing groundwater abstraction and increased with Land use/Land cover (LULC) changes. Groundwater recharge decreased significantly in the Belge season (February to May), and the river seepage and groundwater discharge decreased correspondingly. High spatiotemporal changes in SGI and nitrate loading were found under the combined LULC and groundwater abstraction scenarios. The water yield decreased by 15%. In a large part of the region, the nitrate loading increased by 17-250%. Seasonally controlled groundwater abstraction and water quality monitoring are essential in this region.
© 2022. The Author(s).
Conflict of interest statement
The authors declare no competing interests.
Figures


Similar articles
-
Modeling hydrology, groundwater recharge and non-point nitrate loadings in the Himalayan Upper Yamuna basin.Sci Total Environ. 2013 Dec 1;468-469 Suppl:S102-16. doi: 10.1016/j.scitotenv.2013.01.022. Epub 2013 Feb 26. Sci Total Environ. 2013. PMID: 23452999
-
Patterns of nitrate load variability under surface water-groundwater interactions in agriculturally intensive valley watersheds.Water Res. 2024 Dec 1;267:122474. doi: 10.1016/j.watres.2024.122474. Epub 2024 Sep 19. Water Res. 2024. PMID: 39316961
-
Spatio-temporal variations of shallow and deep well groundwater nitrate concentrations along the Indus River floodplain aquifer in Pakistan.Environ Pollut. 2019 Oct;253:384-392. doi: 10.1016/j.envpol.2019.07.019. Epub 2019 Jul 5. Environ Pollut. 2019. PMID: 31325883
-
Sources, pathways, and relative risks of contaminants in surface water and groundwater: a perspective prepared for the Walkerton inquiry.J Toxicol Environ Health A. 2002 Jan 11;65(1):1-142. doi: 10.1080/152873902753338572. J Toxicol Environ Health A. 2002. PMID: 11809004 Review.
-
Mapping the optimization of groundwater abstraction research: A bibliometric review in the context of South Asian region.Heliyon. 2023 Jun 21;9(6):e17528. doi: 10.1016/j.heliyon.2023.e17528. eCollection 2023 Jun. Heliyon. 2023. PMID: 37416645 Free PMC article. Review.
References
-
- Hibbs BJ. Groundwater in urban areas. J. Contempor. Water Res. Educ. 2016;159:1–4. doi: 10.1111/j.1936-704X.2016.03226.x. - DOI
-
- Sharp JM. The impacts of urbanization on groundwater systems and recharge. Aquamundi. 2010;1:51–56.
-
- Fletcher TD, Andrieu H, Hamel P. Understanding, management and modelling of urban hydrology and its consequences for receiving waters: A state of the art. Adv. Water Resour. 2013;51:261–279. doi: 10.1016/j.advwatres.2012.09.001. - DOI
Publication types
MeSH terms
Substances
LinkOut - more resources
Full Text Sources
