. 2022 Jul 22;12(1):12592.
doi: 10.1038/s41598-022-16643-z.

Face mediated human-robot interaction for remote medical examination

Affiliations

Face mediated human-robot interaction for remote medical examination

Thilina D Lalitharatne et al. Sci Rep. .

Abstract

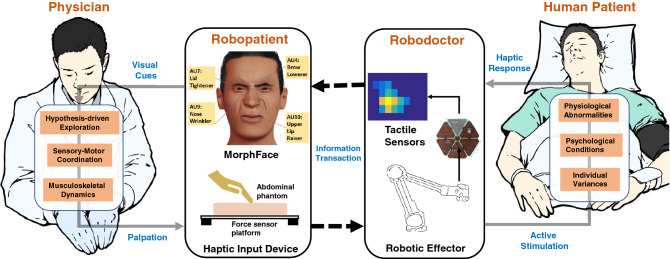
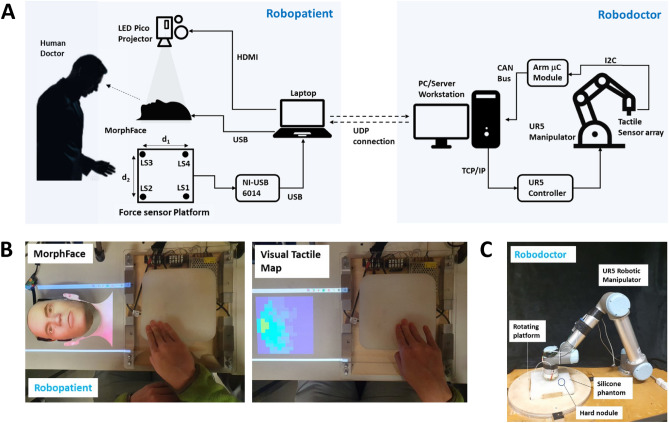
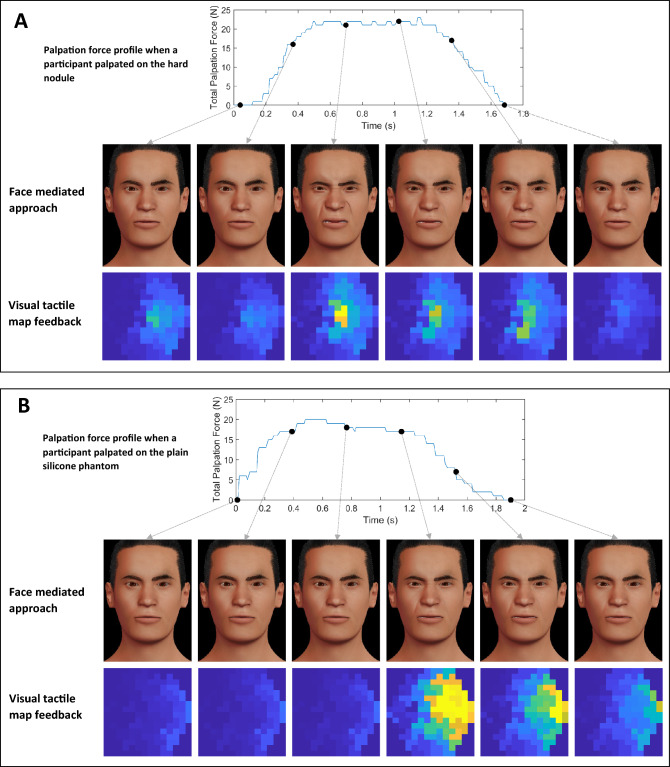
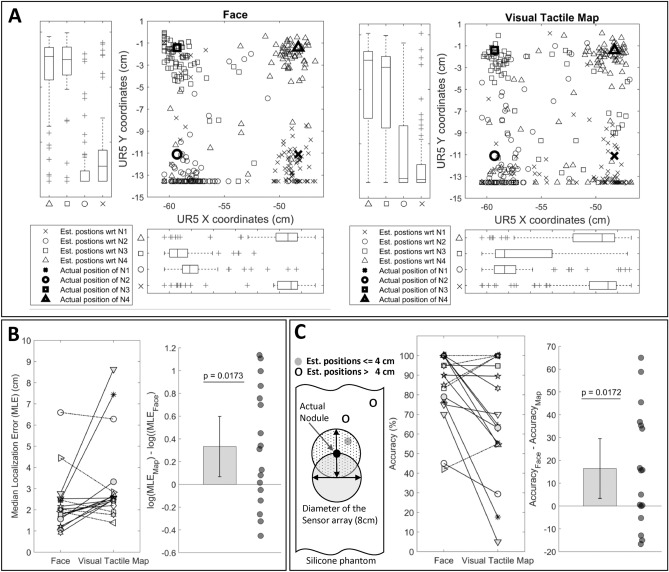
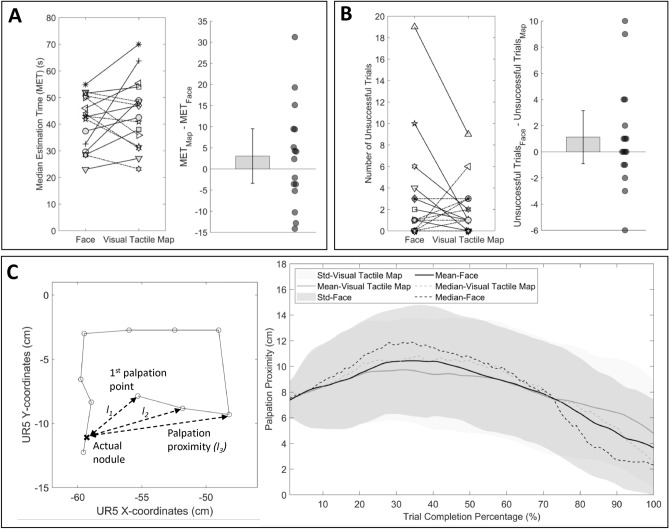
Realtime visual feedback from consequences of actions is useful for future safety-critical human-robot interaction applications such as remote physical examination of patients. Given multiple formats to present visual feedback, using face as feedback for mediating human-robot interaction in remote examination remains understudied. Here we describe a face mediated human-robot interaction approach for remote palpation. It builds upon a robodoctor-robopatient platform where user can palpate on the robopatient to remotely control the robodoctor to diagnose a patient. A tactile sensor array mounted on the end effector of the robodoctor measures the haptic response of the patient under diagnosis and transfers it to the robopatient to render pain facial expressions in response to palpation forces. We compare this approach against a direct presentation of tactile sensor data in a visual tactile map. As feedback, the former has the advantage of recruiting advanced human capabilities to decode expressions on a human face whereas the later has the advantage of being able to present details such as intensity and spatial information of palpation. In a user study, we compare these two approaches in a teleoperated palpation task to find the hard nodule embedded in the remote abdominal phantom. We show that the face mediated human-robot interaction approach leads to statistically significant improvements in localizing the hard nodule without compromising the nodule position estimation time. We highlight the inherent power of facial expressions as communicative signals to enhance the utility and effectiveness of human-robot interaction in remote medical examinations.


Conflict of interest statement

The authors declare no competing interests.

Figures

Figure 1
Figure 1
Face mediated human–robot interaction approach for remote palpation. The system consists of four main subsystems: a physician, a robopatient, a robodoctor, and a human patient. The human patient under examination may have various physiological abnormalities, psychological conditions, and individual characteristics that vary these factors. To diagnose the conditions of the human patient remotely, the physician at the local site interacts with the roboatient via a haptic input device which consists of a force sensor platform and an abdominal phantom. The acquired haptic information is then transferred to the robodoctor that stimulates the human patient using a robotic effector. The active stimulation provided by the robotic effector causes the patient to generate haptic responses which are measured by the tactile sensors mounted on the robotic effector. High-dimensional tactile information acquired by the robotdoctor is then transferred to the robotpatient where the high-dimensional information is encoded into a low-dimensional representation by synthesizing facial expressions using our hybrid morphable robotic face: MorphFace. Four facial Action Units (AUs) namely, AU4: Brow Lowerer, AU7: Lid Tightener, AU9: Nose Wrinkler, AU10: Upper Lip Raiser (based on Ekmans facial action coding system (FACS)), are used to synthesize the pain facial expressions. To complete the loop, the physician perceives the visual facial expression cues generated by the MorphFace and adjusts their palpation behavior according to their internal model of what the facial expressions represent given the context. The internal model of the physician is typically based on factors such as hypothesis-driven exploration, sensory-motor coordination, and musculoskeletal dynamics.
Figure 2
Figure 2
Overall system diagram and how the participants saw the two types of feedback during the experiment. (A) complete system diagram of the robopatient–robodoctor platform for remote palpation (B) Left shows how a participant sees the robopatient face during face mediated approach experiment. (B) Right shows How the visual tactile map would look like during the experiment. (C) The robodoctor site consists of a UR5 robotic manipulator, a rotating platform, and a silicone phantom with an embedded hard nodule.
Figure 3
Figure 3
How pain facial expressions of the MorphFace in face mediated approach and corresponding visual tactile map feedback varies for different palpation forces. (A) top plot shows the palpation force profile when a participant palpated on the hard nodule and corresponding pain expressions rendered on the Morphface and respective tactile information displayed as the visual tactile map. (B) depicts the same information as in (A) but when a participant palpated on the plain silicon phantom. MATLAB 2020a (https://www.mathworks.com) is used to generate the images.
Figure 4
Figure 4
Exploration strategy used by one participant to estimate the location of a hard nodule in two feedback conditions. Left: when presented with face mediated approach; Right: when presented with visual tactile map feedback. Actual location of the hard nodule in respective trials is marked as a cross. Each filled scatter circle represents a palpation point and lines show the palpation path from start to end. Palpation points are color-coded according to the trial completion percentage (see color bar on right). MATLAB 2020a (https://www.mathworks.com) is used to generate the plots.
Figure 5
Figure 5
Estimated nodule positions, localization error and accuracy results for all participants (A) Estimated nodule positions by all participants during all successful trials (i.e., trials where the participant estimated the nodule position before 90 s) for each experiment. Box plots show the distributions of estimated nodule positions relative to actual nodule positions. (B) Left shows the paired plot for distribution of median localization error of successful trials of all participants. Each symbol represents an individual participant. (B) Right shows the log transformed distribution of the differences between the median localization error together with all data presented as a scatter plot. Thin black line represents the 95-confidence interval of the estimated mean difference. The p-value of the one-sample t-test (t16=2.6541,p=0.0173) is shown above the plot. (C) Left we classified estimated nodule positions as accurate if they fell within the radius of 4 cm (as illustrates in the sketch) given that the diameter of the tactile sensor array was 8cm. Based on this notion. (C) Center shows the paired plot of accuracy for all participants between the two feedback methods. Each symbol represents an individual participant. (C) Right shows the difference of accuracy between face mediated approach and visual tactile map feedback together with all data presented as a scatter plot. Thin black line represents the 95-confidence interval. The p-value of the one-sample t-test (t16=2.6565,p=0.0172) is shown above the plot. MATLAB 2020a (https://www.mathworks.com) is used to generate the plots.
Figure 6
Figure 6
Results of nodule estimation time, number of unsuccessful trials and palpation proximity for all participants. (A) Left shows the paired plot of the distribution of median estimation time of successful trials of all participants. Each symbol represents an individual participant. (A) Right shows the distribution of the differences between medians of estimation time together with all data presented as a scatter plot. Thin black line represents the 95-confidence interval. (B) Left shows the paired plot of the distribution of the number of unsuccessful trials of all participants. Each symbol represents an individual participant. (B) Right shows the distribution of the differences between the number of unsuccessful trials of two feedback formats as a scatter plot. The thin black line represents the 95-confidence interval. (C) Left illustrates an example recorded palpation exploration profile from one trial performed by a participant. We defined palpation proximity as the length between current palpation point and the actual nodule position on a given trial. (C) Right average proximity from the actual nodule position is plotted against the proportion of trials completed. MATLAB 2020a (https://www.mathworks.com) is used to generate the plots.

References

    1. Birdwhistell RL. Kinesics and Context: Essays on Body Motion Communication. Allen Lane The Penguin Press; 1971.
    1. Mitchell A, Drake R, Vogl A. Gray’s Anatomy for Students. 3. Elsevier; 2015.
    1. Craig KD, Patrick CJ. Facial expression during induced pain. J. Pers. Soc. Psychol. 1985;48:1080. doi: 10.1037/0022-3514.48.4.1089. - DOI - PubMed
    1. Jack R, Schyns P. The human face as a dynamic tool for social communication. Curr. Biol. 2015;25:R621–R634. doi: 10.1016/j.cub.2015.05.052. - DOI - PubMed
    1. Liang Y, et al. Decoding facial expressions based on face-selective and motion-sensitive areas: Decoding facial expressions. Hum. Brain Mapp. 2017;38:23578. doi: 10.1002/hbm.23578. - DOI - PMC - PubMed

Publication types