. 2022 Jul 22;5(1):725.
doi: 10.1038/s42003-022-03681-6.

Immunometabolic and potential tumor-promoting changes in 3D cervical cell models infected with bacterial vaginosis-associated bacteria

Affiliations

Immunometabolic and potential tumor-promoting changes in 3D cervical cell models infected with bacterial vaginosis-associated bacteria

Jason D Maarsingh et al. Commun Biol. .

Abstract

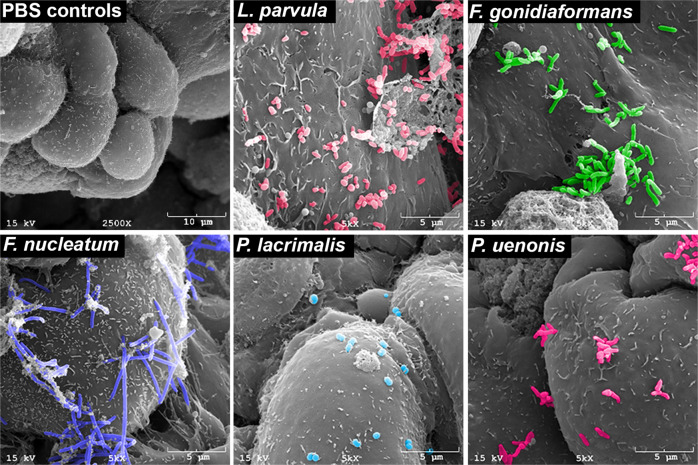
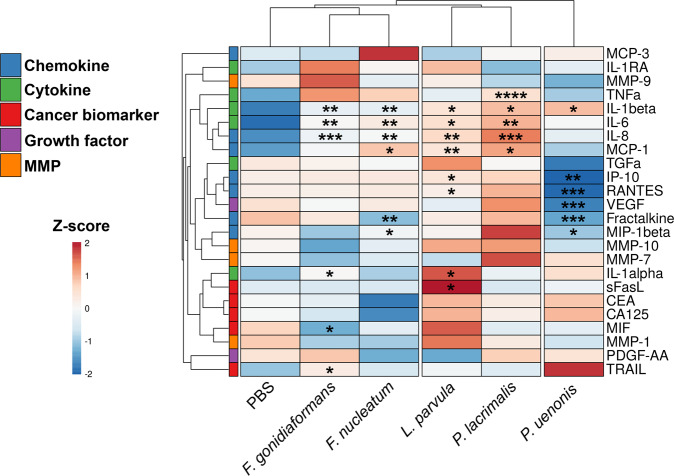
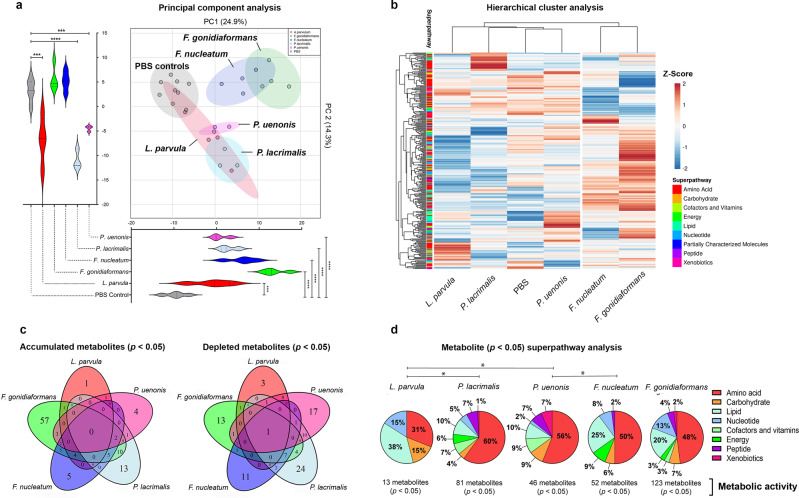
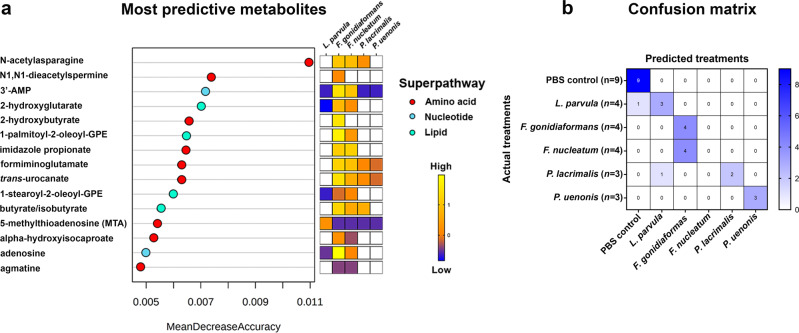
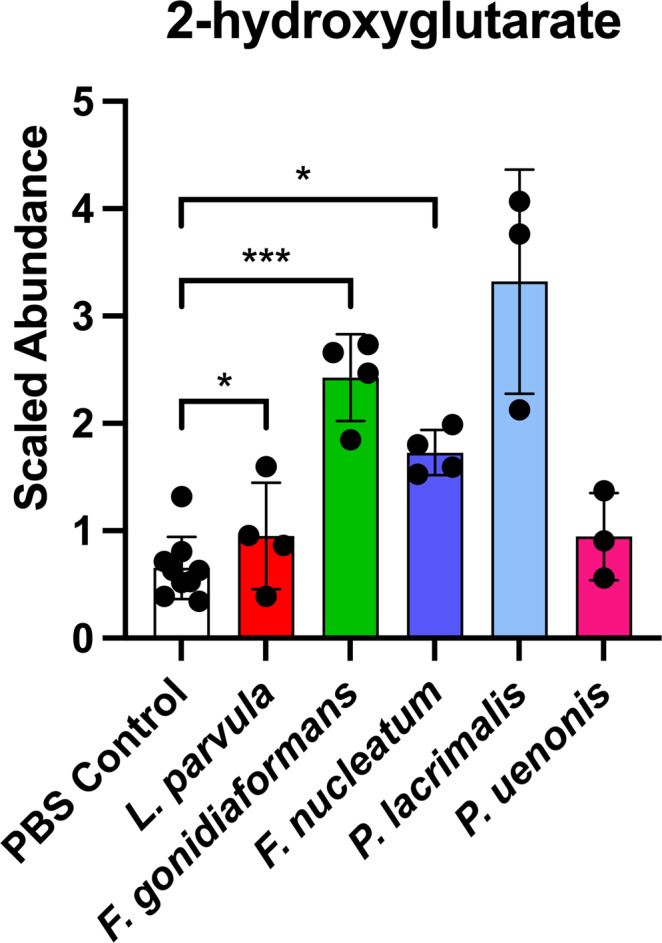
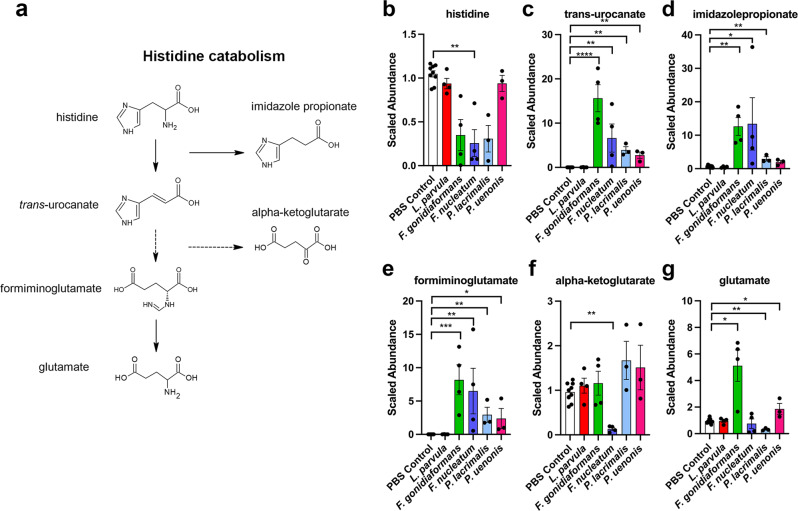
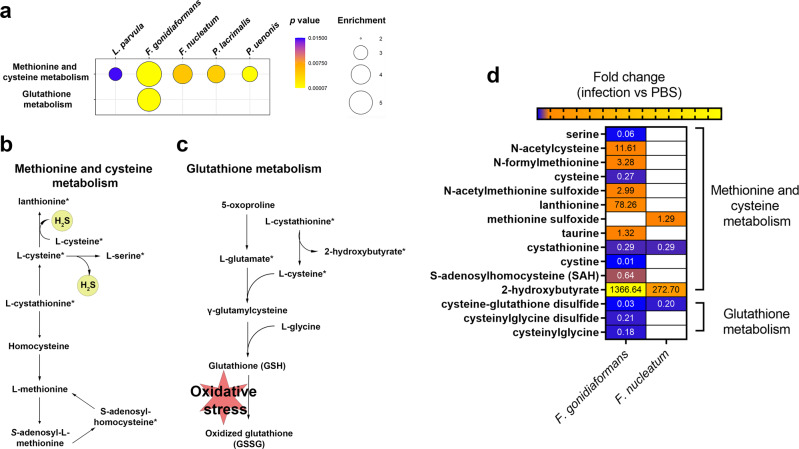
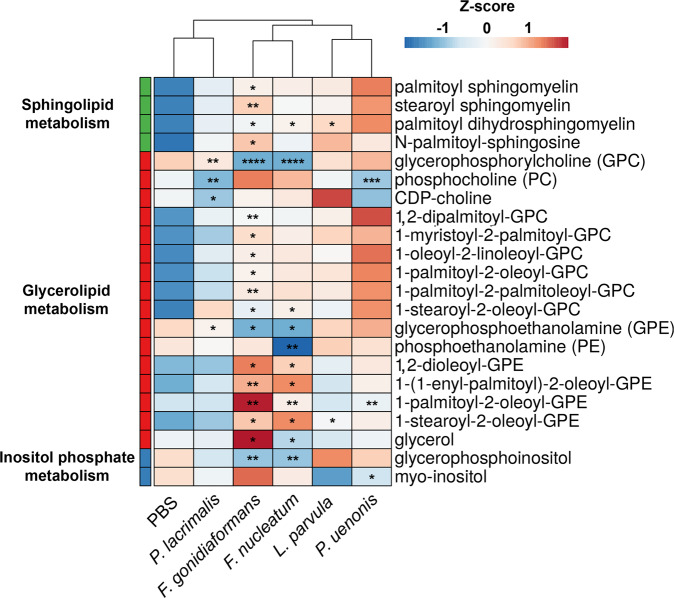
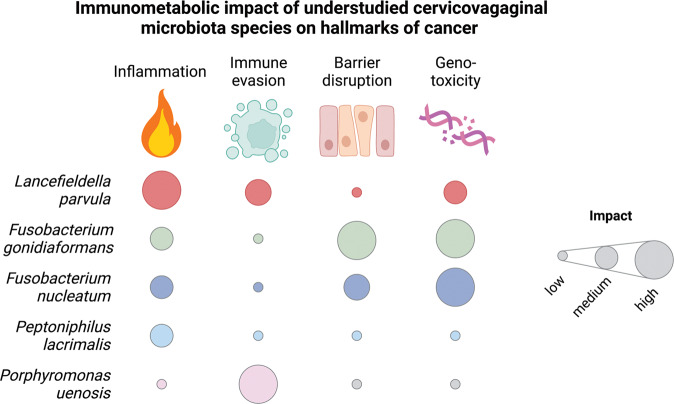
Specific bacteria of the human microbiome influence carcinogenesis at diverse anatomical sites. Bacterial vaginosis (BV) is the most common vaginal disorder in premenopausal women that is associated with gynecologic sequelae, including cervical cancer. BV-associated microorganisms, such as Fusobacterium, Lancefieldella, Peptoniphilus, and Porphyromonas have been associated with gynecologic and other cancers, though the pro-oncogenic mechanisms employed by these bacteria are poorly understood. Here, we integrated a multi-omics approach with our three-dimensional (3-D) cervical epithelial cell culture model to investigate how understudied BV-associated bacteria linked to gynecologic neoplasia influence hallmarks of cancer in vitro. Lancefieldella parvulum and Peptoniphilus lacrimalis elicited robust proinflammatory responses in 3-D cervical cells. Fusobacterium nucleatum and Fusobacterium gonidiaformans modulated metabolic hallmarks of cancer corresponding to accumulation of 2-hydroxyglutarate, pro-inflammatory lipids, and signs of oxidative stress and genotoxic hydrogen sulfide. This study provides mechanistic insights into how gynecologic cancer-associated bacteria might facilitate a tumor-promoting microenvironment in the human cervix.


Conflict of interest statement

The authors declare no competing interests.

Figures

Fig. 1
Fig. 1. BVAB colonize 3-D cervical cells.
Mock-infected 3-D cervical cells (upper left) demonstrating cobblestone appearance and apical polarity. L. parvula (upper middle) forms small coccobacilli clusters and colonize healthy cells, as well as necrotic cell material (upper right corner of the micrograph). F. gonidiaformans (upper right) colonizes the smooth face of 3-D cervical cells in clusters. F. nucleatum (lower left) forms long, filamentous, rugged rod structures that broadly colonize 3-D cervical cells. P. lacrimalis (bottom middle) colonizes 3-D cervical cells mostly as pairs or isolated cocci. P. uenonis (lower right) appears as short bacilli that colonize the surface and crevices of 3-D cervical cells, often in small clusters. All bacteria were processed in PBS and adjusted to an optical density at 600 nm (OD600) of 5.0. Human 3-D cervical cells were infected with bacterial suspensions (20 μl per 1 × 105 epithelial cells) for 4 h under anaerobic conditions and processed for SEM analysis.
Fig. 2
Fig. 2. P. lacrimalis and L. parvula elicits 3-D cervical cell pro-inflammatory responses while P. uenonis dampens the chemotactic response, possibly to evade immune clearance.
Heatmaps displaying relative concentrations of 3-D human cervical cell secretion profiles of cytokines, chemokines, growth factors, cancer biomarkers, and matrix metalloproteinases. Hierarchical clustering of immunoproteomic targets (rows) and treatments (columns) were calculated using Euclidean distance measures and average linkage clustering algorithms. The data were log-transformed and autoscaled prior to clustering. *p < 0.05; **p < 0.01; ***p < 0.001; ****p < 0.0001; unpaired two-tailed Student’s t-test (infection vs. mock-infected controls). All bacteria were processed in PBS and adjusted to an optical density at 600 nm (OD600) of 0.5. Human 3-D cervical cells were infected with bacterial suspensions (20 μl per 1 × 105 epithelial cells) for 24 h under anaerobic conditions. A minimum of n = 3 independent replicates were performed and measured for each condition with two technical replicates measured within each condition. Cell culture supernatants were used for Bio-Plex analysis.
Fig. 3
Fig. 3. BV-associated bacteria (BVAB) induce distinct metabolomic profiles from mock-infected controls and immunomodulatory signatures of lipids and amino acids.
a Principal component analysis (PCA) demonstrates that F. nucleatum and F. gonidiaformans induce similar and partially overlapping metabolic profiles that cluster separately from mock-infected controls. PC1 and PC2 scores were analyzed by unpaired two-tailed Student’s t-tests. ***p < 0.001; ****p < 0.0001. b Hierarchical cluster analysis (HCA) of metabolite Z-scores from 3-D cervical cells infected with BVAB and mock-infected controls. HCA was performed using Euclidean distance and average linkage clustering on both rows (metabolites) and columns (treatments). c Venn diagrams indicating the number of unique or overlapping significantly (p < 0.05) accumulated or depleted metabolites (infection vs. mock-infected controls). d Pie charts represent the percent of significantly different (p < 0.05) metabolites (infection vs. mock-infected controls) relative to all metabolites in the superpathway (right). *p < 0.05; Chi-squared (χ2) analysis. Infection with BVAB induces global changes in metabolites corresponding to amino acid and lipid superpathways. All bacteria were processed in PBS and adjusted to an optical density at 600 nm (OD600) of 0.5. Human 3-D cervical cells were infected with bacterial suspensions (20 μl per 1 × 105 epithelial cells) for 24 h under anaerobic conditions. A minimum of n = 3 independent replicates were performed and measured for each condition. Cell culture supernatants were used for global metabolomics analysis.
Fig. 4
Fig. 4. Random Forest classification identifies metabolites within amino acid, nucleotide, and lipid superpathways that discriminate infections with BV-associated bacteria in 3-D cervical cells.
a Metabolites most predictive of infection with L. parvula, F. gonidiaformans, F. nucleatum, P. lacrimalis, and P. uenonis include acetylated amino acid derivatives (N-acetylasparagine and N1,N1-diacetylspermine), histidine catabolites (imidazole propionate, formiminoglutamate, and trans-urocanate), adenosine derivatives (3’-AMP and adenosine), glycerophospholipids (1-palmitoyl-2-oleyol-GPE and 1-stearoyl-2-oleoyl-GPE), oncometabolite (2-hydroxyglutarate), polyamines (MTA and agmatine), and short-chain fatty acids (2-hydroxybutyrate, butyrate/isobutyrate, and alpha-hydroxyisocaproate). Only significantly different metabolites (infection vs. mock-infected controls) are colored in the heat map. b Random Forest confusion matrix. Individual cells are labeled according to how the algorithm predicted each treatment. Uninfected mock controls and infection with F. gonidiaformans, F. nucleatum, and P. uenonis were perfectly predicted. The number of replicates (n) included for each treatment are indicated in parentheses on the vertical axis labels.
Fig. 5
Fig. 5. Extracellular supernatants of 3-D cervical cells infected with L. parvula, F. gonidiaformans, and F. nucleatum infections accumulate the oncometabolite, 2-hydroxyglutarate.
Scaled metabolite abundances of 2-hydroxyglutarate after 24 h infection with BVAB. *p < 0.05; ***p < 0.001. Student’s two-tailed paired t-tests. Error bars represent standard deviation. A minimum of n = 3 independent replicates were performed and measured for each condition.
Fig. 6
Fig. 6. BVAB modulates metabolic profiles corresponding to histidine degradation.
a Select metabolites of the histidine degradation pathway (KEGG, M00045) corresponding to significantly accumulated or depleted metabolites in the graphs on the right. Graphs represent scaled metabolite abundances of b histidine, c trans-urocanate, d imidazole propionate, e formiminoglutmate, f alpha-ketoglutarate, and g glutamate. *p < 0.05; **p < 0.01; ***p < 0.001; ****p < 0.0001. Two-tailed paired Student’s t-tests (infection vs. mock-infected controls). Box and whiskers bars show median and error bars represent standard error. A minimum of n = 3 independent replicates were performed and measured for each condition.
Fig. 7
Fig. 7. Fusobacterium spp. modulate metabolites associated with hydrogen sulfide production and oxidative stress.
a Bubble plots representing enrichment of methionine and cysteine metabolism and glutathione metabolism from metabolomics data derived from 3-D cervical cells infected with BVAB. Bubble sizes are proportional to the enrichment factor and bubble colors indicate significance. b Methionine and cysteine metabolic pathway depicting hydrogen sulfide production (yellow circles). c Glutathione metabolic pathway that participates in the oxidative stress response. Asterisks next to metabolites are also represented in the heatmap. d Heatmap representing statistically different (p < 0.05) metabolites corresponding to methionine and cysteine metabolism and glutathione metabolism that were differentially accumulated (orange and yellow shading) or depleted (blue shading) during infection with Fusobacterium species. Fold change difference between infection with and mock-infected controls are indicated as numerical values within the heat map cells. A minimum of n = 3 independent replicates were performed and measured for each condition.
Fig. 8
Fig. 8. Fusobacterium spp. modulate glycerolipid and sphingolipid metabolism during 3-D cervical cell infection.
Heatmap of extracellular sphingolipids, glycerolipids, and inositol phosphate metabolites differentially regulated by infection with BVAB. Metabolite intensity values were log-transformed, autoscaled, and row-centered prior to hierarchical clustering analysis using Euclidean distance measures and average linkage clustering algorithms. Asterisks indicate statistically different metabolites between infectious treatments and mock-infected controls. Only lipid species significantly different between at least on BVAB species and mock-infected controls are shown. *p < 0.05; **p < 0.01; ***p < 0.001; ****p < 0.0001. Two-tailed paired Student’s t-tests. A minimum of n = 3 independent replicates were performed and measured for each condition.
Fig. 9
Fig. 9. Summary of hallmarks of cancer influenced by BVAB associated with cancer.
Heatmap depicts the relative impact that each bacterial species contributes to the putative pro-tumorigenic microenvironment based on our 3-D cervical cell model. Heatmap colors were assigned based on standardized levels of significantly (p < 0.05) modulated immunoproteomic and metabolomic biomarkers related to the hallmarks of cancer such as inflammation, avoiding immune destruction, barrier disruption, and genomic instability.

Similar articles

Cited by

References

    1. Polk DB, Peek RM. Helicobacter Pylori: gastric cancer and beyond (vol 10, pg 403, 2010) Nat. Rev. Cancer. 2010;10:593–593. doi: 10.1038/nrc2903. - DOI - PMC - PubMed
    1. Brennan CA, Garrett WS. Fusobacterium nucleatum - symbiont, opportunist and oncobacterium. Nat. Rev. Microbiol. 2019;17:156–166. doi: 10.1038/s41579-018-0129-6. - DOI - PMC - PubMed
    1. Mao S, et al. Intrinsic apoptotic pathways of gingival epithelial cells modulated by Porphyromonas gingivalis. Cell. Microbiol. 2007;9:1997–2007. doi: 10.1111/j.1462-5822.2007.00931.x. - DOI - PMC - PubMed
    1. Kuboniwa M, et al. P. gingivalis accelerates gingival epithelial cell progression through the cell cycle. Microbes Infect. 2008;10:122–128. doi: 10.1016/j.micinf.2007.10.011. - DOI - PMC - PubMed
    1. Helmink BA, Khan MAW, Hermann A, Gopalakrishnan V, Wargo JA. The microbiome, cancer, and cancer therapy. Nat. Med. 2019;25:377–388. doi: 10.1038/s41591-019-0377-7. - DOI - PubMed

Publication types

MeSH terms