. 2022 Jul 22;12(1):12543.
doi: 10.1038/s41598-022-16628-y.

Social isolation during the COVID-19 pandemic in Spain: a population study

Affiliations

Social isolation during the COVID-19 pandemic in Spain: a population study

Marina Martínez-Garcia et al. Sci Rep. .

Abstract

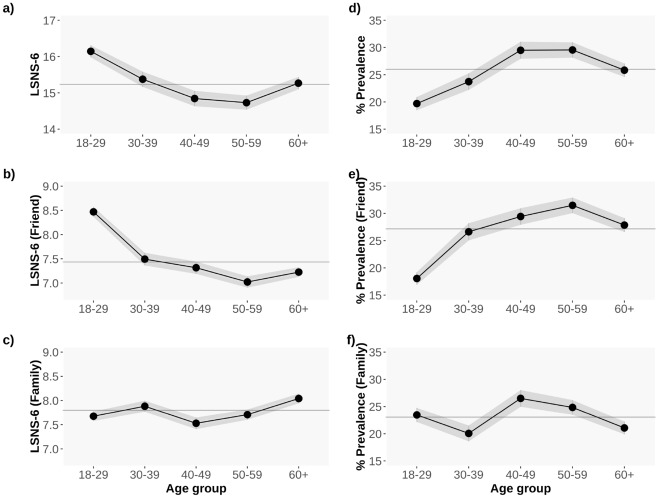
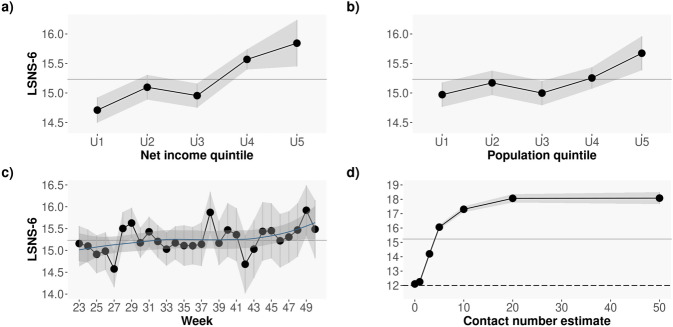
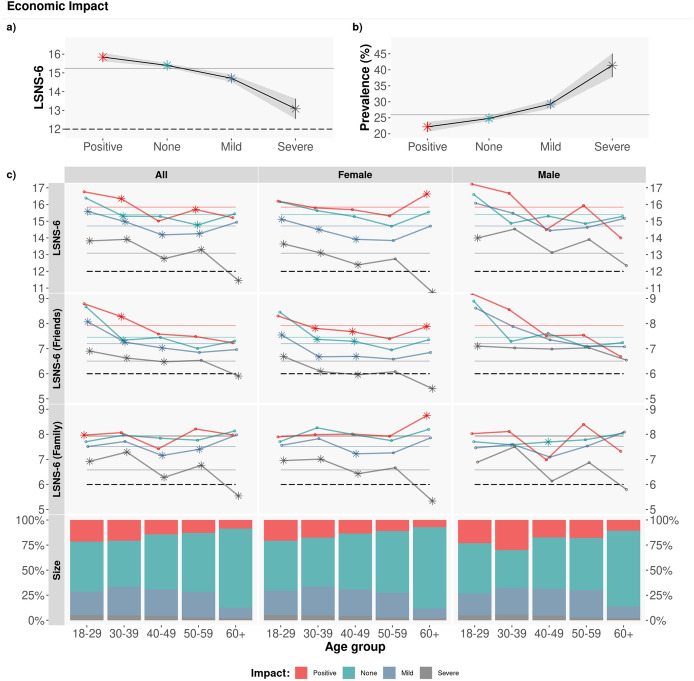
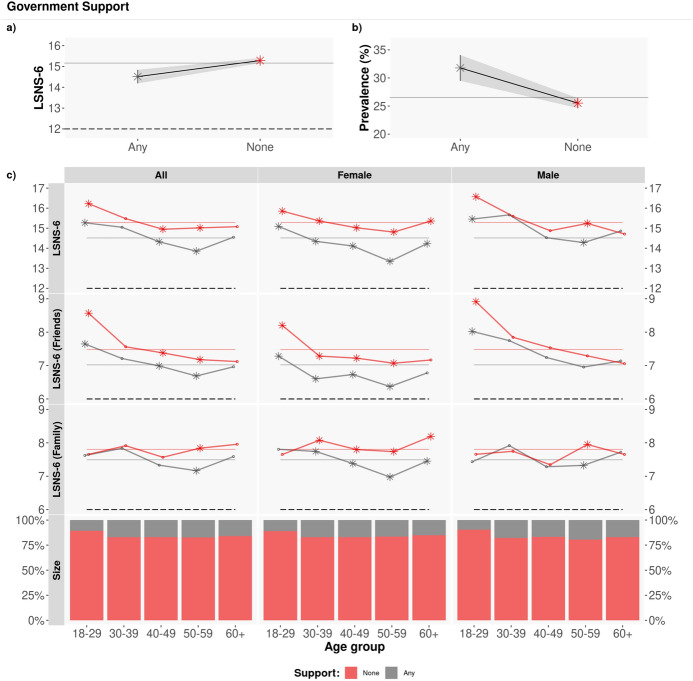
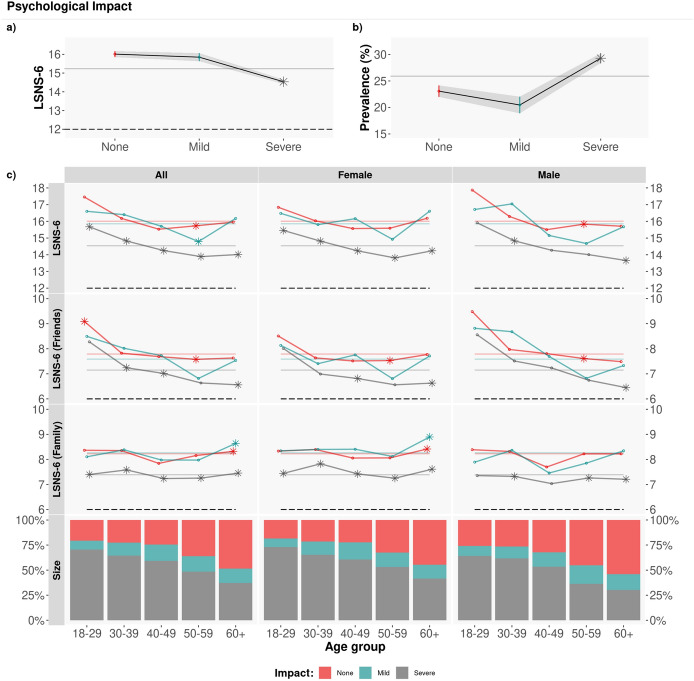
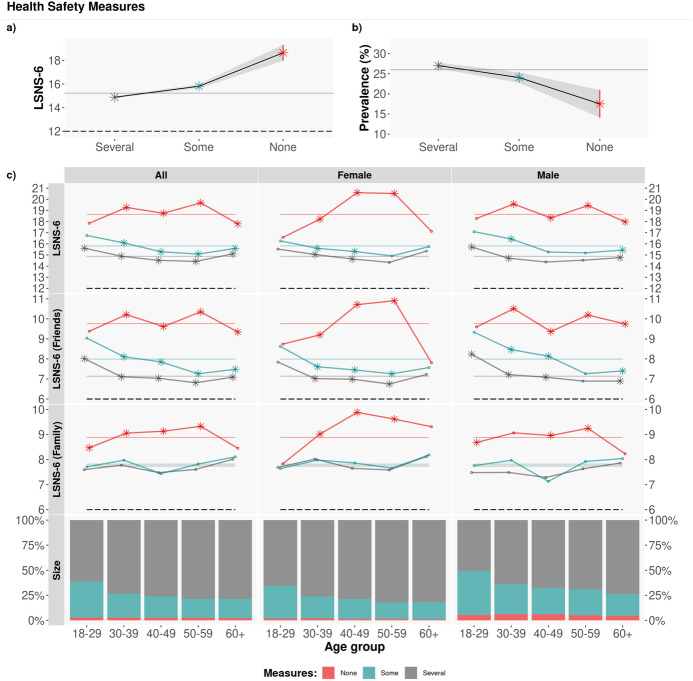
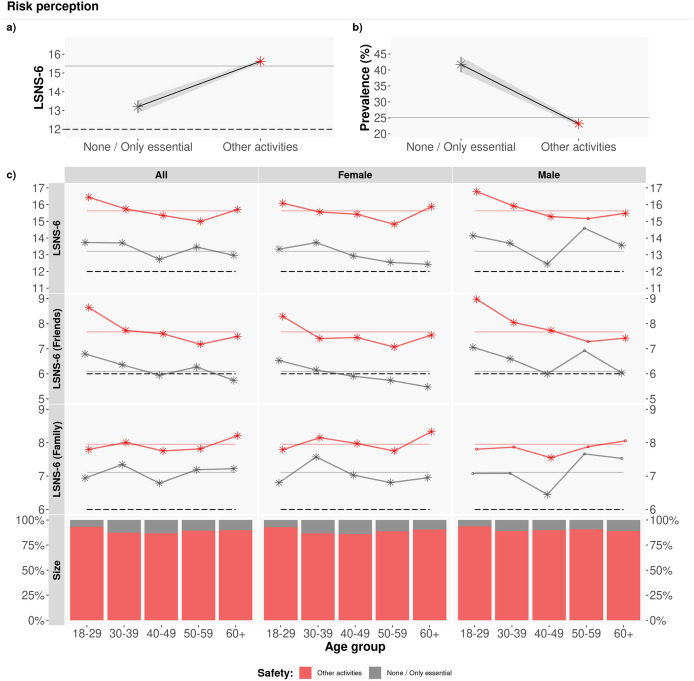
Since March of 2020, billions of people worldwide have been asked to limit their social contacts in an effort to contain the spread of the SARS-CoV-2 virus. However, little research has been carried out to date on the impact of such social distancing measures on the social isolation levels of the population. In this paper, we study the impact of the pandemic on the social isolation of the Spanish population, by means of 32,359 answers to a citizen survey collected over a period of 7 months. We uncover (1) a significant increase in the prevalence of social isolation in the population, reaching almost 26%; (2) gender and age differences, with the largest prevalence of isolation among middle-aged individuals; (3) a strong relationship between economic impact and social isolation; and (4) differences in social isolation, depending on the number of COVID-19 protection measures and on the perception of coronavirus infection risk by our participants. Our research sheds quantitative light on the sociological impact of the pandemic, and enables us to identify key factors in the interplay between the deployment of non-pharmaceutical interventions to contain the spread of an infectious disease and a population's levels of social isolation.


Conflict of interest statement

The authors declare no competing interests.

Figures

Figure 1
Figure 1
Average LSNS-6 (a), LSNS-6 Friends (b) and LSNS-6 Family (c) scores per age group. The larger the LSNS-6 score, the lower the levels of social isolation; Proportion of non isolated individuals per age group, defining isolation as a LSNS-6 score <12 (d), a LSNS-6 Friend score <6 (e), and a LSNS-6-Family score <6 (f). The greyed area shows the 95% CI. The grey continuous line corresponds to the overall average LSNS-6 score for all the age groups: μLSNS-6=15.23, SD=0.043; previso=25.98%, SD=0.003; μLSNS-6fri=7.43, SD=0.026; μLSNS-6fam=7.80, SD=0.025; previsofri=27.16%; previsofam=23.04%.
Figure 2
Figure 2
Average LSNS-6 score by income (a) and population (b) in thousands, both obtained from the 2020 Spanish official statistics (INE) data according to the participants’ reported postal code. The larger the income and the larger the population, the lower the levels of social isolation; (c) Average LSNS-6 score by week of the year: from June 6th to December 16th, 2021; (d) Average LSNS-6 score by the number of close contacts in the last 7 days. Note how the larger the number of close contacts, the larger the LSNS-6 scores and hence the lower the levels of social isolation. The greyed area shows the 95% CI. The grey continuous line correspond to the overall average LSNS-6 for the entire sample: μLSNS-6=15.23, SD=0.043.
Figure 3
Figure 3
Economic impact. Average LSNS-6 score by age group and gender. The coloured dashed lines correspond to the Overall/Friend/Family average LSNS-6 score per economic impact (Positive/None/Mild/Severe): μLSNS-6: [15.84, 15.40,14.71, 13.09]; μLSNS-6fam: [7.92, 7.94, 7.51, 6.58]; μLSNS-6fri: [7.92, 7.45, 7.20, 6.51]. To test the statistical significance of the differences, we applied a Tukey post-hoc test after obtaining a significant difference via an ANOVA test. Asterisks denote statistically significant differences with the rest of groups with α=0.05. Note how the more severe the economic impact, the lower the LSNS-6 scores and hence the larger the levels of social isolation.
Figure 4
Figure 4
Government support. Average LSNS-6 score by age group and gender. The coloured dashed lines correspond to the Overall/Friend/Family average LSNS-6 score per government economic assistance (Any/None): μLSNS-6: [14.50, 15.34]; μLSNS-6fam: [7.47,7.77]; μLSNS-6fri: [7.03, 7.55]. The asterisks denote statistically significant differences, via a t-test with α=0.05. The LSNS-6 scores of those receiving government support (gray lines) are significantly lower than the scores of those who do not receive any kind of government support (red lines).
Figure 5
Figure 5
Psychological impact. Average LSNS-6 score by age group. The coloured dashed lines correspond to the average overall/friend/family LSNS-6 score depending on the psychological impact (None/Mild/Severe): μLSNS-6: [16.01, 15.85, 14.54]; μLSNS-6fam: [8.23, 8.26, 7.39]; μLSNS-6fri: [7.79, 7.59, 7.15]. To test the statistical significance of the differences, we applied a Tukey post-hoc test after obtaining a significant difference via an ANOVA test. Asterisks denote statistically significant differences with the rest of groups with α=0.05. The average LSNS-6 scores of those with severe psychological impact are significantly lower than the rest.
Figure 6
Figure 6
Adopted COVID-19 protection measures. Average LSNS-6 score by age group and gender. The coloured lines correspond to the average Overall/Friend/Family LSNS-6 score per adopted COVID-19 protection measures (Several/Some/None): μLSNS-6: [14.88, 15.81, 18.64]; μLSNS-6fam: [7.74, 7.82, 8.88]; μLSNS-6fri: [7.14, 7.99, 9.76]. To test the statistical significance of the differences, we applied a Tukey post-hoc test after obtaining a significant difference via an ANOVA test. Asterisks denote statistically significant differences with the rest of groups with α=0.05. Those who do not adopt any measures (red lines) have significantly larger LSNS-6 scores than the rest.
Figure 7
Figure 7
Perception of COVID-19 infection risk for different types of activities. Average LSNS-6 score mean by age group and gender. The coloured lines correspond to the average Overall/Friend/Family LSNS-6 score per adopted COVID-19 protection measures (None/Other): μLSNS-6: [13.20, 15.63]; μLSNS-6fam: [7.10, 7.95]; μLSNS-6fri: [6.09, 7.68]. The asterisks denote statistically significant differences, with a t-test with α=0.05. Those who have a lower perception of risk linked to different daily-life activities (red lines) have significantly larger LSNS-6 scores than the rest of respondents (grey lines).

References

    1. Smith KP, Christakis NA. Social networks and health. Annu. Rev. Sociol. 2008;34:405–429. doi: 10.1146/annurev.soc.34.040507.134601. - DOI
    1. WHO. Social isolation and loneliness among older people: Advocacy brief. World Health Organization (2021).
    1. Leigh-Hunt N, et al. An overview of systematic reviews on the public health consequences of social isolation and loneliness. Public Health. 2017;152:157–171. doi: 10.1016/j.puhe.2017.07.035. - DOI - PubMed
    1. Smith KJ, Victor C. Typologies of loneliness, living alone and social isolation, and their associations with physical and mental health. Ageing Soc. 2019;39:1709–1730. doi: 10.1017/S0144686X18000132. - DOI
    1. Ge L, Yap CW, Ong R, Heng BH. Social isolation, loneliness and their relationships with depressive symptoms: A population-based study. PLoS ONE. 2017;12:e0182145. doi: 10.1371/journal.pone.0182145. - DOI - PMC - PubMed

Publication types