. 2022 Jul 22;5(1):730.
doi: 10.1038/s42003-022-03686-1.

A pore-forming protein drives macropinocytosis to facilitate toad water maintaining

Affiliations

A pore-forming protein drives macropinocytosis to facilitate toad water maintaining

Zhong Zhao et al. Commun Biol. .

Abstract

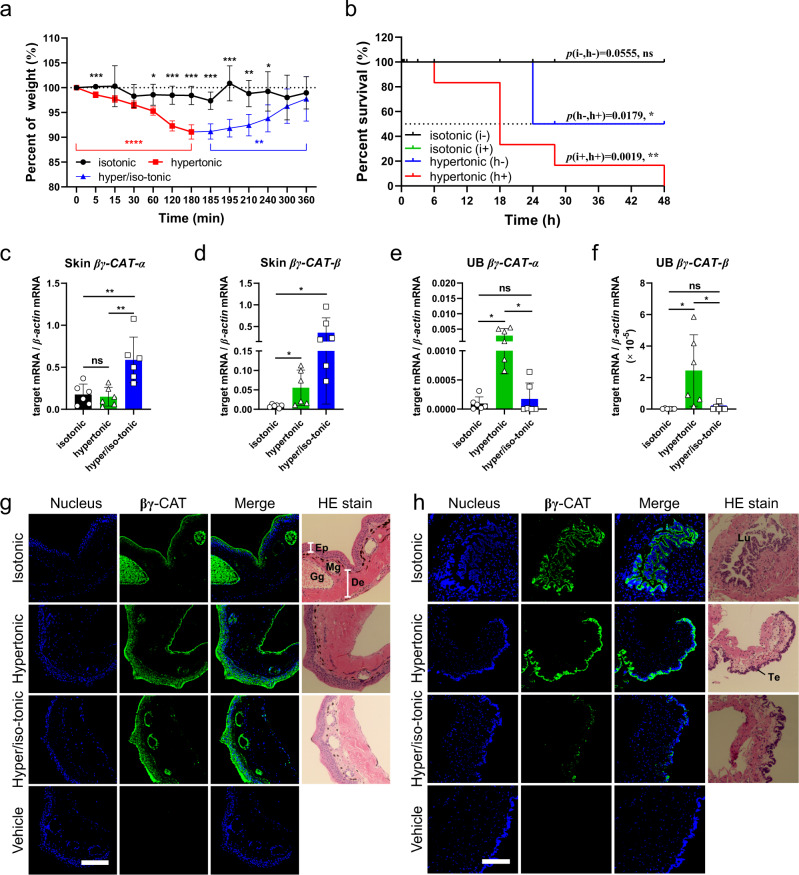
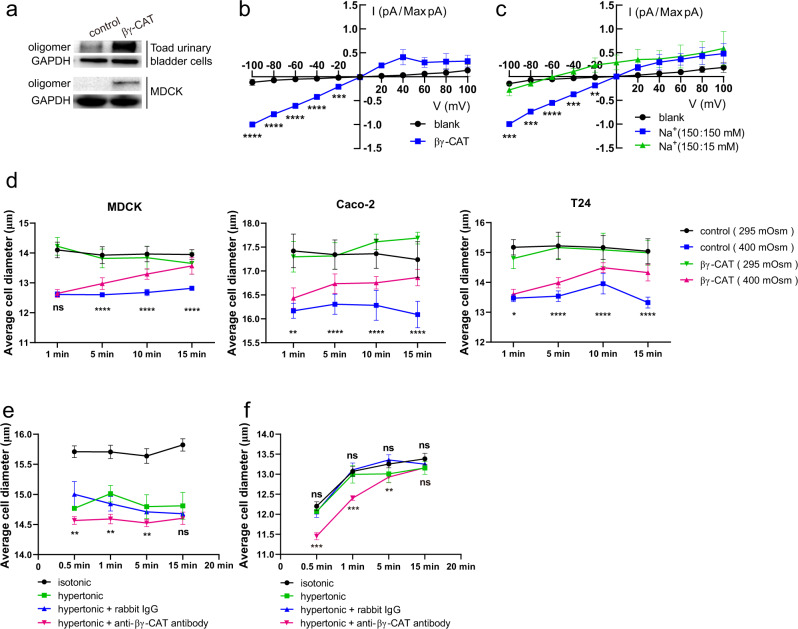
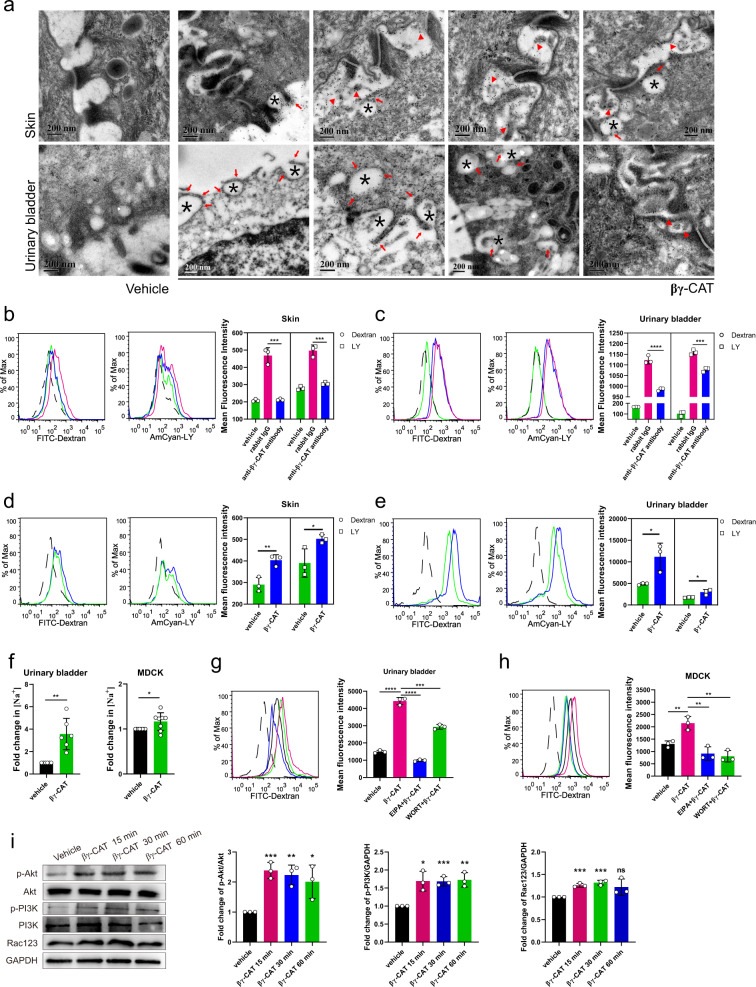
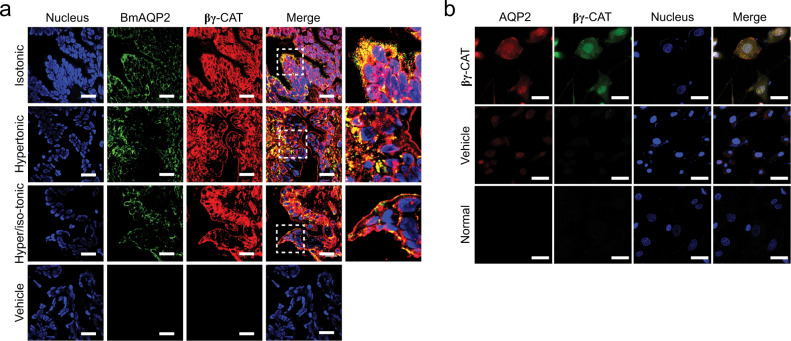
Maintaining water balance is a real challenge for amphibians in terrestrial environments. Our previous studies with toad Bombina maxima discovered a pore-forming protein and trefoil factor complex βγ-CAT, which is assembled under tight regulation depending on environmental cues. Here we report an unexpected role for βγ-CAT in toad water maintaining. Deletion of toad skin secretions, in which βγ-CAT is a major component, increased animal mortality under hypertonic stress. βγ-CAT was constitutively expressed in toad osmoregulatory organs, which was inducible under the variation of osmotic conditions. The protein induced and participated in macropinocytosis in vivo and in vitro. During extracellular hyperosmosis, βγ-CAT stimulated macropinocytosis to facilitate water import and enhanced exosomes release, which simultaneously regulated aquaporins distribution. Collectively, these findings uncovered that besides membrane integrated aquaporin, a secretory pore-forming protein can facilitate toad water maintaining via macropinocytosis induction and exocytosis modulation, especially in responses to osmotic stress.


Conflict of interest statement

The authors declare no competing interests.

Figures

Fig. 1
Fig. 1. βγ-CAT is involved in responses to osmotic stress.
a Toad weight changes were measured after placing them in isotonic, hypertonic and hypertonic/isotonic Ringer’s solutions. Initial weight of toads is 19 ± 5 g (n = 5). b Survival rates of toads in isotonic (i) and hypertonic (h) Ringer’s solution were determined after 48 hours. Toads were placed in each of the solutions after 30 minutes with (+) or without (-) electro-stimulation to delete toad skin secretions (n = 6). cf The expression of βγ-CAT subunits in toad skin and UB was analyzed by real-time fluorescent quantitative PCR (n = 6). Toads were placed in isotonic or hypertonic Ringer’s solution for 3 hours before the samples were collected. In the hypertonic/isotonic group, the toads were first placed in the hypertonic solution for 3 hours, then moved to isotonic solution for a further 3 hours before the samples were collected. g, h Following placement of toads in isotonic, hypertonic or hypertonic/isotonic Ringer’s solution as described above, the localization and expression of βγ-CAT in the toad skin (g) and UB (h) tissues were analyzed by immunohistofluorescence (IHF). Ep epidermis, De dermis, Mg mucous gland, Gg granular gland, Lu lumen, Te transitional epithelium. Scale bars, 200 μm. *P < 0.05 and **P < 0.01 by the Gehan-Breslow-Wilcoxon test in survival rate analysis. ns (P ≥ 0.05); *P < 0.05, **P < 0.01 and ***P < 0.001 by unpaired t test in other experiments. All data represent the mean ± SD and are representative of at least two independent experiments. See also supplementary Fig. 1.
Fig. 2
Fig. 2. βγ-CAT counteracts cellular dehydration under extracellular hyperosmosis.
a Toad urinary bladder cells and MDCK cells were treated with or without βγ-CAT for 15 minutes. The appearance of βγ-CAT oligomers in the treated cells was determined by Western blotting. b Normalized current-voltage curves of channels formed by 100 nM βγ-CAT on HEK293 cells. Currents were elicited by 500 ms ramp protocol between −100 mV to +100 mV every 2 seconds from a holding potential of 0 mV (n = 3). c Normalized current-voltage curves of βγ-CAT channels in indicated solutions (pipette/bath) (n = 3). Na+(150:15 mM) represents the 150 mM Na+ in the pipette and 15 mM Na+ in the bath. d Diameter changes of MDCK, Caco-2 and T24 cells in isotonic (295 mOsm) or hypertonic (400 mOsm) PBS in the presence or absence of βγ-CAT as determined by using a cell counter. Digested cells were first suspended in PBS for 15 minutes before they were used in this experiment. e, f Diameter changes of toad UB epithelial cells in isotonic (black) and hypertonic (green) Ringer’s solution in the presence of 50 μg mL−1 rabbit antibody (blue) or anti-βγ-CAT antibody (magenta). In (f), the cells were first treated with 0.3 mM HgCl2 for 10 minutes before cell diameter measurement with a cell counter. In all experiments shown in Fig. 2, βγ-CAT dosages used were 10 nM for MDCK and Caco-2, 5 nM for T24 and 50 nM for toad UB epithelial cells. The bars represent the mean ± SD of triplicate samples in be. The bars represent the mean ± SD of three independent replicates in f. ns (P ≥ 0.05), *P < 0.05, **P < 0.01, ***P < 0.001 and ****P < 0.0001 by the unpaired t test. All data are representative of at least two independent experiments. See also supplementary Fig. 2.
Fig. 3
Fig. 3. βγ-CAT promotes macropinocytosis.
a Ultrastructural localization of βγ-CAT in toad skin and UB tissues as analyzed by IEM. Vehicle (rabbit IgG control). Endocytic vesicles formed by macropinocytosis (black asterisks), and distribution of βγ-CAT on vesicles (red arrows) and intercellular spaces (red triangles). b, c Immunodepletion of endogenous βγ-CAT decreased macropinocytosis. Toad skin (b) and UB (c) epithelial cells were incubated with 50 μg mL−1 anti-βγ-CAT antibody to immunodeplete endogenous βγ-CAT for 30 min. The mean fluorescence intensity was determined by flow cytometry with 100 μg mL−1 of 70 kDa FITC-label dextran and Lucifer Yellow (LY) for 30 minutes. Rabbit IgG (antibody control). Vehicle (antibody absent control). d, e The addition of purified βγ-CAT augmented macropinocytosis. The mean fluorescence intensity of LY and FITC-label dextran in toad skin (d) and UB (e) epithelial cells was determined by flow cytometry with or without additional 100 nM or 50 nM βγ-CAT, respectively. f Fold changes of [Na+] in toad UB epithelial cells (n = 6) and MDCK cells (n = 8) with and without the addition of 50 nM or 10 nM βγ-CAT for 3 hours, respectively. g, h The effect of inhibitors on macropinocytosis induced by βγ-CAT. Toad UB epithelial cells (g) and MDCK cells (h) were incubated with and without 100 μM EIPA or 20 μM WORT for 1 hour. Then the cells were cultured with 100 μg mL−1 FITC-label dextran with 50 nM (toad UB cells) or 10 nM (MDCK cells) βγ-CAT for 30 minutes. i Rac123 and phosphorylation of Akt and PI3K in response to 10 nM βγ-CAT in MDCK cells for 15, 30 or 60 minutes as determined by Western blotting and bands were semiquantified with ImageJ. The black dotted line refers to the blank control, and data represent the mean ± SD of triplicate samples in b-e, g, h. Data represent the mean ± SD of at least three independent replicates in f and i. ns (P ≥ 0.05), *P < 0.05, **P < 0.01, ***P < 0.001 and ****P < 0.0001 by the unpaired t test. All data are representative of at least two independent experiments. See also supplementary Fig. 3.
Fig. 4
Fig. 4. βγ-CAT in AQP regulation.
a Colocalization of βγ-CAT and BmAQP2 in the UB tissue of toad B. maxima after toads were placed in isotonic, hypertonic or hypertonic/isotonic Ringer’s solution for 3 hours as analyzed by immunohistofluorescence. Scale bars, 25 μm. b Intracellular colocalization of βγ-CAT and AQP2 in MDCK cells with or without the treatment of 10 nM βγ-CAT for 15 minutes as determined by immunofluorescence. Scale bars, 30 μm. All data are representative of at least two independent experiments.
Fig. 5
Fig. 5. βγ-CAT enhances exosome release.
a Ultrastructural localization of βγ-CAT in toad UB tissue by IEM. βγ-CAT (arrow) was readily detected in MVBs (asterisk) or ILVs. Vehicle (rabbit IgG control). b TEM analysis of exosomes from the supernatant of toad UB epithelial cells cultured in vitro for 3 hours. c Western blotting analysis of flotillin-1, TSG101 and CD63 molecules in exosomes isolated from the supernatant of toad UB epithelial cells cultured in vitro for 3 hours with or without the addition of 50 nM βγ-CAT. d, e Analysis of the concentration and particle size (30–200 nm) of exosomes from toad UB epithelial cells with and without 50 μg mL−1 anti-βγ-CAT antibodies (d) or the addition of 50 nM βγ-CAT (e) by NTA. f, g The percentage (f) and mean fluorescence intensity (g) of dextran-containing exosomes from toad UB epithelial cells in a culture medium containing 1 mg mL−1 FITC-label dextran by Nanoflow Cytometry with or without the addition of 50 nM βγ-CAT. h Western blotting analysis of βγ-CAT and BmAQP2 in exosomes of toad UB epithelial cells cultured in vitro for 3 hours with or without the addition of 50 nM βγ-CAT. i IEM determination of βγ-CAT and BmAQP2 in exosomes (asterisk) from toad UB epithelial cells. BmAQP2 and βγ-CAT were labeled with 10-nm (arrow) and 5-nm (triangle) colloidal gold particles, respectively. j, k Fold changes of total (j) and mean (k) Na+ concentrations in exosomes from the same number of MDCK cells with or without 10 nM βγ-CAT for 3 hours. l Fold changes of total Na+ concentrations in exosomes from the same number of MDCK cells under the hypertonic medium with or without 10 nM βγ-CAT for 3 hours. The bars represent the mean ± SD of triplicate samples in dg. Data represent the mean ± SD of at least three independent replicates in jl. ns (P ≥ 0.05), *P < 0.05 and ****P < 0.0001 by the unpaired t test. All data are representative of at least two independent experiments. See also supplementary Fig. 4.
Fig. 6
Fig. 6. Proposed action model of βγ-CAT in water acquisition and maintaining.
βγ-CAT achieved intracellular vesicle transport and transcellular transport of water, Na+ and AQP2 by promoting macropinocytosis (import) and exosome release (export). For a detailed description, see the test. Presentation of the epithelial cell layer and internal tissue is simplified. All clipart components are sourced from PowerPoint 2019 and Adobe illustrator CC 2019.

Similar articles

Cited by

References

    1. Bentley PJ. Adaptations of amphibia to arid environments. Science. 1966;152:619–623. doi: 10.1126/science.152.3722.619. - DOI - PubMed
    1. Shoemaker V, Nagy KA. Osmoregulation in amphibians and reptiles. Annu. Rev. Physiol. 1977;39:449–471. doi: 10.1146/annurev.ph.39.030177.002313. - DOI - PubMed
    1. Hillyard SD. Behavioral, molecular and integrative mechanisms of amphibian osmoregulation. J. Exp. Zool. 1999;283:662–674. doi: 10.1002/(SICI)1097-010X(19990601)283:7<662::AID-JEZ5>3.0.CO;2-L. - DOI - PubMed
    1. Ogushi Y, et al. The water-absorption region of ventral skin of several semiterrestrial and aquatic anuran amphibians identified by aquaporins. Am. J. Physiol. -Regul. Integr. Comp. Physiol. 2010;299:R1150–R1162. doi: 10.1152/ajpregu.00320.2010. - DOI - PubMed
    1. Suzuki M, Hasegawa T, Ogushi Y, Tanaka S. Amphibian aquaporins and adaptation to terrestrial environments: A review. Comp. Biochem. Physiol. A. Mol. Integr. Physiol. 2007;148:72–81. doi: 10.1016/j.cbpa.2006.12.021. - DOI - PubMed

Publication types