. 2023 Jan;30(1):37-53.
doi: 10.1038/s41418-022-01044-6. Epub 2022 Jul 22.

Mitochondrial RNA methyltransferase TRMT61B is a new, potential biomarker and therapeutic target for highly aneuploid cancers

Affiliations

Mitochondrial RNA methyltransferase TRMT61B is a new, potential biomarker and therapeutic target for highly aneuploid cancers

Alberto Martín et al. Cell Death Differ. 2023 Jan.

Abstract

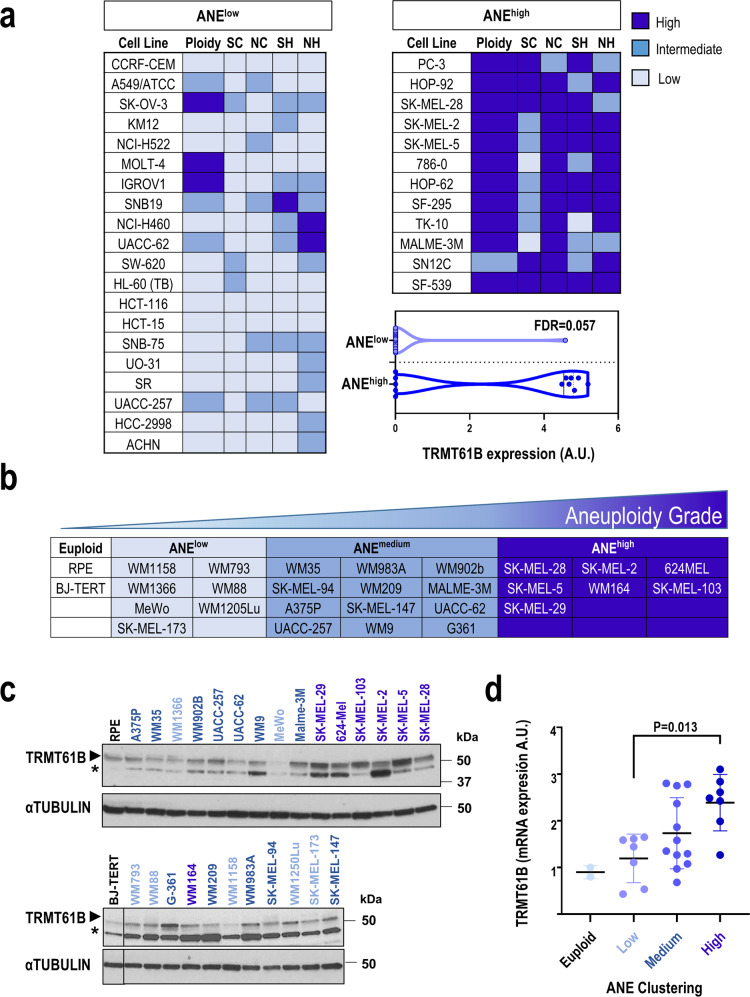
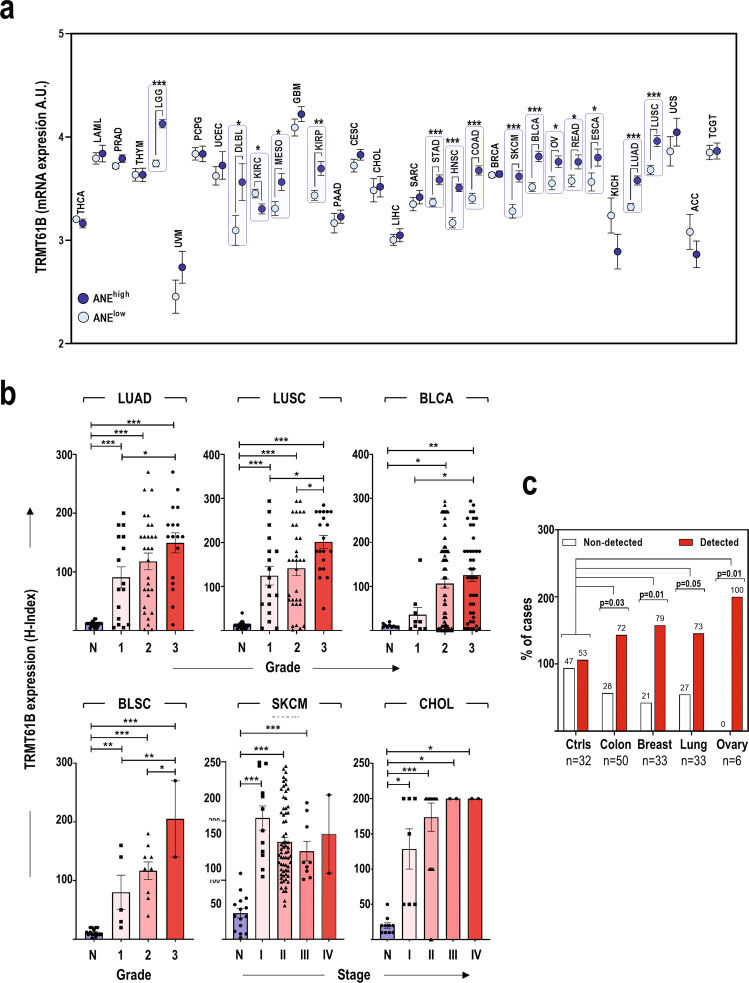
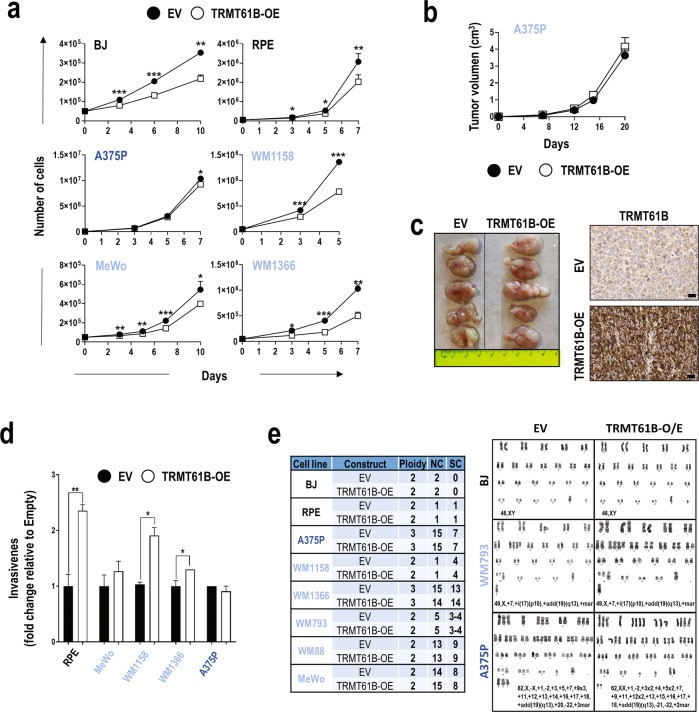
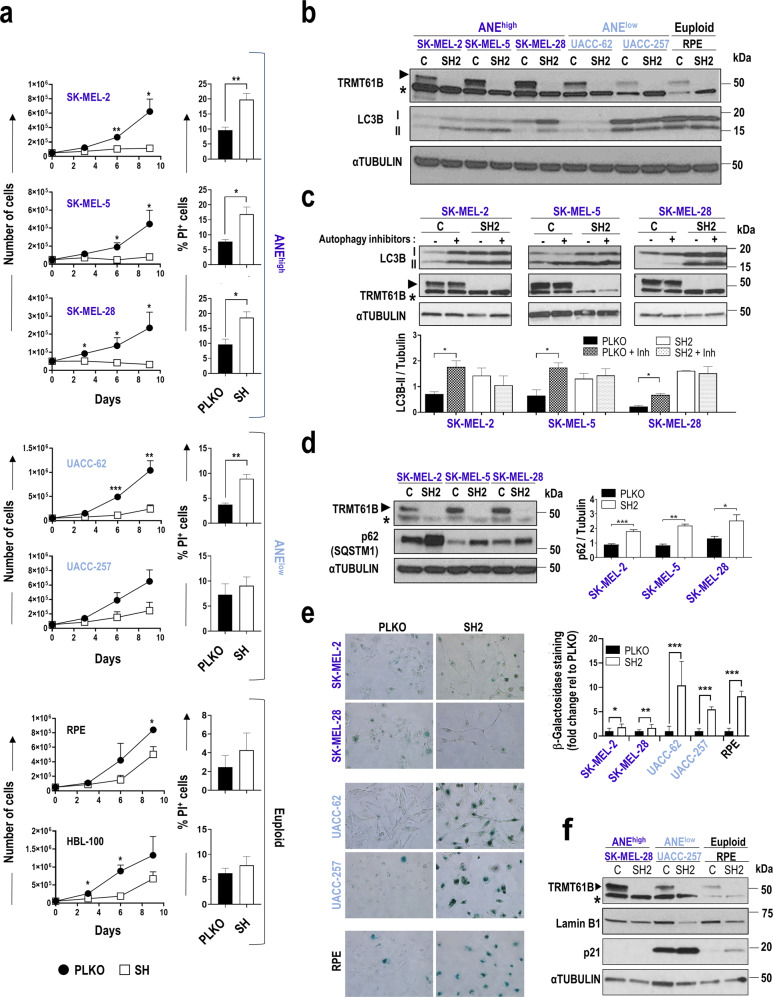
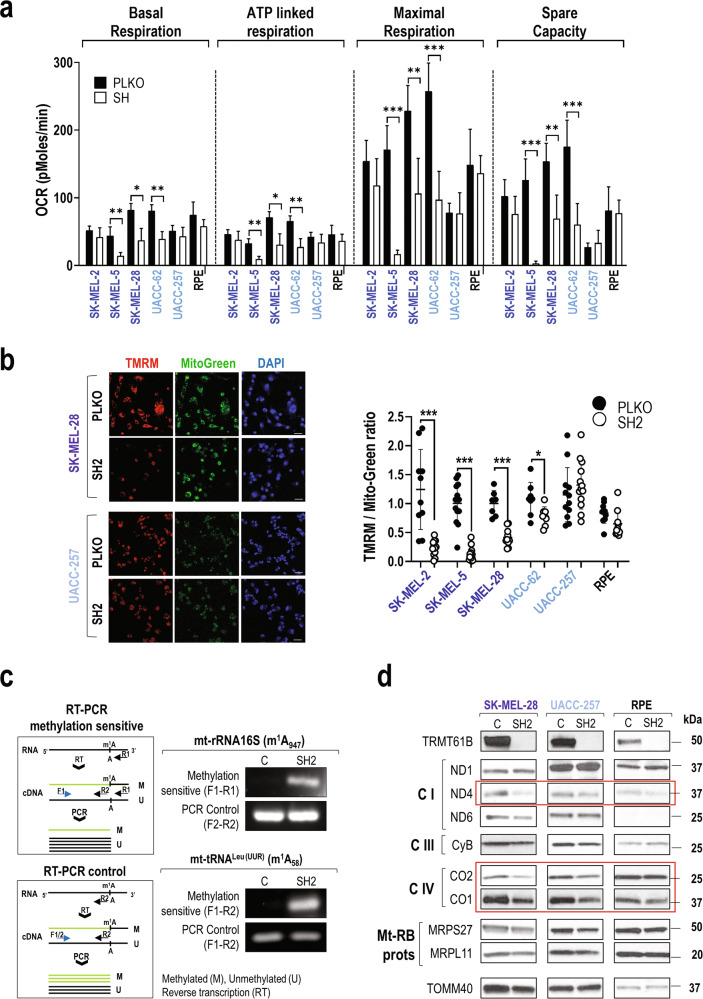
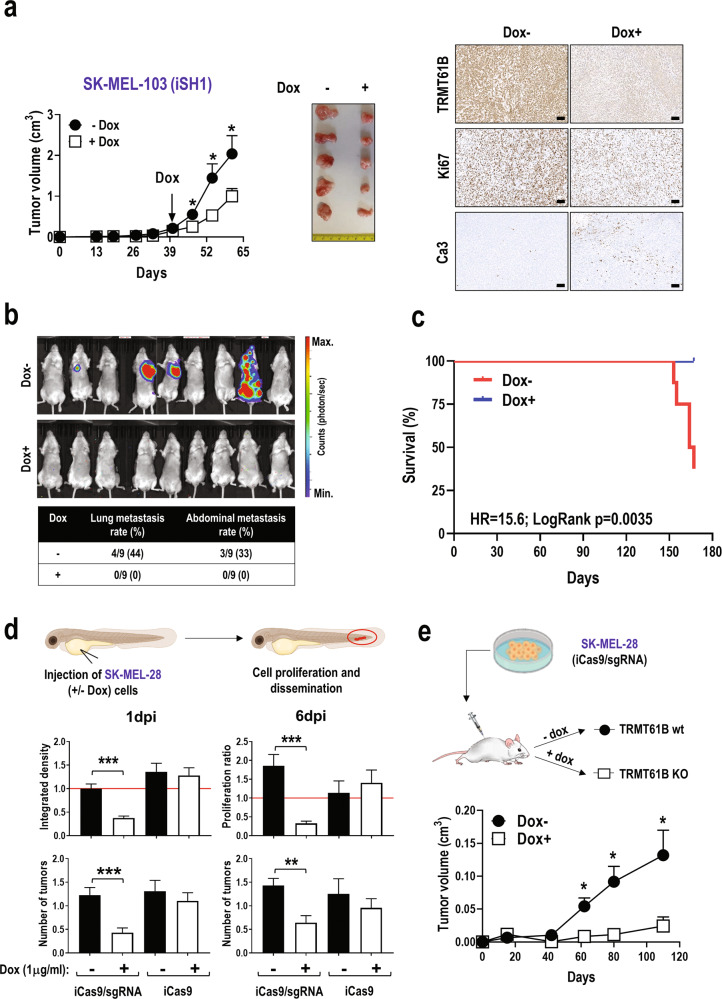
Despite being frequently observed in cancer cells, chromosomal instability (CIN) and its immediate consequence, aneuploidy, trigger adverse effects on cellular homeostasis that need to be overcome by anti-stress mechanisms. As such, these safeguard responses represent a tumor-specific Achilles heel, since CIN and aneuploidy are rarely observed in normal cells. Recent data have revealed that epitranscriptomic marks catalyzed by RNA-modifying enzymes change under various stress insults. However, whether aneuploidy is associated with such RNA modifying pathways remains to be determined. Through an in silico search for aneuploidy biomarkers in cancer cells, we found TRMT61B, a mitochondrial RNA methyltransferase enzyme, to be associated with high levels of aneuploidy. Accordingly, TRMT61B protein levels are increased in tumor cell lines with an imbalanced karyotype as well as in different tumor types when compared to control tissues. Interestingly, while TRMT61B depletion induces senescence in melanoma cell lines with low levels of aneuploidy, it leads to apoptosis in cells with high levels. The therapeutic potential of these results was further validated by targeting TRMT61B in transwell and xenografts assays. We show that TRM61B depletion reduces the expression of several mitochondrial encoded proteins and limits mitochondrial function. Taken together, these results identify a new biomarker of aneuploidy in cancer cells that could potentially be used to selectively target highly aneuploid tumors.


Conflict of interest statement

The authors declare no competing interests.

Figures

Fig. 1
Fig. 1. TRMT61B protein expression positively correlates with aneuploidy levels in human cell lines.
a Following bioinformatics analysis, tumor cell lines included in the NCI-60 panel were grouped into 3 clusters according to different karyotypic features (SC, SH, NC, NH, and ploidy) ranging from low (ANElow) to high (ANEhigh) aneuploidy levels. Cell lines belonging to the most extreme groups in terms of aneuploidy levels are listed. Differential protein expression analysis in cell lines included in these 2 clusters allowed us to identify the TRMT61B gene, a mitochondrial RNA methyltransferase, whose protein expression levels were upregulated in ANEhigh vs. ANElow (FDR = 0.057). SC: Structural Complexity; SH: Structural Heterogeneity; NC: Numerical Complexity; NH: Numerical Heterogeneity. b A collection of 26 human melanoma cell lines and 2 euploid controls were karyotypically characterized for some of the foregoing karyotypic parameters (SC, NC, and ploidy), divided in 4 clusters with null (euploid group) or increased rate of aneuploidy (ANEhigh, ANEmedium, and ANElow). c TRMT61B expression was analyzed by western blot for each of the cell lines in three independent experiments. αTUBULIN was used as loading control for the normalization of TRMT61B protein expression. One representative western blot is shown. d As shown in the dotplot, ANEhigh shows statistically significant upregulation of TRMT61B protein expression compared to ANElow group. Triplicates were considered in the quantification analysis. Error bars represent standard error. *P < 0.05; **0.001 < P < 0.01; ***P < 0.001 (Student’s t-test; unpaired, 2-tailed). One-way ANOVA for multiple comparisons was used to determine statistically significant differences. Asterisks indicate non-specific bands. Lighter to darker blue color code indicates lower to higher aneuploidy grades.
Fig. 2
Fig. 2. TRMT61B expression is positively associated with cancer and aneuploidy levels in human cancers.
a Examination of TRMT61B expression in the TCGA collection reveals significantly increased mRNA levels of this RNA methyltransferase in samples with higher aneuploidy scores in 14 out of the 33 tumor types. b TRMT61B protein levels are elevated in lung (LUAD and LUSC) and bladder (BLCA, BLSC) cancer as well as in melanoma (SKCM) and cholangiocarcinomas (CHOL) when compared with the corresponding healthy tissues (N). A significant direct relationship with histopathological grade was also detected in some tumor types (BLCA, BLSC, LUAD, and LUSC), especially in the case of the highest tumor grade. c TRMT61B protein is detected in plasmas from cancer patients in a higher percentage of cases than in control plasmas. Error bars represent standard error in all the cases. *P < 0.05; **0.001 < P < 0.01; ***P < 0.001 (Student’s t-test; unpaired, 2-tailed). One-way ANOVA for multiple comparisons was used to determine statistically significant differences in (b). Chi-square test was used in (c) to compare control vs cancer groups and calculate P values. Tumor abbreviations: THCA Thyroid carcinoma, LAML Acute Myeloid Leukemia, PRAD Prostate adenocarcinoma, THYM Thymoma, LGG Brain Lower Grade Glioma, UVM Uveal Melanoma, PCPG Pheochromocytoma and Paraganglioma, UCEC Uterine Corpus Endometrial Carcinoma, DLBC Lymphoid Neoplasm Diffuse Large B-cell Lymphoma, KIRC Kidney renal clear cell carcinoma, MESO Mesothelioma, GBM Glioblastoma multiforme, KIRP Kidney renal papillary cell carcinoma, PAAD Pancreatic adenocarcinoma, CESC Cervical squamous cell carcinoma and endocervical adenocarcinoma, CHOL Cholangiocarcinoma, LIHC Liver hepatocellular carcinoma, SARC Sarcoma, STAD Stomach adenocarcinoma, HNSC Head and Neck squamous cell carcinoma, COAD Colon adenocarcinoma, BRCA Breast invasive carcinoma, SKCM Skin Cutaneous Melanoma, BLCA Bladder Urothelial Carcinoma, BLSC Bladder Squamous Cell Carcinoma, OV Ovarian serous cystadenocarcinoma, READ Rectum adenocarcinoma, ESCA Esophageal carcinoma, KICH Kidney Chromophobe, LUAD Lung adenocarcinoma, LUSC Lung squamous cell carcinoma, UCS Uterine Carcinosarcoma, ACC Adrenocortical carcinoma, TGCT Testicular Germ Cell Tumors.
Fig. 3
Fig. 3. TRMT61B overexpression fails to produce karyotype abnormalities, causes milder effects on cell biology, and does not promote tumor growth in vivo.
a Proliferation of the indicated cell lines is slightly reduced after ectopic expression of TRMT61B (white squares) compared to controls (black circles). b In vivo tumor formation of injected A375P cells overexpressing (TRMT61B-OE) or not overexpressing (EV) TRMT61B does not result in significant differences in tumor growth. Twelve NSG immunodeficient mice were engrafted with each of the two groups of A375P cells. c Image showing the tumor size of both TRMT61B genetic conditions at the end of the experiment (left). Micrographs show representative immunostaining for TRMT61B detection in TRMT61B-OE and control xenografted cells (right). Scale bars, 100 μm. d In vitro evaluation by transwell assays of the invasive capacity of MeWo, RPE, A375P, WM1158, WM1366, and A375P cells showing base line (EV) or increased (TRMT61B-OE) levels of TRMT61B. e Table shows ploidy, numerical (NC), and structural (SC) changes observed in BJ, RPE, MeWo, A375P, WM1158, WM1366, and A375P cells 30 to 40 days after TRMT61B OE was initiated. No changes were detected in the karyotype status of all the cell lines regardless of TRMT61B expression levels. Representative karyotypes are shown for BJ, WM793, and A375P cells overexpressing (TRMT61B-OE) or not (EV) TRMT61B. Lighter to darker blue color code indicates lower to higher aneuploidy grades in all the panels. Error bars represent standard deviation in (a, d) and standard error in (b). *P < 0.05; **0.001 < P < 0.01; *** P < 0.001 (Student’s t-test; unpaired, 2-tailed).
Fig. 4
Fig. 4. Antiproliferative effects induced by TRMT61B knock-down in cell lines with different aneuploid levels.
a Proliferation capacity (left graphs) of cell lines exhibiting different aneuploidy levels (euploid, low and high) according to the in silico analysis, is greatly compromised after TRMT61B interference with a concomitant apoptotic response (right columns), especially in ANEhigh cells. Results are the mean of 4 independent experiments performed with 3 different shRNAs (SH1, SH2 and SH4). Apoptosis is analyzed using PI staining and is the average of 4 measurements taken at different time points (0, 3, 6, and 9 days after cell plating) during each of the experiments. b Western blot analysis of the autophagy marker LC3BII in cell lines of the 3 ANE groups with or without TRMT61B expression. A representative blot showing accumulation of LC3BII in ANEhigh cells in response to TRMT61B knockdown is shown. c The biological significance of LC3BII induction detected in ANEhigh cells after TRMT61B abrogation was determined by exposing both control and TRMT61B depleted cells to the autophagy inhibitory cocktail PepstatinA and E64d (5 μg/ml, 7 h). Measurement of the autophagy flux indicates blockade or delay of the autophagy cascade in the absence of TRMT61B. The histogram shows the quantification of three independent experiments. d Increased expression of p62 protein levels after TRMT61B silencing in ANEhigh cells confirms the impairment of the autophagy process. Quantification of 3 different experiments is represented in the histogram adjacent to the blot. e β-galactosidase staining (left panels) and quantification (right histogram) corresponding to control and melanoma cell lines with baseline or downregulated TRMT61B levels show a prominent senescence response in the ANElow and euploid clusters. Two independent experiments were carried out in the case of SK-MEL-28, UACC-257, and RPE cell lines using two different shRNAs (SH1 and SH4). A representative experiment is shown. f p21 up-regulation and LMNA B1 down-regulation, 2 well-known senescence features, are also associated with TRMT61B knockdown in ANElow and euploid cell lines. Lighter to darker blue color code indicates lower to higher aneuploidy grades in all the panels. Error bars represent standard error in (a, c, d) and standard deviation in (e). *P < 0.05; **0.001 < P < 0.01; ***P < 0.001 (Student’s t-test; unpaired, 2-tailed).
Fig. 5
Fig. 5. TRMT61B is required for mitochondrial functionality more prominently in ANEhigh cells.
a Seahorse analysis of OXPHOS (oxidative phosphorylation) reveals a statistically significant reduction in ATP- linked, baseline, and maximal respiration as well as spare capacity (difference between maximal and baseline respiration) in 2 out of 3 ANEhigh (SK-MEL-28 and SK-MEL-5) and 1 out of 2 ANElow(UACC-62) cell lines, after TRMT61B elimination, suggesting that this RNA methyltransferase is required for proper stress response. Continuous OCR values (pmoles/min) are shown. Mitochondrial functions were analyzed as explained in Materials and Methods. Five independent experiments were carried out between 5 and 7 days after TRMT61B silencing using two different shRNAs (SH1 and SH4). b In the same group of cells also including SK-MEL-2 cell line, TMRM staining, a fluorescent probe accumulated in active mitochondria, reveals a clear loss of mitochondrial membrane potential after TRMT61B downregulation, as shown by a diminished signal detected after quantification (right dotplot). Conversely, RPE and UACC-257 cells do not display significant differences in TMRM staining irrespective of TRMT61B status. Representative fluorescence images showing TMRM (red), Mitotracker (green), and DAPI (blue) (left). One representative experiment is shown. Scale bars, 50 μm. c PCR strategy to determine methylation levels (top left) of the indicated mt-RNA types based on the ability of N1-methyladenosine (m1A) to block reverse transcription. Amplification levels of the resultant cDNA by semi-quantitative PCR indirectly estimate the presence of the desired methylation mark. As expected, TRMT61B silencing reduced specific m1A formation (residues in brackets) in 2 known mt-RNA targets according to the PCR product detected. A second PCR test (bottom left) insensitive to m1A methylation is also described and used as a loading control. d Protein expression levels of several mitochondrial encoded genes that are part of the electron transport chain (Complexes I, III, and IV) as well as nuclear-encoded mitoribosomal proteins (Mt-Rb) were analyzed by western blot in mitochondrial protein extracts derived from the indicated cell lines expressing baseline or reduced levels of TRMT61B. The mitochondrial marker TOMM40 was used as a loading control, since its expression is not expected to be altered. Genes highlighted in red are the most affected when TRMT61B is removed. Lighter to darker blue color code indicates lower to higher aneuploidy grades in all the panels. Error bars represent standard error in a and standard deviation in b. *P < 0.05; ***P < 0.001 (Student’s t-test; unpaired, 2-tailed).
Fig. 6
Fig. 6. TRMT61B abrogation diminishes the tumorigenic potential of ANEhigh melanoma cell lines.
a Tumor growth in NSG mice injected with SK-MEL-103 cells consecutively transduced with lentiviral vectors harboring a luciferase reporter gene and a doxycycline inducible shRNA (iSH1) targeting TRMT61B expression. Monitoring tumor volume by external caliper indicates a statistically significant reduction in tumor growth after doxycycline administration (left). Two different experiments were carried out with 10 mice per group (doxycycline-treated and untreated). Representative macroscopic images and immunohistochemical staining of TRMT61B, Ki67, and cleaved caspase-3 in tumor sections from each mouse cohort are shown (right). Scale bars, 100 μm. b Representative bioluminescence images of doxycycline-treated and untreated NSG immunodeficient mice obtained 150 days after SK-MEL-103 tumor removal by surgical excision in order to facilitate metastatic spread. The color scale represents the bioluminescence levels (photons per second) emitted from the thoracic and abdominal region of xenografted mice (ventral view) ranging from low (blue), to medium (green) and high (red). The table below summarizes the incidence of metastatic lesions detected in both group of animals. Metastatic rates are calculated as the proportion of affected vs. total mice. c The Kaplan-Meier survival curve shows a reduced lifespan of Dox- mice in comparison with the Dox+ group. The log rank test was used to evaluate survival differences between both groups, and the HR indicates an increased risk of death in the untreated group. d Integrated density (at 1 day post injection, 1dpi) and proliferation ratio (at 6 days post-injection, 6dpi) of SK-MEL-28 cells (both Cas9/sgRNA and Cas9 alone, treated or not with doxycycline) injected into the circulation of the zebrafish embryos (top histograms). The red line at 6dpi represents a threshold below which cell proliferation stops. Integrated density at 1dpi is a total measure of the fluorescence of the fish tails. Average tumor number present in the tail of each condition tested at 1 and 6dpi is also shown (bottom histograms). nreplica = 20 embryos/condition (3 replica), ntotal = 60 embryos/condition; Error bars represent standard error. e SK-MEL-28 cells containing CRISPR/Cas9 elements were subcutaneously injected in nude mice being treated or not with doxycycline from the very beginning to schedule a preventive strategy. As is shown in the graph, doxycycline administration causes a statistically significant tumor growth retardation. One experiment was performed with 12 animals per group. Error bars represent standard error in all the panels. *P < 0.05; **0.001 < P < 0.01; ***P < 0.001 (Student’s t-test; unpaired, 2-tailed).

References

    1. Weaver BA, Cleveland DW. Does aneuploidy cause cancer? Curr Opin Cell Biol. 2006;18:658–67. doi: 10.1016/j.ceb.2006.10.002. - DOI - PubMed
    1. Albertson DG, Collins C, McCormick F, Gray JW. Chromosome aberrations in solid tumors. Nat Genet. 2003;34:369–76. doi: 10.1038/ng1215. - DOI - PubMed
    1. Gordon DJ, Resio B, Pellman D. Causes and consequences of aneuploidy in cancer. Nat Rev Genet. 2012;13:189–203. doi: 10.1038/nrg3123. - DOI - PubMed
    1. Swanton C, Nicke B, Schuett M, Eklund AC, Ng C, Li Q, et al. Chromosomal instability determines taxane response. Proc Natl Acad Sci. 2009;106:8671–6. doi: 10.1073/pnas.0811835106. - DOI - PMC - PubMed
    1. Bakhoum SF, Ngo B, Laughney AM, Cavallo JA, Murphy CJ, Ly P, et al. Chromosomal instability drives metastasis through a cytosolic DNA response. Nature. 2018;553:467–72. doi: 10.1038/nature25432. - DOI - PMC - PubMed

Publication types

LinkOut - more resources