

Effects of lactoferrin on intestinal flora of metabolic disorder mice
- PMID: 35869430
- PMCID: PMC9306164
- DOI: 10.1186/s12866-022-02588-w
Effects of lactoferrin on intestinal flora of metabolic disorder mice
Abstract
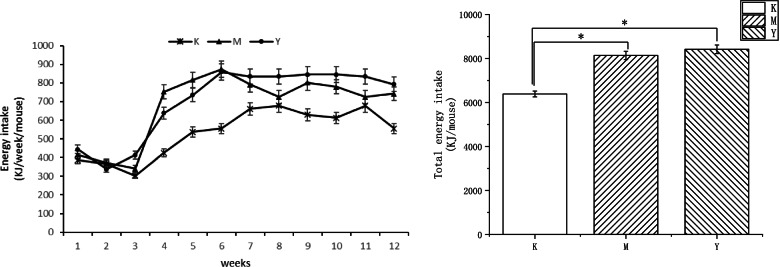
To study the mechanism of lactoferrin (LF) regulating metabolic disorders in nutritionally obese mice through intestinal microflora. Twenty-one male C57BL/6 mice were randomly divided into 3 groups: control group, model group and LF treatment group. The mice in control group were fed with maintenance diet and drank freely. The mice in model group were fed with high fat diet and drank freely. The mice in LF treatment group were fed with high fat diet and drinking water containing 2% LF freely. Body weight was recorded every week. Visceral fat ratio was measured at week 12. Blood glucose and serum lipid level were detected by automatic biochemical analyzer. The gut microbiota of mice was examined using 16 s rRNA sequencing method. LF treatment significantly reduced the levels of visceral adipose ratio, blood glucose, triglyceride, total cholesterol and low-density lipoprotein cholesterol (LDL-C) in high-fat diet mice (p < 0.05). It can be seen that drinking water with 2% LF had a significant impact on metabolic disorders. At the same time, the Firmicutes/Bacteroidetes ratio(F/B) of LF treated mice was decreased. The abundance of Deferribacteres, Oscillibacter, Butyricicoccus, Acinetobacter and Mucispirillum in LF treatment group were significantly decreased, and the abundance of Dubosiella was significantly increased (p < 0.05). In the LF-treated group, the expression levels of glucose metabolism genes in gut microbiota were increased, and the expression levels of pyruvate metabolism genes were decreased. It can be seen that metabolic disorders were related to intestinal flora. In conclusion, LF regulates metabolic disorders by regulating intestinal flora.
Keywords: Intestinal flora; Lactoferrin; Metabolic disorders.
© 2022. The Author(s).
Conflict of interest statement
The authors declare no conflict of interest.
Figures


Similar articles
-
Lactoferrin alleviates chronic low‑grade inflammation response in obese mice by regulating intestinal flora.Mol Med Rep. 2024 Aug;30(2):138. doi: 10.3892/mmr.2024.13262. Epub 2024 Jun 14. Mol Med Rep. 2024. PMID: 38873986 Free PMC article.
-
Effects of Metformin Combined with Lactoferrin on Lipid Accumulation and Metabolism in Mice Fed with High-Fat Diet.Nutrients. 2018 Nov 2;10(11):1628. doi: 10.3390/nu10111628. Nutrients. 2018. PMID: 30400147 Free PMC article.
-
[Heat-inactivated Streptococcus thermophilus MN002 alleviate lipid metabolism of high fat diet-fed induced obese mice through modulating gut microbiota structure and bile acids].Wei Sheng Yan Jiu. 2023 Mar;52(2):259-264. doi: 10.19813/j.cnki.weishengyanjiu.2023.02.014. Wei Sheng Yan Jiu. 2023. PMID: 37062689 Chinese.
-
Synergistic Effect of Retinoic Acid and Lactoferrin in the Maintenance of Gut Homeostasis.Biomolecules. 2024 Jan 8;14(1):78. doi: 10.3390/biom14010078. Biomolecules. 2024. PMID: 38254678 Free PMC article. Review.
-
Research Advances of Lactoferrin in Electrostatic Spinning, Nano Self-Assembly, and Immune and Gut Microbiota Regulation.J Agric Food Chem. 2022 Aug 24;70(33):10075-10089. doi: 10.1021/acs.jafc.2c04241. Epub 2022 Aug 15. J Agric Food Chem. 2022. PMID: 35968926 Review.
Cited by
-
Association analysis of gut microbiota with LDL-C metabolism and microbial pathogenicity in colorectal cancer patients.Lipids Health Dis. 2024 Nov 8;23(1):367. doi: 10.1186/s12944-024-02333-4. Lipids Health Dis. 2024. PMID: 39516755 Free PMC article.
-
Lactoferrin alleviates chronic low‑grade inflammation response in obese mice by regulating intestinal flora.Mol Med Rep. 2024 Aug;30(2):138. doi: 10.3892/mmr.2024.13262. Epub 2024 Jun 14. Mol Med Rep. 2024. PMID: 38873986 Free PMC article.
-
Exploring the modulatory role of bovine lactoferrin on the microbiome and the immune response in healthy and Shiga toxin-producing E. coli challenged weaned piglets.J Anim Sci Biotechnol. 2024 Mar 6;15(1):39. doi: 10.1186/s40104-023-00985-3. J Anim Sci Biotechnol. 2024. PMID: 38449023 Free PMC article.
-
Gene-Diet Interactions: Viability of Lactoferrin-Fortified Yoghurt as an Element of Diet Therapy in Patients Predisposed to Overweight and Obesity.Foods. 2023 Aug 2;12(15):2929. doi: 10.3390/foods12152929. Foods. 2023. PMID: 37569198 Free PMC article.
-
Milk Bioactive Compounds and Gut Microbiota Modulation: The Role of Whey Proteins and Milk Oligosaccharides.Foods. 2024 Mar 16;13(6):907. doi: 10.3390/foods13060907. Foods. 2024. PMID: 38540897 Free PMC article. Review.
References
Publication types
MeSH terms
Substances
LinkOut - more resources
Full Text Sources
Medical
