. 2022 Jul 22;23(1):529.
doi: 10.1186/s12864-022-08744-w.

GsMYB7 encoding a R2R3-type MYB transcription factor enhances the tolerance to aluminum stress in soybean (Glycine max L.)

Affiliations

GsMYB7 encoding a R2R3-type MYB transcription factor enhances the tolerance to aluminum stress in soybean (Glycine max L.)

Hongjie Wang et al. BMC Genomics. .

Abstract

Background: MYB transcription factor (TF) is one of the largest families of TFs in plants and play essential roles in plant growth and development, and is involved in responses to biological and abiotic stress. However, there are few reports on GsMYB7 gene in soybean under aluminum acid stress, and its regulatory mechanism remains unclear.

Results: The GsMYB7 protein is localized in the nucleus and has transcriptional activation ability. Quantitative real-time PCR (qRT-PCR) results showed that GsMYB7 held a constitutive expression pattern rich in roots. When AlCl3 concentration was 25 µM, the total root surface area (SA) of GsMYB7 transgenic lines were 34.97% higher than that of wild-type Huachun 6 (HC6). While the accumulation of Al3+ in root tip of transgenic plants after aluminum treatment was 17.39% lower than that of wild-type. RNA-sequencing analysis indicated that over 1181 genes were regulated by GsMYB7 and aluminum stress. Among all the regulated genes, the expression levels of glutathione peroxidase, protein kinase, cytochrome and other genes in the transgenic lines were significantly higher than those in wild type by acidic aluminum stress. The bioinformatics and qRT-PCR results showed that 9 candidate genes were induced under the treatments of acidic aluminum stress which were indirectly and/or directly regulated by GsMYB7. After AlCl3 treatments, the transcripts of these genes in GsMYB7 transgenic seedlings were significantly higher than those of wide-type HC6.

Conclusions: The results suggested that GsMYB7 may enhance soybean tolerance to acidic aluminum stress by regulating the downstream genes.

Keywords: Acidic aluminum; GsMYB7; R2R3-MYB; Soybean; Transcription factor.


Conflict of interest statement

The authors declare that they have no competing interests.

Figures
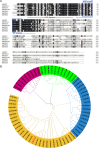
Fig. 1
Fig. 1
Homology analysis of GsMYB7 and other MYB transcription factors. A Multiple sequence alignment of GsMYB7 and R2R3 MYB family members from soybean. B Phylogenetic tree analysis of GsMYB7 and MYB proteins. The comparison of amino acid sequences was conducted by the software of DNAMAN9.0. The phylogenetic tree was constructed by the neighbor-joining method using the software of MEGA 7.0. All the amino acid sequences of MYB proteins were from NCBI database (https://www.ncbi.nlm.nih.gov/). The detailed information of MYB proteins was available from the Additional file 1: Table S4
Fig. 2
Fig. 2
Transcriptional activity detection and subcellular localization of GsMYB7 protein. A Transcriptional activation of GsMYB7 protein. B Subcellular localization of GsMYB7 protein. The ORF of GsMYB7 gene was fused with the GAL4 DNA binding region of pGBKT7 vector and expressed in yeast strain Y2H Gold. After the transformation, the two positive clones were transferred to SD/-TRP solid medium, and the other group was added with substrate X-a-Gal. The constructed fusion expression vector of pCAMBIA1302-eGFP-GsMYB7 and empty vector pCAMBIA1302-eGFP were transformed into Agrobacterium tumefaciens GV3101, respectively, cultured with the virus protein P19 in equal volume, and then injected into 4-week old Nicotiana tabacum L epidermal cells. After cultured for 48 h later, the leaves were observed by laser confocal microscopy (Carl Zeiss, Jena, Germany)
Fig. 3
Fig. 3
Expression pattern analysis of GsMYB7. A Tissue expression pattern of GsMYB7. The samples were taken from the soybean roots, stems, leaves, flowers and pods of wild soybean BW69 growing under normal nutrient solution. B Gene expression of GsMYB7 in the root of wild soybean BW69. The wild soybean BW69 were cultured for 6 h in the nutrient solutions containing 0, 15, 30, 50, 75 and 100 μM AlCl3, respectively. Using soybean Actin3 as internal reference gene, three independent replicates were detected by 2^−△△CT method. The asterisks in figure A indicate significant differences between roots and other soybean tissues (*P < 0.05; **P < 0.01). The asterisk in figure B indicates that there is a significant difference between 0 μM AlCl3 and other Al concentration (15, 30, 50, 75 and 100 μM AlCl3) treatment (*P < 0.05; **P < 0.01)
Fig. 4
Fig. 4
Detection of transgenic soybean lines. A PCR identification using Bar gene primers (Additional file 3: Table S10). B The gene expression of transgenic soybean lines was detected by qRT-PCR. (C) Tolerance of transgenic plants to herbicides. The blade side with the tick is the side to which the herbicide is applied, and the left side is untreated with herbicide. The relative gene expression levels of HC6 (WT) and GsMYB7 transgenic soybean lines were calculated by 2^−△△CT method in three separate biological experiments. WT: wild type, HC6; L1, L2, L3, L4, L5: GsMYB7 transgenic T3 generation soybean
Fig. 5
Fig. 5
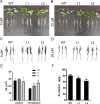
Tolerant phenotype to Al stress of GsMYB7 transgenic lines. A, B The phenotypes were observed after 5 days of treatment with CaCl2 solution containing different concentrations of AlCl3. The seedlings were treated with 0, 25 μM AlCl3, respectively. C, D The scanned roots were observed after AlCl3 treatment with concentrations of 0 and 25 μM, respectively. E The total root area of L1, L2 and WT under 0 and 25 μM AlCl3 treatments for 5 days. F The total Al accumulations in L1, L2 and WT were determined via ICP-AES analysis. The asterisk indicated that there was significant difference between HC6 and GsMYB7 transgenic lines (*P < 0.05; **P < 0.01). WT: wild type, Huachun 6; L1, L2: GsMYB7 transgenic soybean of T3 generation
Fig. 6
Fig. 6
Differential gene statistics. The up-regulated and down-regulated significantly expressed genes in each group of differential expression analysis were statistically analyzed and shown in a bar chart. The black column represents the up-regulated gene frequency and the gray column represents the down-regulated gene frequency. WTVSWT_A: Comparative analysis of differential genes between wild-type (HC6) and wild-type aluminum treatment; WTVSG7L1: Comparative analysis of differential genes between wild-type (HC6) and GsMYB7 transgenic lines; G7L1VSVSG7L1_a: Comparative analysis of differential genes between GsMYB7 transgenic lines and GSMYB7 transgenic lines under acidic aluminum treatment; WT_AVSG7L1_A: Comparative analysis of differential genes between wild type (HC6) aluminum treatment and GsMYB7 transgenic line acidic aluminum treatment
Fig. 7
Fig. 7
Cluster analysis of expression levels for differential genes. Log10 (FPKM + 1) was used for gene expression display. The horizontal axis was for the samples, while the vertical axis was for the genes. Different colors represented expression levels of different genes. The colors from blue to white to red represented the expression from lower to higher levels. Higher expression genes are marked in red and lower expression genes are marked in dark blue
Fig. 8
Fig. 8
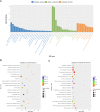
Transcriptome study of differentially expressed genes (DEGs) in four groups of items. A The histogram of GO enrichment analysis results. B GO enrichment scatter plot of differential genes. C KEGG enrichment scatter plot of differential genes. The results of GO enrichment analysis were shown in a bar chart with the three basic GO classifiers (Biological Process, Cellular Component, and Molecular Function) and the next level term of each type on the horizontal axis. The ordinate is the number of genes in a term (the term and its offspring). The abscissa of the scatter plot is the enrichment factor “Rich factor” which is the number of differential genes located in this KEGG (GO)/total genes located in this KEGG (GO). The vertical axis is the pathway term with high enrichment degree. After multiple checks, P value ranges [0, 1] were represented by colors. The size of the dot indicated the numbers of different genes in the term
Fig. 9
Fig. 9
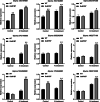
Expression patterns of downstream genes regulated by GsMYB7. Soybean plants were cultured in CaCl2 solution supplemented with 15 μM AlCl3 (pH4.5) for 8 h. The expression patterns of downstream responsive genes regulated by GsMYB7 were detected. Using soybean Actin3 as the internal reference gene, qRT-PCR was used to detect the gene expression level before and after aluminum treatment. The asterisks indicated that the transcripts of investigated genes in GsMYB7 transgenic lines were significantly different from those of wild type treated with and without AlCl3 (*P < 0.05; **P < 0.01). All the information of gene sequences were from the NCBI database (https://www.ncbi.nlm.nih.gov/) shown in Additional file 1: Table S5

Similar articles

Cited by

References

    1. Zeng QY, Yang CY, Ma QB, Li XP, Dong WW, Nian H. Identification of wild soybean miRNAs and their target genes responsive to aluminum stress. BMC Plant Biol. 2012;12:182. doi: 10.1186/1471-2229-12-182. - DOI - PMC - PubMed
    1. Kochian LV, Hoekenga OA, Pineros MA. How do crop plants tolerate acid soils? Mechanisms of aluminum tolerance and phosphorous efficiency. Annu Rev Plant Biol. 2004;55:459–493. doi: 10.1146/annurev.arplant.55.031903.141655. - DOI - PubMed
    1. Suo H, Ma Q, Ye K, Yang C, Tang Y, Hao J, Zhang ZJ, Chen M, Feng Y, Nian H. Overexpression of AtDREB1A causes a severe dwarf phenotype by decreasing endogenous gibberellin levels in soybean [Glycine max (L.) Merr] Plos One. 2012;7(9):e45568. doi: 10.1371/journal.pone.0045568. - DOI - PMC - PubMed
    1. Walter JH, Yunxia W, Dejene E. The role of the root apoplast in aluminium-induced inhibition of root elongation and in aluminium resistance of plants: a review. Ann Bot-London. 2010;106(1):185–197. doi: 10.1093/aob/mcq053. - DOI - PMC - PubMed
    1. Li XF, Ma JF, Matsumoto H. Pattern of aluminum-induced secretion of organic acids differs between rye and wheat. Plant Physiol. 2000;123(4):1537–1544. doi: 10.1104/pp.123.4.1537. - DOI - PMC - PubMed

MeSH terms

LinkOut - more resources