

AURKA is a prognostic potential therapeutic target in skin cutaneous melanoma modulating the tumor microenvironment, apoptosis, and hypoxia
- PMID: 35870015
- PMCID: PMC11797485
- DOI: 10.1007/s00432-022-04164-1
AURKA is a prognostic potential therapeutic target in skin cutaneous melanoma modulating the tumor microenvironment, apoptosis, and hypoxia
Abstract
Background: AURKA, Aurora kinase A encoding gene, is an important signaling hub gene for mitosis. In recent years, AURKA has been implicated in the occurrence and development of several cancers. However, its relationship with the tumor microenvironment in skin cutaneous melanoma (SKCM) and the molecular mechanisms underlying its effects are still unclear.
Method: We adopted a variety of bioinformatics methods to comprehensively analyze the potential carcinogenesis of AURKA in SKCM, and constructed a prognostic nomogram model. We also dentified an inhibitor targeting AURKA and verified its therapeutic effects against SKCM using the molecular docking technology.
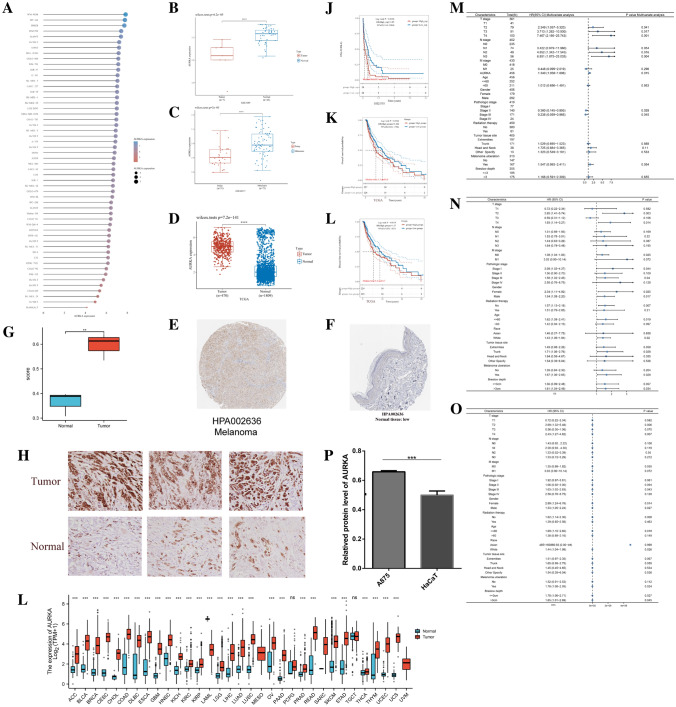
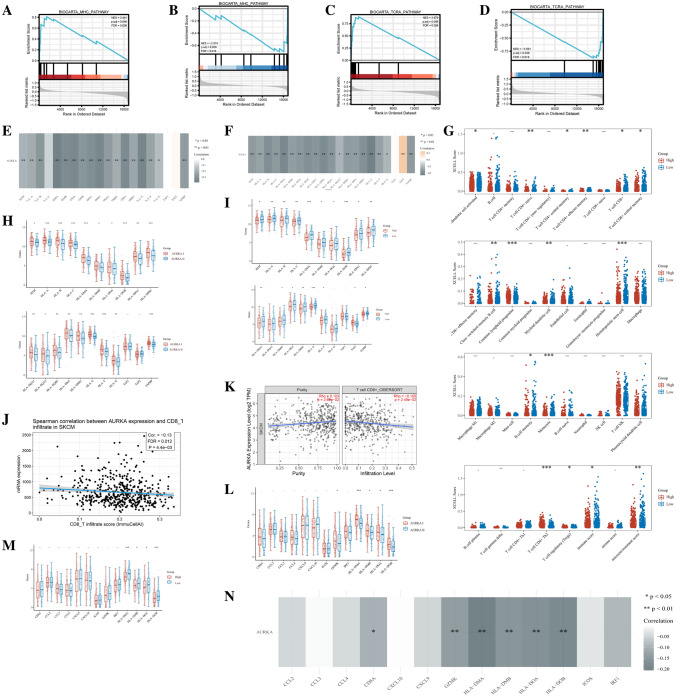
Results: We found that abnormally high expression of AURKA was responsible for driving the occurrence and development of SKCM, and affected various pathological factors in SKCM. In addition, AURKA was established as an independent marker of poor SKCM prognosis. We also characterized the potential mechanisms by which AURKA manifests its effects in SKCM and found that AURKA inhibits the infiltration of CD8+ T cells and promotes hypoxia by activating the TGF-β signaling pathway. At the same time, the high AURKA expression group had higher tumor stemness index and promoted cell proliferation and metastasis. Finally, the small-molecule compound ZNC97018978 targeting AURKA screened by molecular docking technology can inhibit the proliferation, invasion and metastasis of SKCM. The possible mechanism is that ZNC97018978 induces apoptosis by arresting the cell cycle, thereby inhibiting cell proliferation.
Conclusion: AURKA is the core hub gene driving the occurrence and development of SKCM, and its expression is regulated by epigenetic modifications. AURKA can regulate the infiltration level of various immune cells in the tumor microenvironment, reshape the immunosuppressive tumor microenvironment, and apoptosis, and hypoxia. Thus, it is a prognostic biomarker and potential therapeutic target in SKCM. ZNC97018978 is an effective and safe inhibitor of AURKA in vitro; its safety and effectiveness in vivo as a potential treatment for cutaneous melanoma should be further determined.
Keywords: AURKA; Apoptosis; Hypoxia; Molecular docking technology; SKCM; Tumor microenvironment.
© 2022. The Author(s), under exclusive licence to Springer-Verlag GmbH Germany, part of Springer Nature.
Conflict of interest statement
The authors declare that they do not have any conflicts of interest.
Figures


Similar articles
-
Construction and validation of a lipid metabolism-related genes prognostic signature for skin cutaneous melanoma.Biochem Biophys Res Commun. 2025 Aug 15;775:152115. doi: 10.1016/j.bbrc.2025.152115. Epub 2025 May 29. Biochem Biophys Res Commun. 2025. PMID: 40460484
-
Integrated analysis reveals SMARCD1 is a potential biomarker and therapeutic target in skin cutaneous melanoma.J Cancer Res Clin Oncol. 2023 Oct;149(13):11619-11634. doi: 10.1007/s00432-023-05064-8. Epub 2023 Jul 4. J Cancer Res Clin Oncol. 2023. PMID: 37401939 Free PMC article.
-
Integrative lactylation and tumor microenvironment signature as prognostic and therapeutic biomarkers in skin cutaneous melanoma.J Cancer Res Clin Oncol. 2023 Dec;149(20):17897-17919. doi: 10.1007/s00432-023-05483-7. Epub 2023 Nov 13. J Cancer Res Clin Oncol. 2023. PMID: 37955686 Free PMC article.
-
Systemic pharmacological treatments for chronic plaque psoriasis: a network meta-analysis.Cochrane Database Syst Rev. 2021 Apr 19;4(4):CD011535. doi: 10.1002/14651858.CD011535.pub4. Cochrane Database Syst Rev. 2021. Update in: Cochrane Database Syst Rev. 2022 May 23;5:CD011535. doi: 10.1002/14651858.CD011535.pub5. PMID: 33871055 Free PMC article. Updated.
-
Systemic pharmacological treatments for chronic plaque psoriasis: a network meta-analysis.Cochrane Database Syst Rev. 2017 Dec 22;12(12):CD011535. doi: 10.1002/14651858.CD011535.pub2. Cochrane Database Syst Rev. 2017. Update in: Cochrane Database Syst Rev. 2020 Jan 9;1:CD011535. doi: 10.1002/14651858.CD011535.pub3. PMID: 29271481 Free PMC article. Updated.
Cited by
-
Comprehensive pan-cancer analysis and the regulatory mechanism of AURKA, a gene associated with prognosis of ferroptosis of adrenal cortical carcinoma in the tumor micro-environment.Front Genet. 2023 Jan 4;13:996180. doi: 10.3389/fgene.2022.996180. eCollection 2022. Front Genet. 2023. PMID: 36685952 Free PMC article.
-
Characteristics and significance of programmed cell death-related gene expression signature in skin cutaneous melanoma.Skin Res Technol. 2024 May;30(5):e13739. doi: 10.1111/srt.13739. Skin Res Technol. 2024. PMID: 38766879 Free PMC article.
-
Knowledge mapping of AURKA in Oncology:An advanced Bibliometric analysis (1998-2023).Heliyon. 2024 May 30;10(11):e31945. doi: 10.1016/j.heliyon.2024.e31945. eCollection 2024 Jun 15. Heliyon. 2024. PMID: 38912486 Free PMC article.
-
Research on biliary atresia and epigenetic factors from the perspective of transcriptomics: identification of key genes and experimental validation.Front Pediatr. 2025 Jul 17;13:1624671. doi: 10.3389/fped.2025.1624671. eCollection 2025. Front Pediatr. 2025. PMID: 40746357 Free PMC article.
-
CircAKR1B10 interacts with EIF4A3 to stabilize AURKA and promotes IL-22-induced proliferation, migration and invasion in keratinocytes.Arch Dermatol Res. 2024 Aug 23;316(8):561. doi: 10.1007/s00403-024-03302-8. Arch Dermatol Res. 2024. PMID: 39177716
References
-
- Bajor DL, Mick R, Riese MJ, Huang AC, Sullivan B, Richman LP, Torigian DA, George SM, Stelekati E, Chen F, Melenhorst JJ, Lacey SF, Xu X, Wherry EJ, Gangadhar TC, Amaravadi RK, Schuchter LM, Vonderheide RH (2018) Long-term outcomes of a phase I study of agonist CD40 antibody and CTLA-4 blockade in patients with metastatic melanoma. Oncoimmunology 7(10):e1468956. 10.1080/2162402x.2018.1468956 - PMC - PubMed
-
- Becht E, Giraldo NA, Lacroix L, Buttard B, Elarouci N, Petitprez F, Selves J, Laurent-Puig P, Sautès-Fridman C, Fridman WH, de Reyniès A (2016) Erratum to: Estimating the population abundance of tissue-infiltrating immune and stromal cell populations using gene expression. Genome Biol 17(1):249. 10.1186/s13059-016-1113-y - PMC - PubMed
-
- Bindea G, Mlecnik B, Tosolini M, Kirilovsky A, Waldner M, Obenauf AC, Angell H, Fredriksen T, Lafontaine L, Berger A, Bruneval P, Fridman WH, Becker C, Pagès F, Speicher MR, Trajanoski Z, Galon J (2013) Spatiotemporal dynamics of intratumoral immune cells reveal the immune landscape in human cancer. Immunity 39(4):782–795. 10.1016/j.immuni.2013.10.003 - PubMed
MeSH terms
Substances
LinkOut - more resources
Full Text Sources
Medical
Research Materials
Miscellaneous
